

Consolidating or choppy markets are one of the fastest ways to turn a confident trade into a frustrating loss. When price lacks clear direction, entries and exits become guesses, indicators misfire, and the temptation to hold losing positions grows. The good news is that you can stack a few simple techniques to avoid most of these sideways periods and focus your capital on cleaner, higher-probability setups.
Table of Contents
- Why avoiding consolidating markets matters
- Quick subjective tricks you can use immediately
- Objective indicators: rules you can follow
- My favorite method: trend tables and conditional signal filters
- How to fold these techniques into a trading routine
- Final thoughts
Why avoiding consolidating markets matters
Consolidation makes the market extremely unpredictable. Entries that look promising in hindsight often fail in real time. Indicators and buy-sell systems perform much better in trends than in ranges, so filtering out consolidating conditions increases the accuracy of your signals. Finally, trading in a choppy market increases the chance of holding trades too long or getting whipsawed out—both of which hurt performance and confidence.
Quick subjective tricks you can use immediately
These are simple, visual checks you can add to any chart. They are subjective by design and meant to be fast heuristics before you commit to a trade.
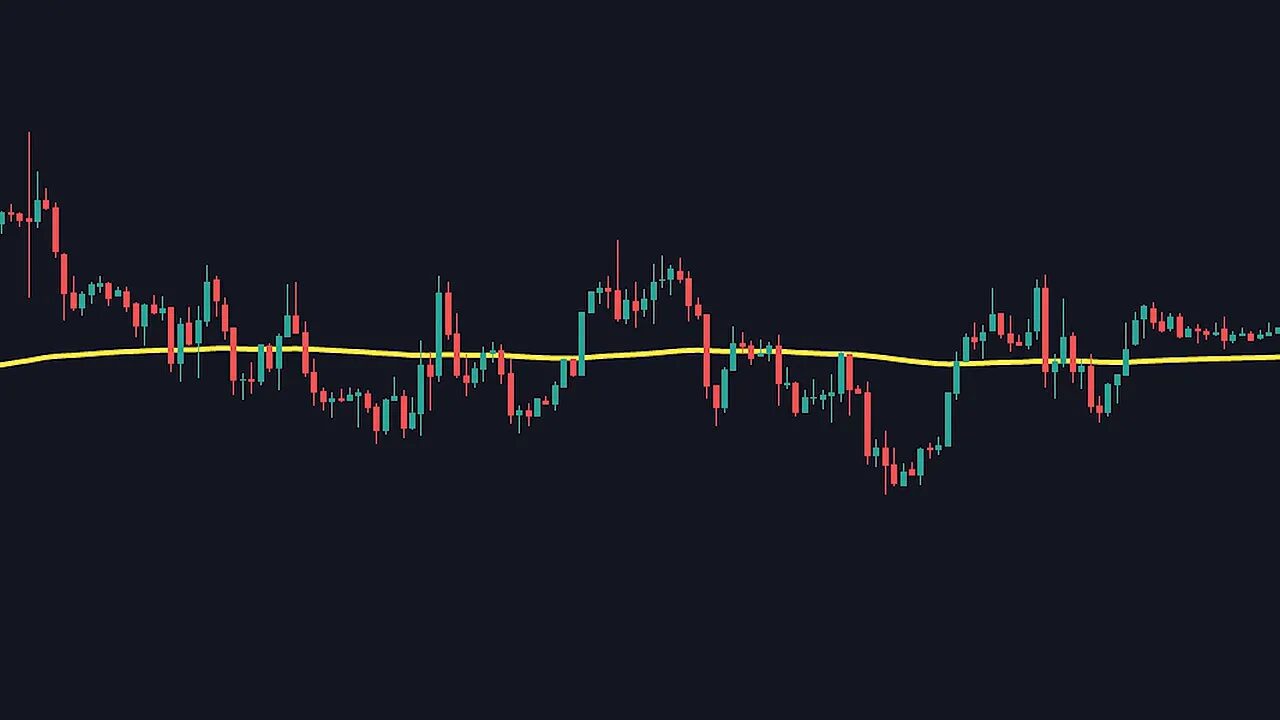
Use the 200 EMA slope as a trend compass
Add a 200-period exponential moving average (EMA) to your chart. Look at the steepness of the line. A flat or gently sloping 200 EMA usually means the market is consolidating. A steeply angled 200 EMA suggests a solid trend and a better environment for most strategies.
Remember: this is not an entry signal by itself. It simply tells you whether the market environment is favorable for trend-following or not.
Watch the distance between price and the EMA
Is price hugging the EMA like a magnet, or being repelled and staying far away? When price clings to the 200 EMA, expect choppy action and frequent givebacks. When price trades with meaningful distance from the EMA and moves away consistently, that’s a sign of trending strength.
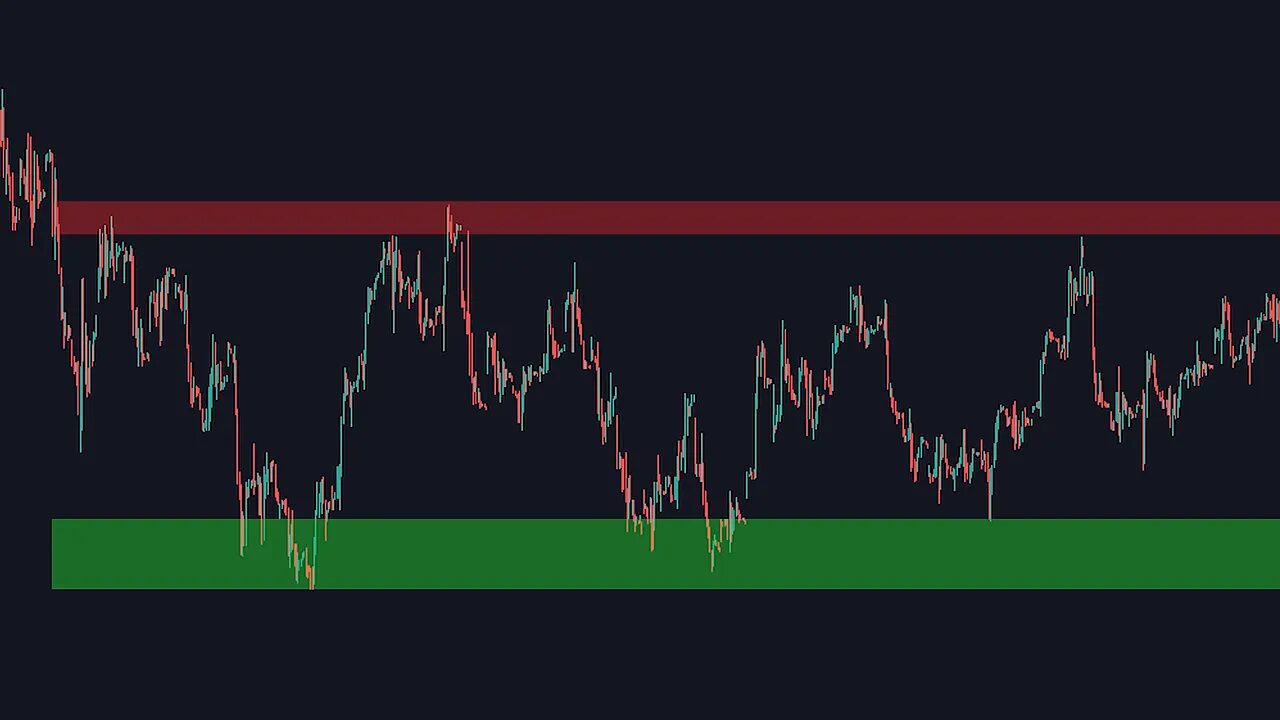
Higher time frame support and resistance
Draw major zones on a higher time frame (1-hour, daily). Price tends to trend strongly right after breaking into a new support or resistance zone. If price has been bouncing between two established zones for a long time, you are likely in a range and should be cautious.
Objective indicators: rules you can follow
If you prefer rule-based filters, these objective indicators will give you a clear yes or no about market momentum.
ADX: use a numeric threshold
The Average Directional Index (ADX) measures momentum strength without indicating direction. A simple rule: if ADX is below 25, the market is likely ranging; if ADX is above 25, momentum is strong enough to consider trend trades.
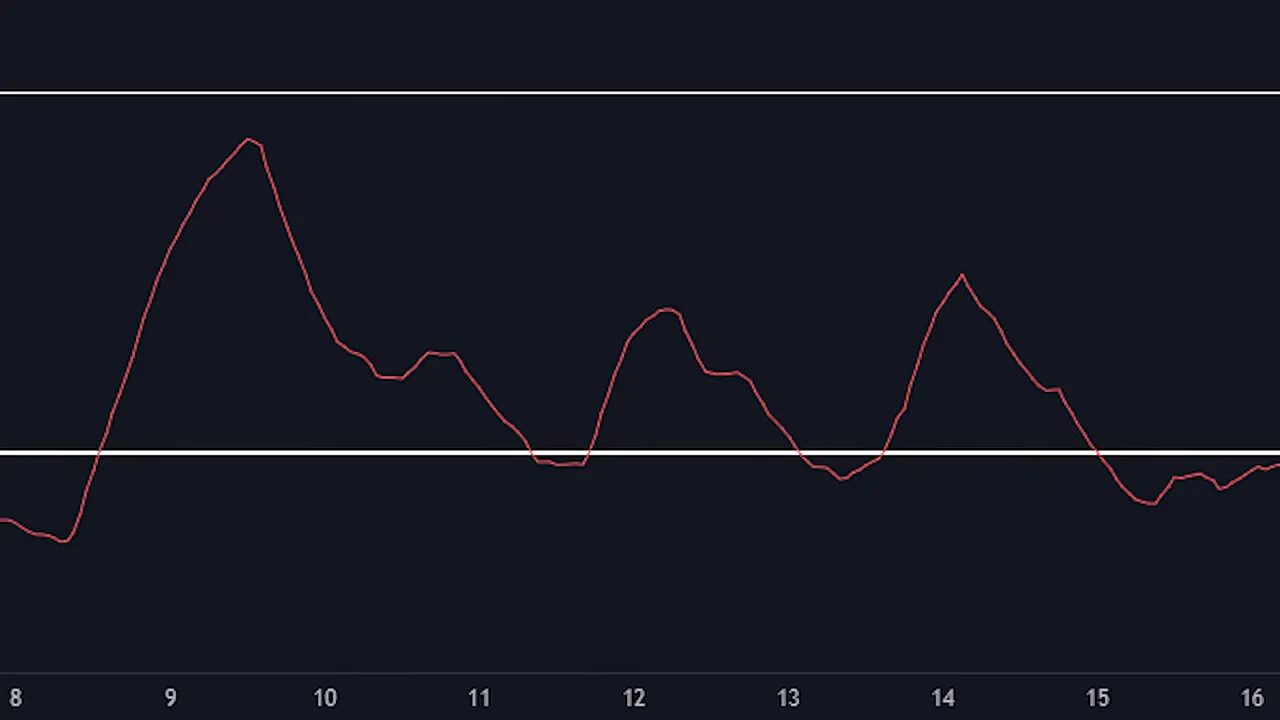
ADX is not perfect, but it’s a reliable, objective hint that complements visual checks. Use it to reduce false signals from your systems.
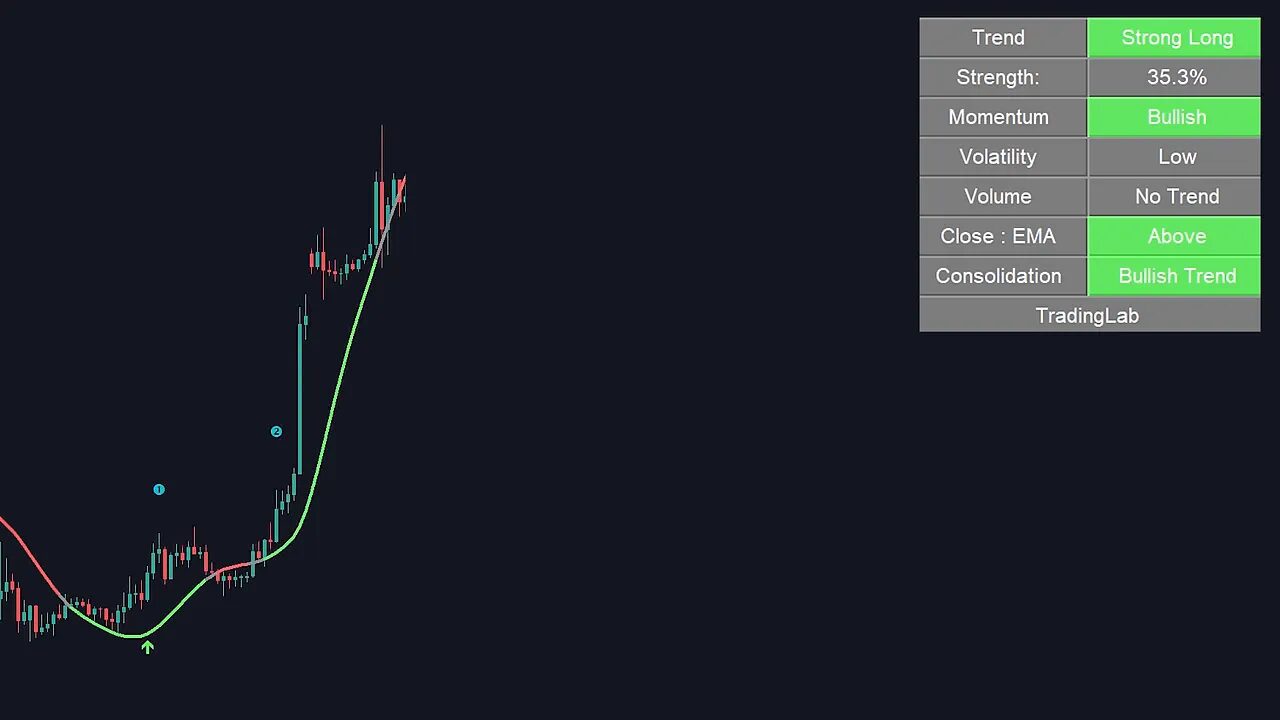
My favorite method: trend tables and conditional signal filters
The most reliable approach I use daily combines a buy-sell signal with a separate trend filter or trend table. The concept is simple and powerful: only take buy or sell signals when the trend filter confirms the market is trending in the same direction.
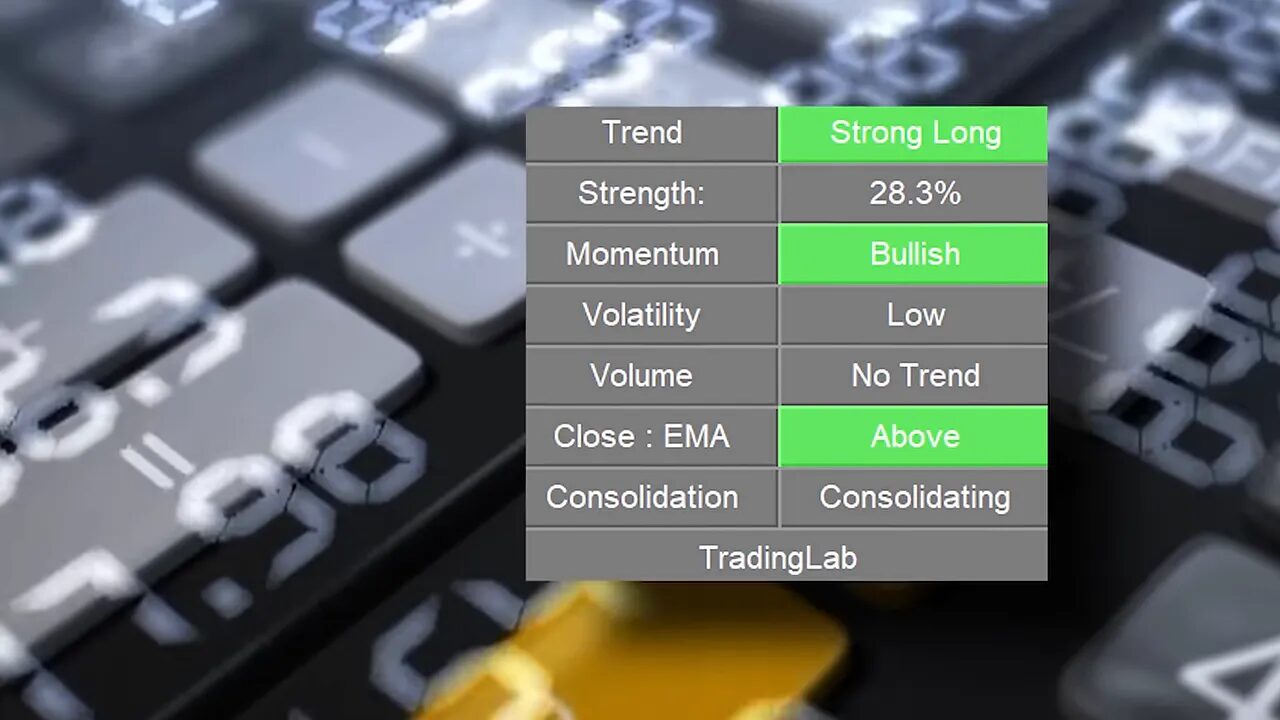
The trend table is a numeric, non-subjective readout that answers whether the market is consolidating or trending. If the table says the market is consolidating, do not enter on indicator signals—even if the indicator flashes a perfect-looking setup.
Why this works
- Indicator accuracy improves because most buy-sell systems were tuned for directional movement, not sideways noise.
- You will get fewer signals but each signal will carry higher probability and larger potential moves.
- It is flexible: the trend table filter works with buy-sell indicators, price-action breakouts, or smart money concepts.
Here is how to apply it in practice:
- Check your trend table or trend filter. If it says consolidating, skip potential entries.
- If the table shows an uptrend, follow long signals only. If it shows a downtrend, follow short signals only.
- Use supporting metrics like trend strength and volatility to size risk and manage targets.
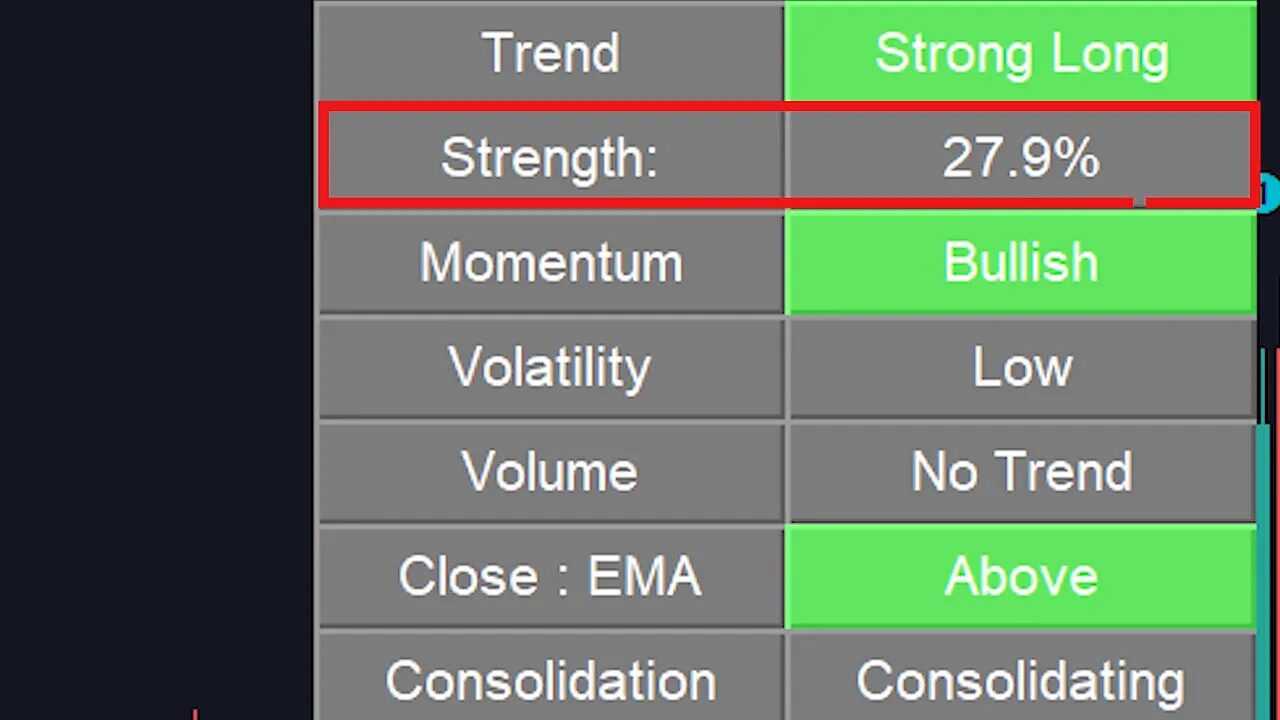
Trend strength is often shown as a percentage. Higher values mean a stronger, more reliable trend. Volatility tells you how much price is likely to move; combine both when picking stop loss and take profit levels.
How to fold these techniques into a trading routine
Integrate these filters before you place a trade. A simple pre-trade checklist might look like this:
- Is the 200 EMA slope suggesting a trend? If no, skip or tighten risk.
- Is price distanced from the 200 EMA rather than hugging it?
- Does ADX confirm momentum (above 25)?
- Does the trend table or trend filter say trending (not consolidating)?
- If all the above align, take the trade that your entry system or price action calls.
Be prepared to accept fewer trades. Most of the time markets are sideways, and that is okay. Fewer, higher-quality trades will preserve capital and improve long-term results.
Final thoughts
Avoiding consolidating markets is less about perfect predictions and more about disciplined filtering. Use a combination of visual checks and objective indicators to keep your edge. When the market gives clear direction, your signals will start to perform the way they were designed to. Trade less, trade better, and let the market show you when it is ready to move.
Why should I avoid consolidating markets?
Consolidating markets make entries and exits unpredictable, increase false signals for indicators, and raise the risk of whipsaws and extended losing trades.
How do I use the 200 EMA to spot consolidation?
Look at the 200 EMA slope and the distance between price and the EMA. A flat EMA with price clustering around it suggests consolidation. A steep EMA with price moving away suggests a trend.
What ADX value indicates the market is trending?
A common rule is ADX above 25 indicates sufficient momentum to be considered trending. ADX below 25 typically signals a ranging market.
Won’t filtering for trends reduce the number of trades?
Yes. Expect fewer signals, because markets spend a lot of time consolidating. The tradeoff is higher accuracy and typically larger moves when you do enter.
Can I use these methods with price action or other indicators?
Absolutely. Trend filters and ADX are neutral tools that can be combined with buy-sell indicators, price-action breakouts, smart money techniques, or any entry method to reduce false signals.
