

Table of Contents
- Why this approach works
- Market structure: higher highs, higher lows (and the opposite)
- Liquidity: why price chases stops
- Consolidation is a liquidity machine
- The strategy, step by step
- Real chart examples
- Supply and demand zones: a quick primer
- Practical tips for execution
- FAQ
- Final thought
Why this approach works
The edge in trading isn’t a magic indicator. It comes from combining two simple, repeatable ideas: market structure and liquidity. When you use both together you create setups with very attractive risk to reward — small stops and big profit targets — that happen again and again across markets.
Market structure: higher highs, higher lows (and the opposite)
Every chart follows the same cycles: uptrends, downtrends, and consolidation. The clearest way to read these is by watching for breaks of structure and the sequence of highs and lows.
In an uptrend, price makes higher highs and higher lows. A break of the previous high signals continuation and a break of the latest higher low signals the trend may be ending.
In a downtrend it is the opposite: lower highs and lower lows. Learning to label these swings in real time helps you avoid trading against the dominant direction.
Liquidity: why price chases stops
Liquidity is simply where orders sit. Stops and limit orders create pools of liquidity and they fuel big moves when consumed. Most traders place stops logically — below a swing low for longs, above a swing high for shorts — which concentrates resting liquidity at those extremes.
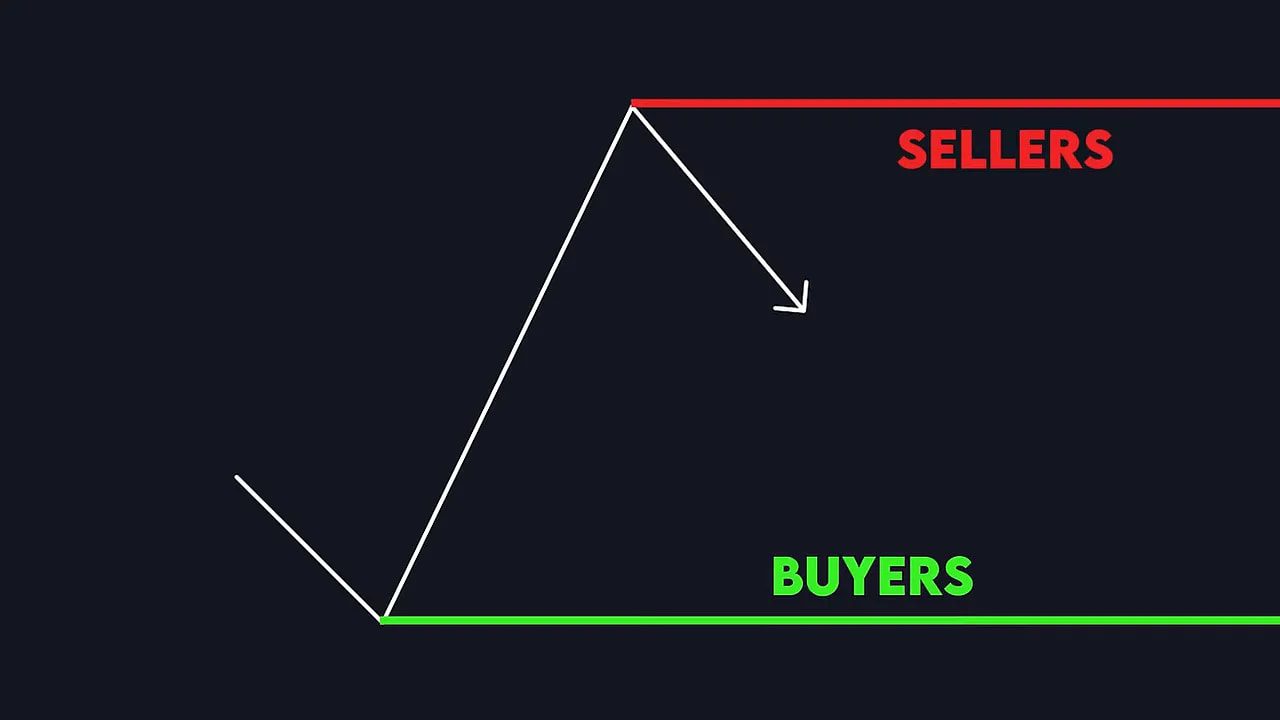
Price tends to gravitate toward those pools, take them out, then reverse. That short excursion to harvest stops is often a liquidity grab or what many call a false breakout.
Consolidation is a liquidity machine
When price moves sideways with equal highs and equal lows, you get large pools of stop orders on both sides. That consolidation becomes a launchpad: price needs to touch one side to get the fuel to break and then often swings toward the opposite side.
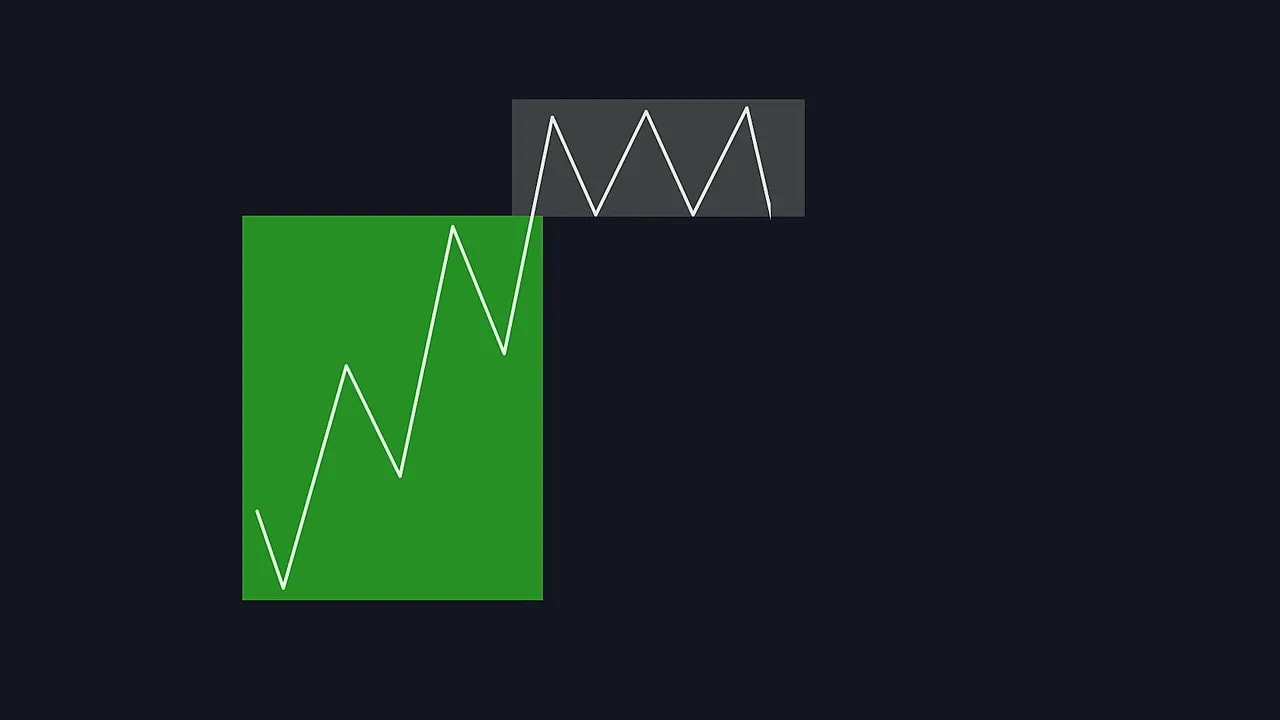
If you treat those equal highs/lows as liquidity targets, you can anticipate where stops will be and plan entries that align with the prevailing trend.
The strategy, step by step
- Identify the trend by labeling swings. Only take longs in an uptrend and shorts in a downtrend.
- Find consolidation with equal highs or equal lows. This is where liquidity is pooling.
- Wait for price to reach and break the liquidity area (the liquidity grab). This move gathers the fuel you want.
- After the grab, look for a high-probability entry in the direction of the trend from a supply or demand zone created by the prior impulsive move.
- Place a tight stop beyond the zone and target the origin of the original move (the previous swing high for longs, the previous swing low for shorts).
Why the risk to reward is so strong
Your stop sits just outside a defined supply or demand zone, which keeps the risk small. The target is the full previous swing, which is often several times larger than that stop. That asymmetry creates the “insane” risk to reward many traders chase.
Real chart examples
Example 1 — Long after a downside liquidity grab
Start with an uptrend: higher highs and higher lows. Price consolidates and forms equal lows, creating liquidity below. Price breaks those lows to grab liquidity, then returns to a demand zone formed by the earlier impulsive leg. Enter the long when price reaches that demand, stop below the zone, and take profit at the previous high.
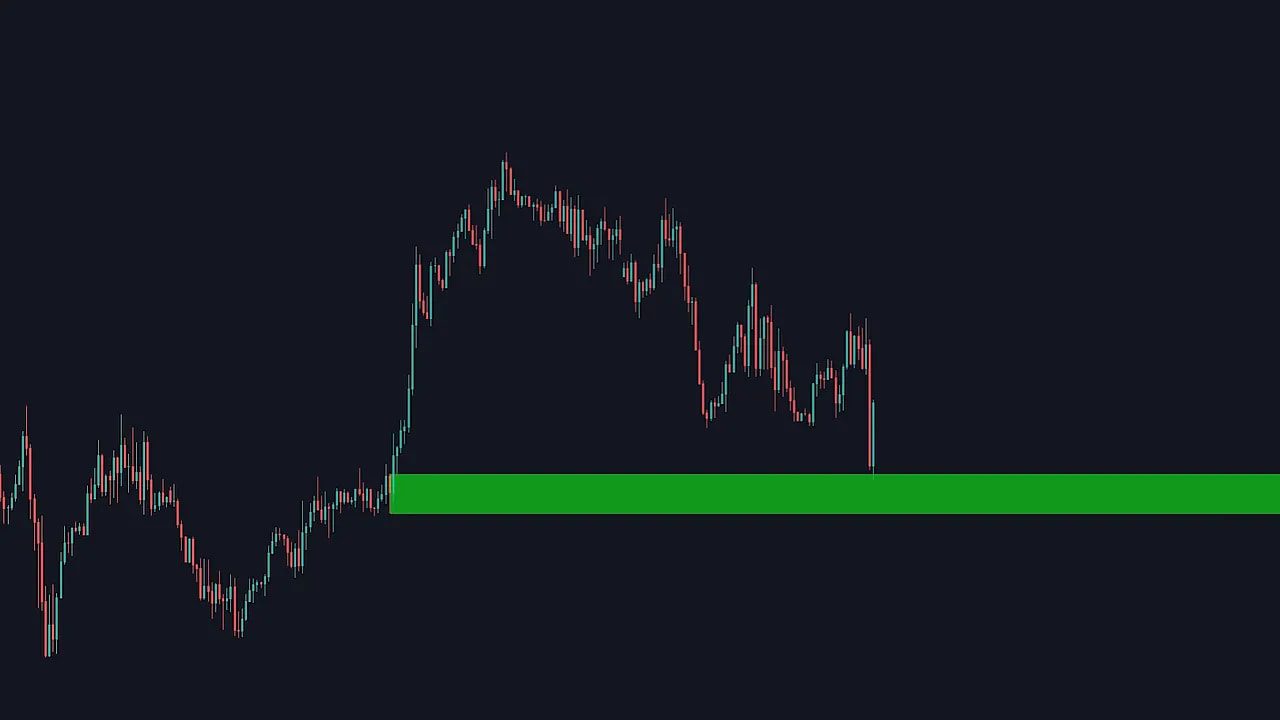
This gives a small stop and a target at the prior swing high — ideal risk to reward.
Example 2 — Short after an upside liquidity grab
In a downtrend look for equal highs that collect liquidity above. Wait for price to take out those highs, then look for a supply zone created by the previous impulsive leg. Enter short at the supply, stop above the zone, and target the original low.
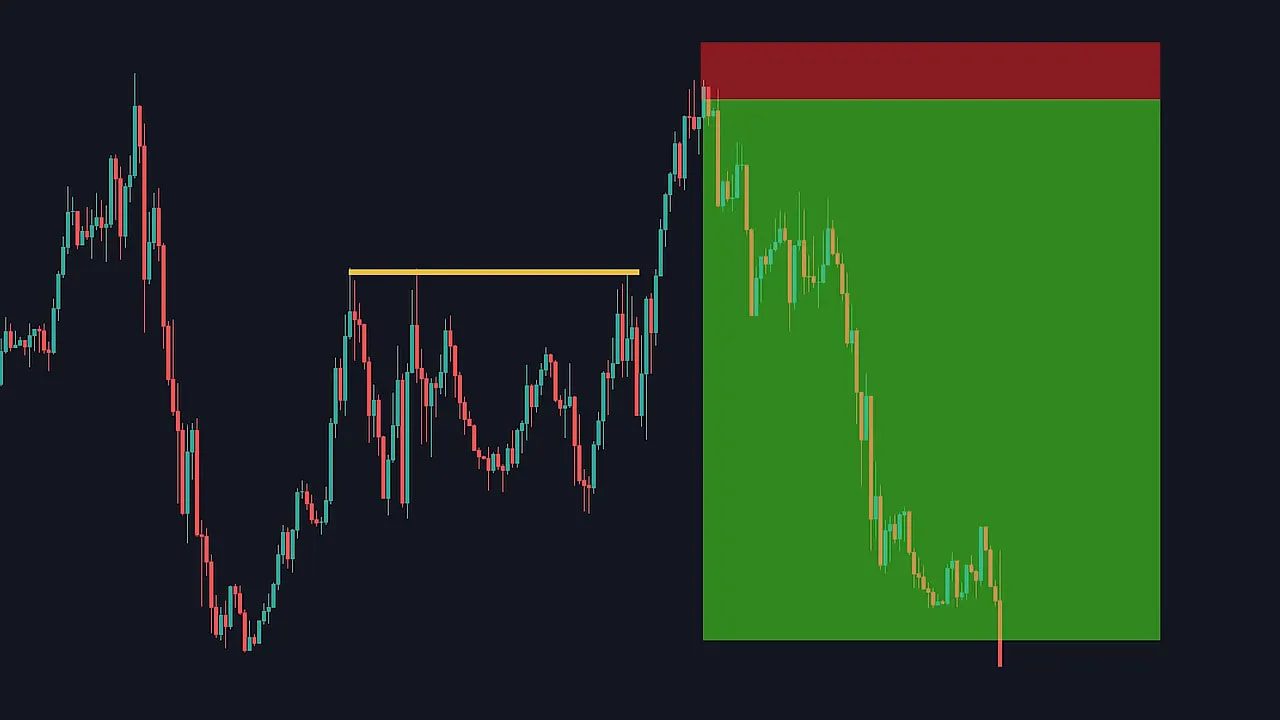
Again: small stop, big target.
Example 3 — Repeat the pattern
The pattern repeats regardless of market. Trend identification, a liquidity pool (equal highs/lows), a liquidity grab, and then an entry in the direction of the trend from a clean supply or demand zone.
Practicing these four steps on multiple timeframes and symbols builds familiarity and improves execution.
Supply and demand zones: a quick primer
A demand zone is the starting area of a strong bullish move. A supply zone is the starting area of a strong bearish move. Those zones are where institutions and larger participants often place larger orders, and they act as reliable entry areas after a liquidity grab.
Place your zone at the beginning of the impulsive move, not the wick. That gives you a conservative place for a stop and a clear area for entries.
Practical tips for execution
- Wait for confirmation: after the liquidity grab, wait for price structure that confirms the trend is resuming.
- Keep entries clean: prefer entries from supply/demand rather than mid-consolidation.
- Size to your stop: because stops are tight, use position sizing to keep risk per trade acceptable.
- Use higher timeframe context: a four-hour trend aligned with your daily bias increases probability.
Price will always target liquidity. Once you start thinking of markets that way, your edge becomes obvious.
FAQ
How do I choose the right timeframe?
The pattern works on many timeframes. Use a higher timeframe to define the trend and structure, and a lower timeframe to fine-tune entries from supply or demand zones. For example, use the daily for trend and the 1-hour or 15-minute for execution.
Where exactly should I place my stop loss?
Place the stop just beyond the supply or demand zone you are trading. That keeps stops tight while giving the trade room to breathe. Avoid placing stops in the middle of obvious price action; use the zone edges as references.
What if price never returns after the liquidity grab?
Not every liquidity grab leads to a clean setup. If price fails to return to a valid supply or demand zone, skip the trade. Patience keeps you in the game; only take setups that meet your criteria.
Can I use indicators with this method?
Indicators are optional. The core method is price action based. Some traders add volume, moving averages, or momentum tools as confirmation, but the edge comes from structure and liquidity, not from indicator signals alone.
How many trades should I take per week?
Quality over quantity. Let the market provide setups. Depending on timeframe, this method might produce a few high-quality trades per week or several per month. Focus on maintaining good risk management and positive expectancy.
Final thought
Market structure and liquidity give you a repeatable framework: follow the trend, hunt for liquidity, wait for the grab, then enter from a clean supply or demand zone with a tight stop and a large target.
Practice labeling swings on charts, draw your zones at the origin of impulsive legs, and size positions to the stop. Over time the setups become obvious and the risk to reward will do the heavy lifting.
