

Table of Contents
- Quick setup: make the chart look good (and usable)
- Find symbols and control time
- Multiple charts and side‑by‑side comparison
- Practice with the replay tool
- Alerts: never miss a move
- Watchlists and organizing ideas
- Where to get fundamental and seasonal context
- Essential drawing tools (what I use every day)
- Fibonacci retracement: a quick primer
- Entry/Exit tools: visualize risk‑reward
- Order flow, indicators and custom scripts
- Trade directly from TradingView
- Screeners and heat maps: how to find candidates fast
- Paid features and whether they’re worth it
- Checklist: what to set up today
- Final notes on workflow and discipline
- Frequently Asked Questions
Quick setup: make the chart look good (and usable)
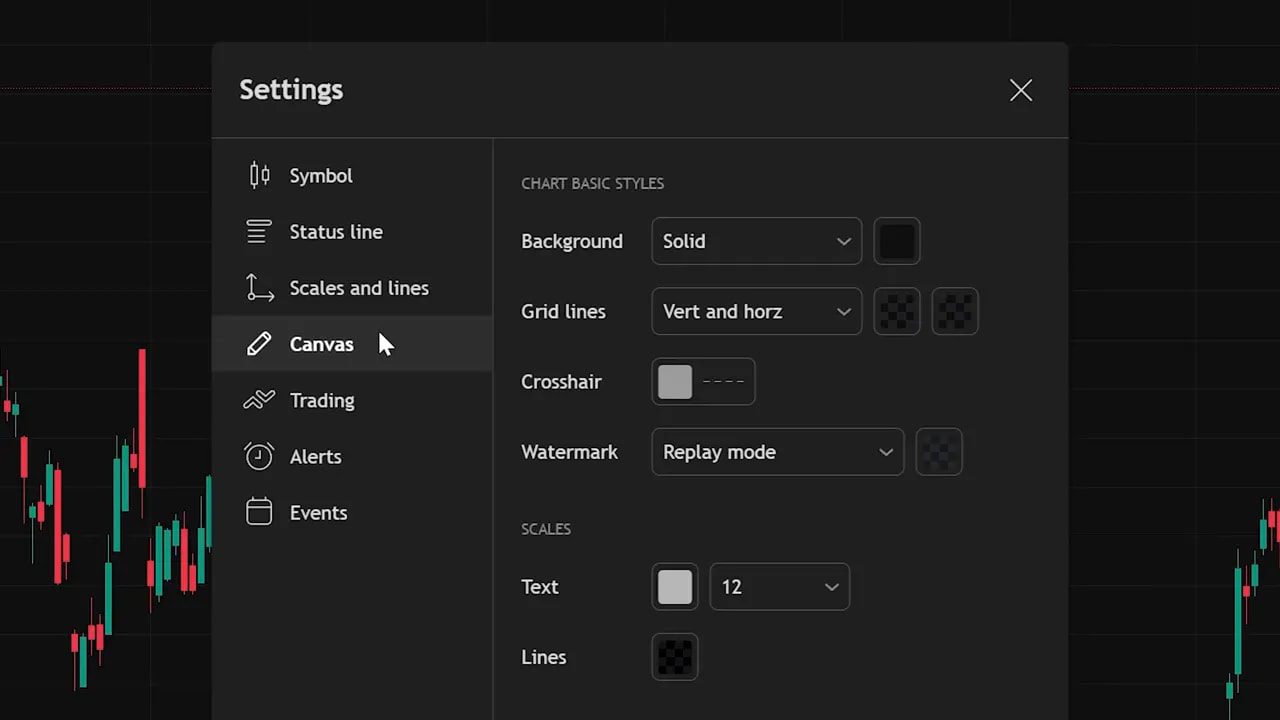
First thing: get onto TradingView and open the Super Chart under Products. The default layout is cluttered. Change to dark mode via your avatar, then right click the chart and open Settings.
In Settings › Canvas pick a background color you like (I use a specific hex—feel free to copy it). Turn grid line opacity to 0 so the background is clean. Save this as a template (Save as) so you never have to repeat this again. Clean charts reduce cognitive load; you’ll thank yourself later.
Find symbols and control time
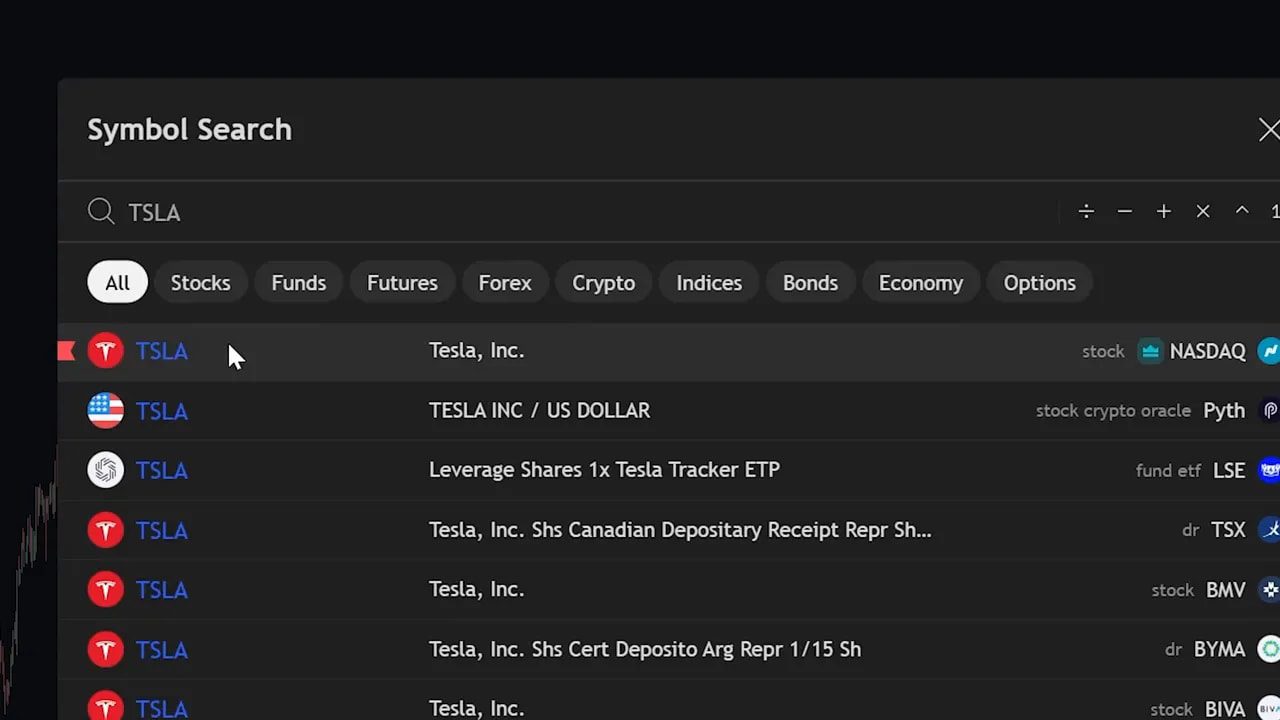
Search tickers from the top bar or just start typing on the chart to bring up the symbol window. Make sure you’re in the All category so you see stocks, crypto, indices and more.
The timeframe selector is next to the search. Click daily, hourly, 5 minute—each candle now represents that period. You literally control time. Use higher timeframes for trend context and lower timeframes for execution.
Multiple charts and side‑by‑side comparison
Professional desks use multiple panels for context. Click the layout icon to pick split-screen or grid layouts. This is great for comparing correlated assets—for example Nvidia vs Bitcoin—or plotting spot vs futures for the same instrument.
Pro tip: using multiple timeframes side by side keeps your macro view and micro execution aligned.
Practice with the replay tool
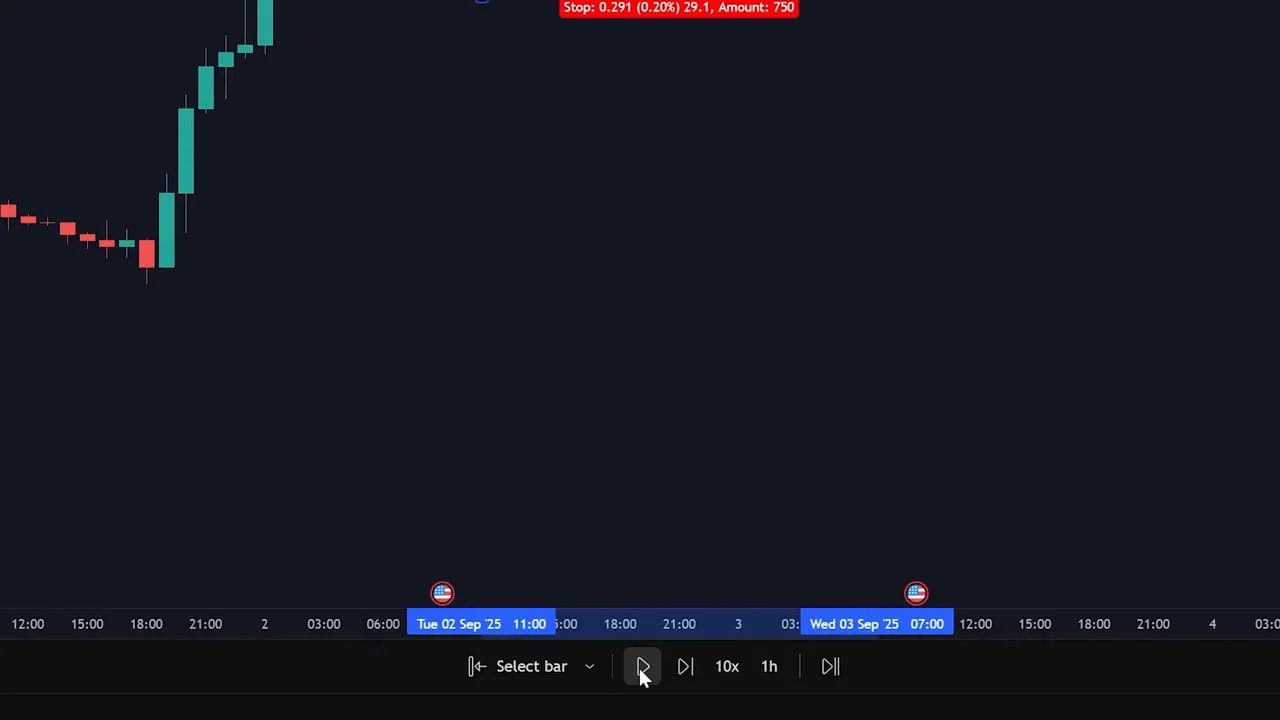
The Replay tool lets you scrub price history and “replay” candles from any point. It’s a simple, powerful way to validate setups and practice entries without risking capital.
Alerts: never miss a move
Set alerts on price, indicators, or custom conditions. Pick your symbol, choose Crossing (or another condition), enter the price, enable email notifications, and create it. Alerts can be far more nuanced than a single price; you can alert on percentage moves, indicator crossovers, or volume spikes.
Use alerts to automate monitoring so you can live your life (cheese factory shifts included) while the market watches itself.
Watchlists and organizing ideas
Create watchlists, color code tickers, and add sections for categories like Entries or Watch. Right click to add sections and build lists for crypto, stocks, penny names, whatever you trade.
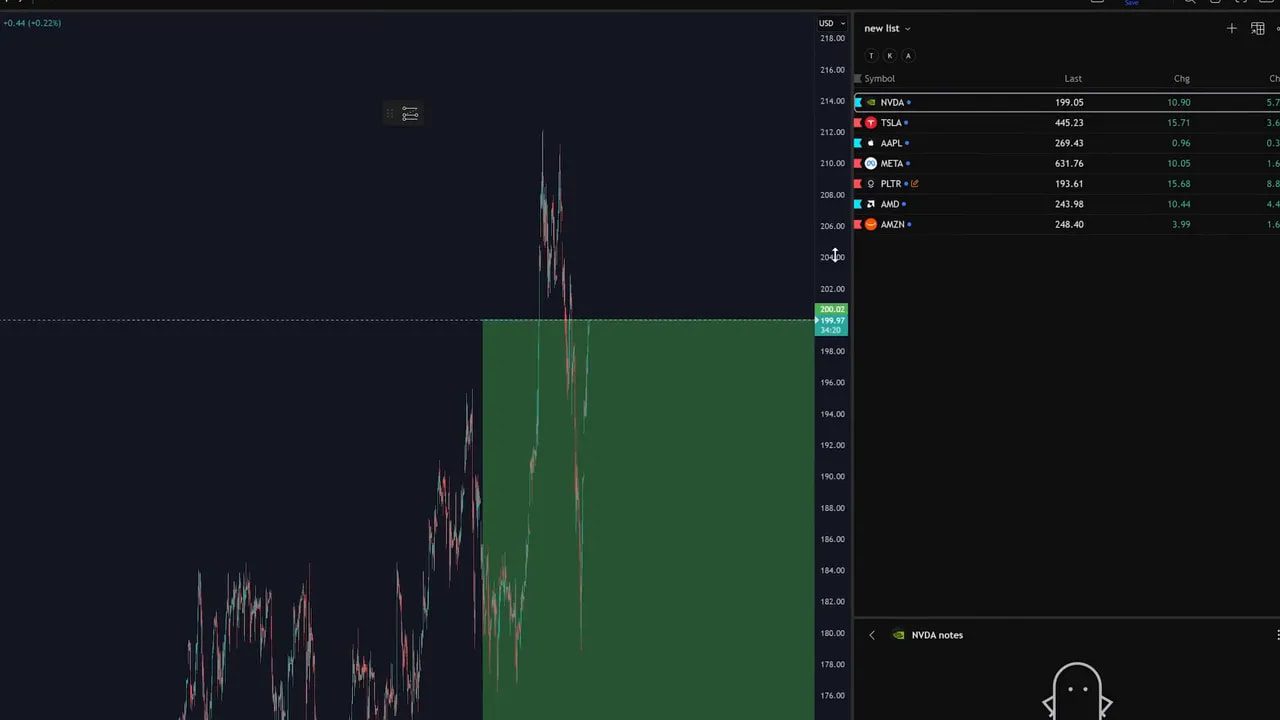
Tip: a focused daily watchlist beats a scattered universe of thousands of tickers. Color coding gives instant visual priority.
Where to get fundamental and seasonal context
Under the watchlist you’ll find a compact fundamental panel: next earnings date, volume, market cap, earnings and income statement graphs, analyst ratings, and one year price targets. Scroll further for seasonal patterns—handy for businesses with clear seasonal demand.
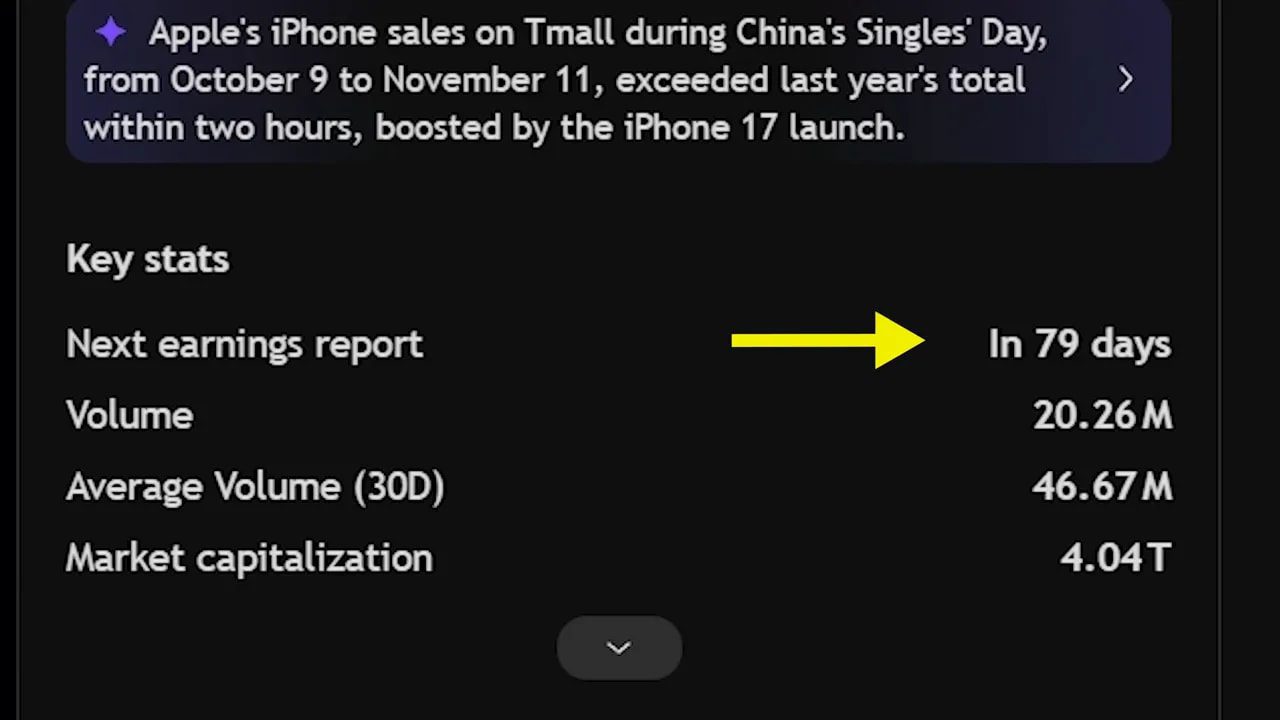
If reading raw numbers isn’t your thing, take a screenshot and paste it into a quick analysis tool (for example an AI assistant) to get a readable summary.
Essential drawing tools (what I use every day)
The drawing toolbar has dozens of tools. Focus on the handful that do the heavy lifting.
- Trend line — draw trend and channel lines, add text and change color in the settings.
- Horizontal ray — perfect horizontal support/resistance without the wobble.
- Rectangle — ideal for marking supply and demand zones.
- Measure — shows percent change and exact days between points (shift+click to speed it up).
If the screen gets messy, use Hide Drawings to clear the canvas and bring them back with one click.
Fibonacci retracement: a quick primer
Fibonacci retracement maps natural ratios over a move. Mark low to high (or high to low) and watch levels such as 61.8% as potential reaction zones. Many traders use the 0.618 level to find pullback entries, but like any tool it’s a probability, not a guarantee.
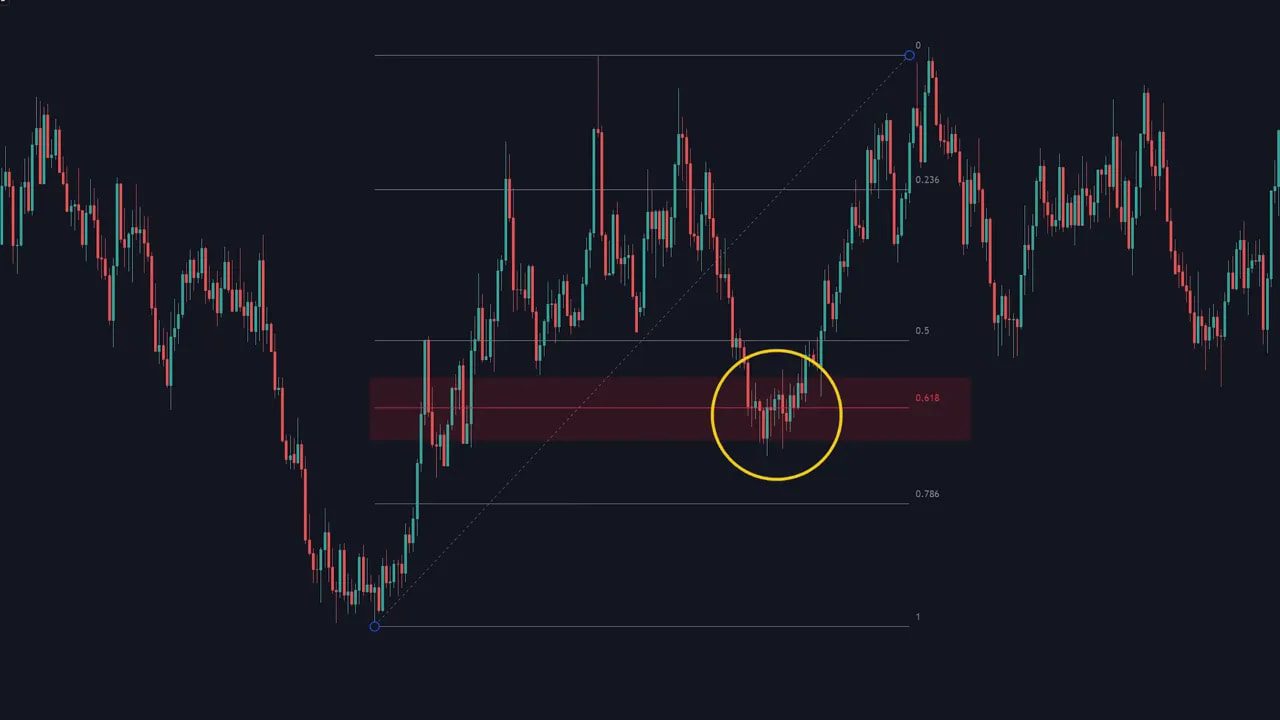
Combine Fib with structure, volume, or a confluence of indicators to increase edge.
Entry/Exit tools: visualize risk‑reward
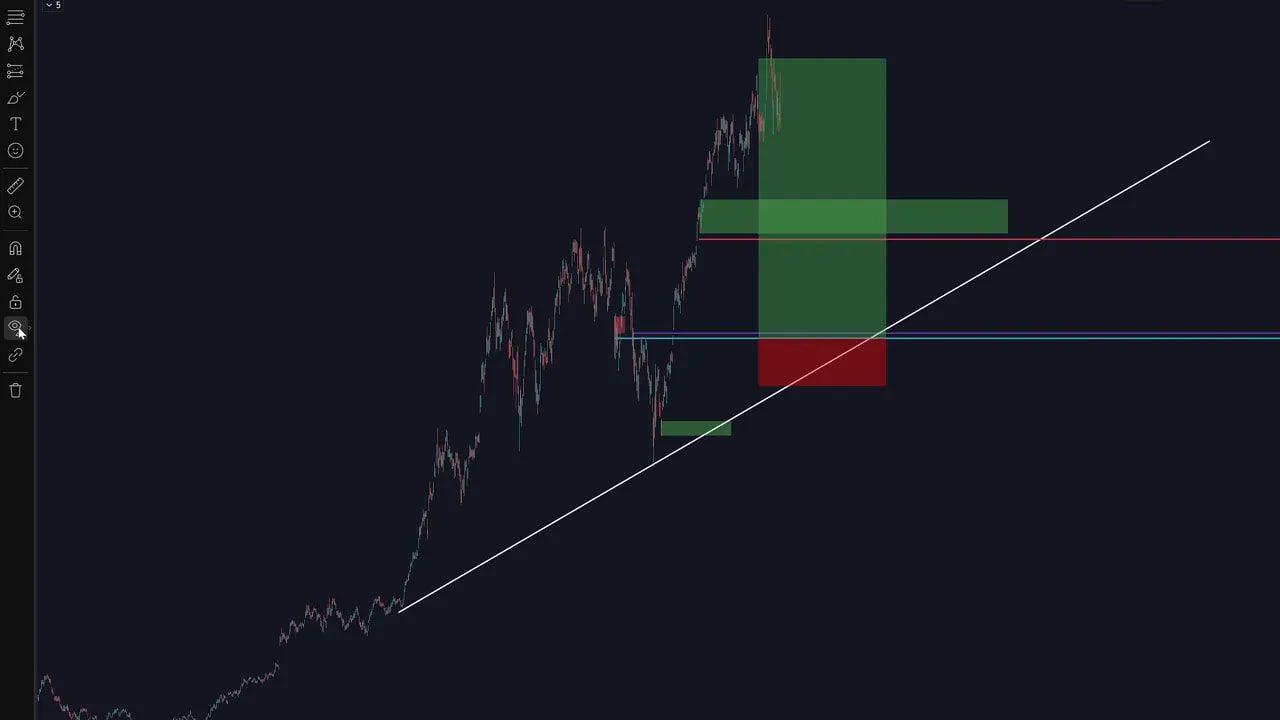
Use the Long and Short position tools to draw your entry, stop loss and take profit. These boxes instantly show position size, percentage risk, and risk to reward. Adjust levels visually—this helps you commit to a plan before you click execute.
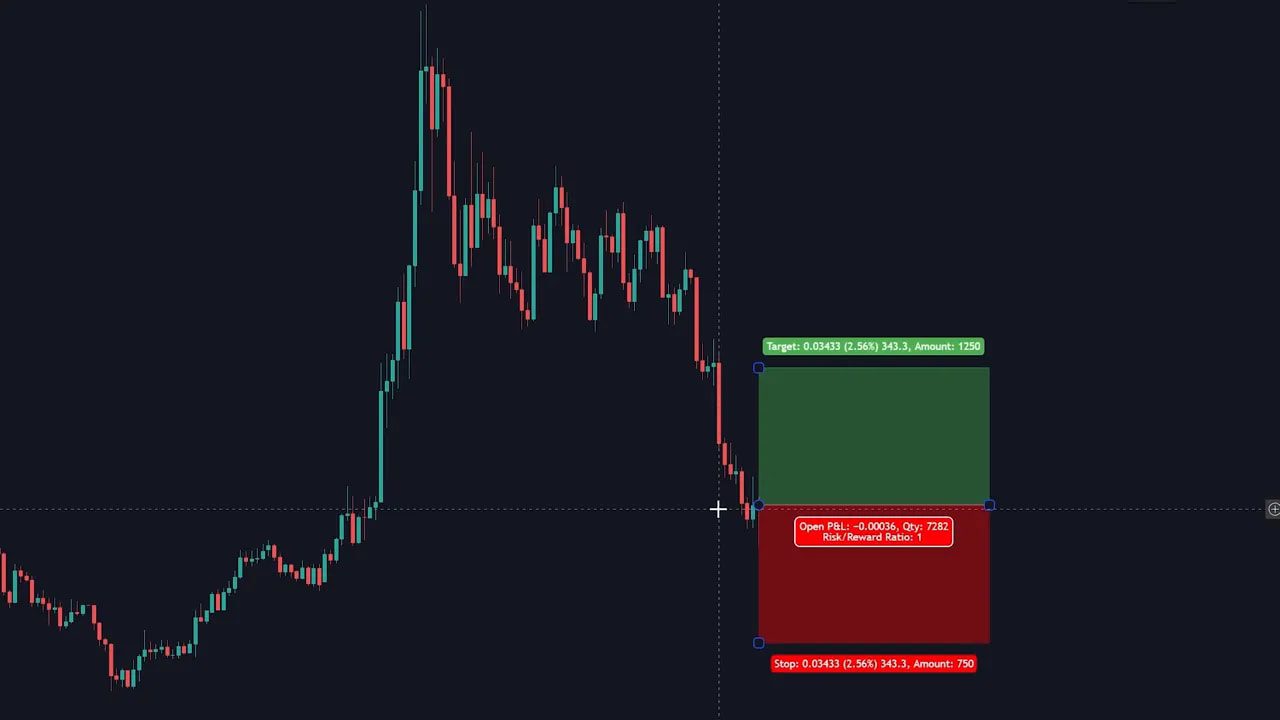
Always define stop loss and target before entering. Trading without them is guessing dressed up as hope.
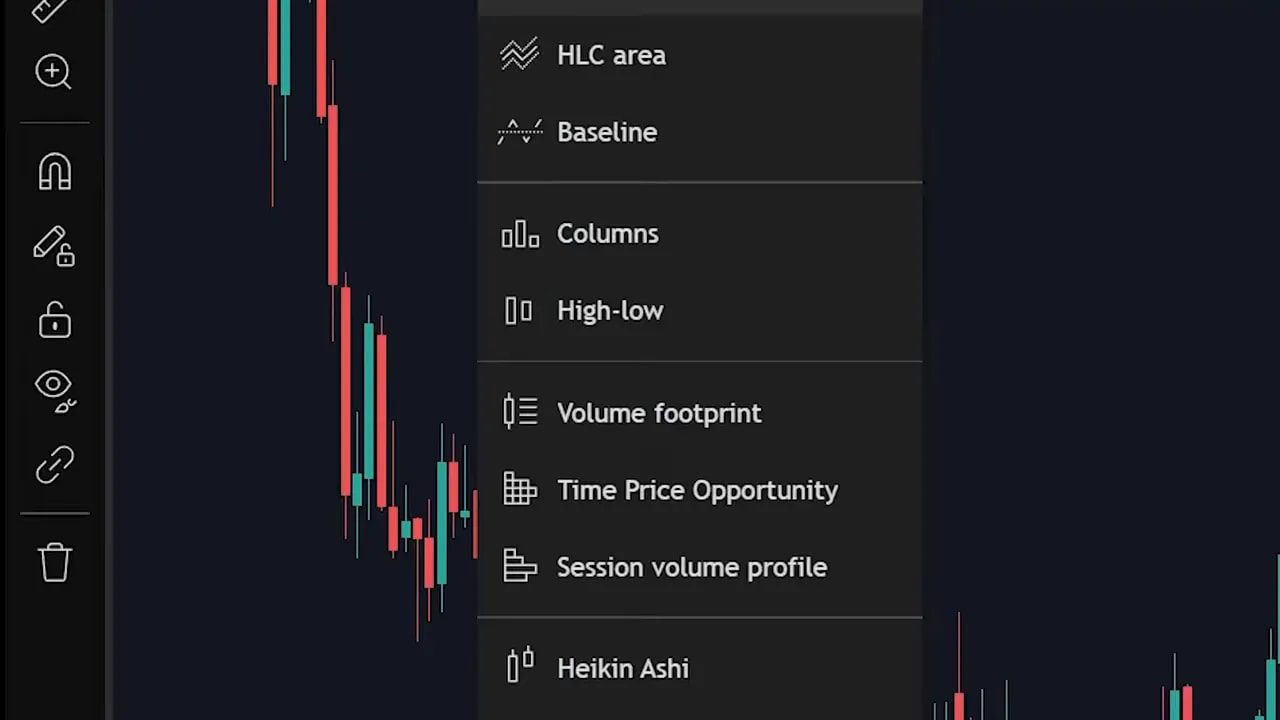
Order flow, indicators and custom scripts
Want to inspect buy and sell pressure per candle? Turn on Volume Footprint to see order flow inside each candle. Classic indicators—RSI, MACD, moving averages—are one search away in the Indicators menu. Click the indicator to add it and use the settings icon to tweak inputs and colors.
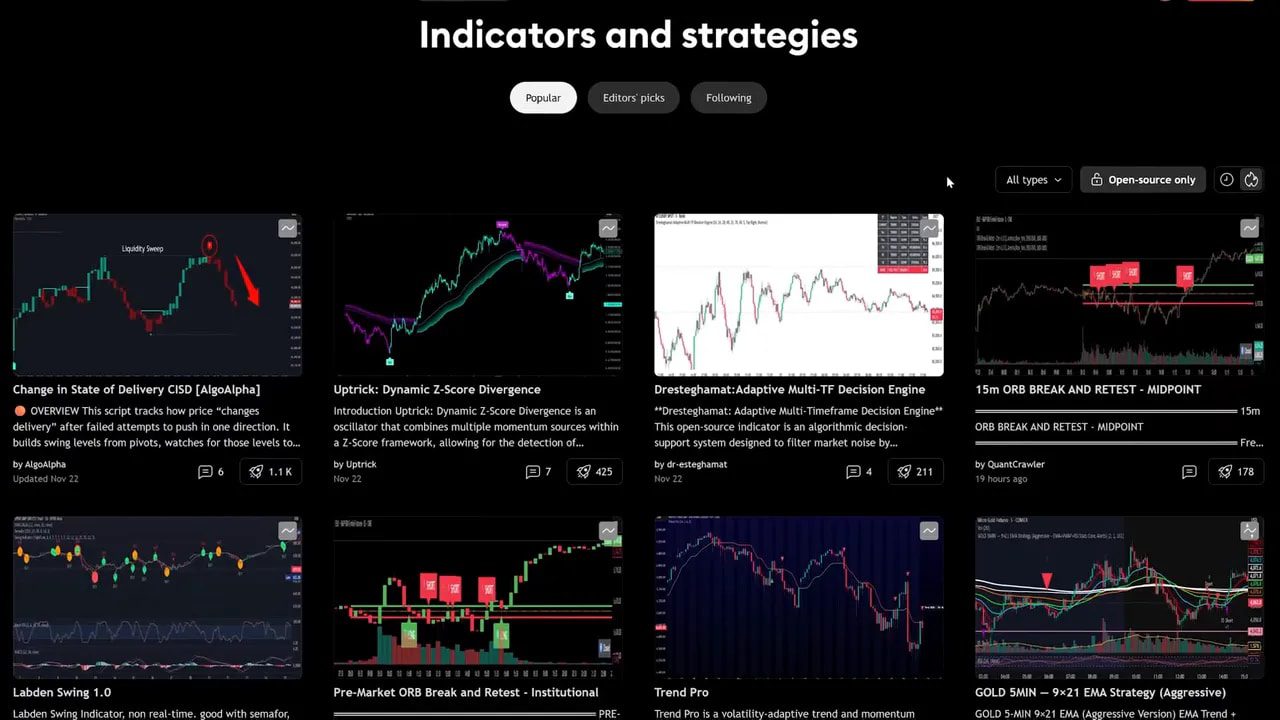
The Community Scripts library contains user‑created indicators and strategies. Read the description, test on historical data, and add only what you understand.
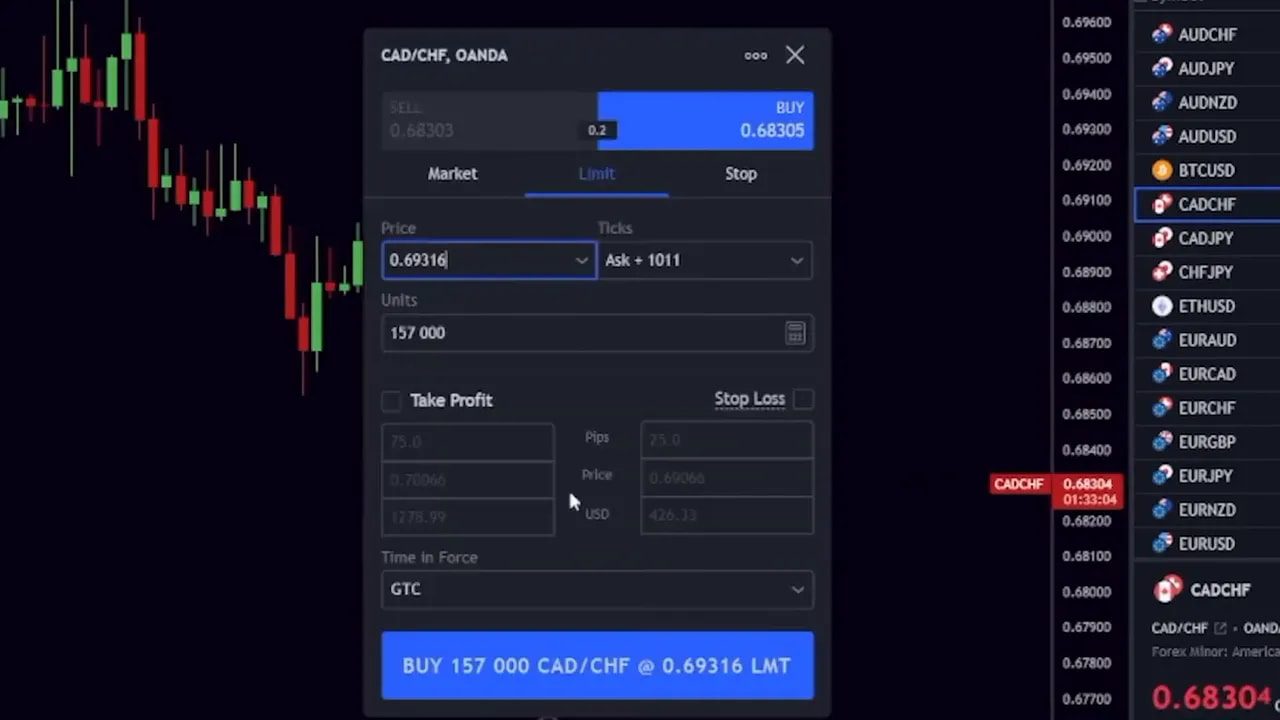
Trade directly from TradingView
Connect a supported broker from the Trading Panel at the bottom and execute trades directly from the chart. This keeps analysis and execution in the same place and reduces friction between idea and order.
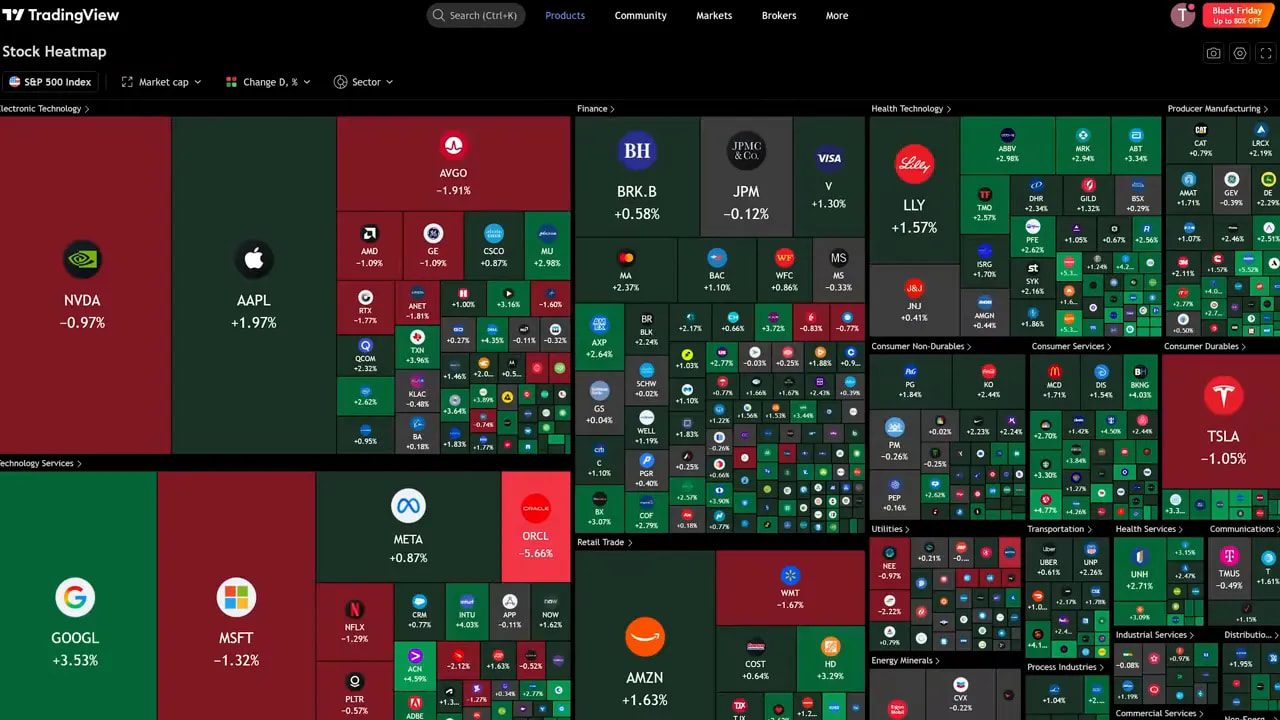
Screeners and heat maps: how to find candidates fast
Use Screeners for fast filtering. The Heat Map gives a sector view, and the Screener lets you set filters like market cap and revenue growth to narrow thousands of stocks in seconds.
For crypto, use the same approach: filter by market cap, volume and recent performance to find trending chains and tokens. For traders who prefer ready trade ideas across multiple blockchains, consider using crypto spot trading signals to receive curated setups and entry alerts that match your risk profile. Signals can speed up discovery when the market moves fast across dozens of tokens.
Paid features and whether they’re worth it
Many advanced tools—multi-pane layouts, custom screeners and extra indicators—require a paid plan. The cost is modest compared with professional platforms. If you use TradingView daily, the subscription often pays for itself in time saved and better decision making.
Pro tip: take advantage of trial offers to test features like multiple layouts and the screener before committing.
Checklist: what to set up today
- Clean your chart template and save it.
- Create a focused watchlist and color code it.
- Set at least one meaningful alert (price or indicator).
- Practice setups using Replay mode for 20–30 minutes.
- Set up one screener filter to scan for candidates each morning.
Final notes on workflow and discipline
Charts are tools, not prophecies. Use TradingView to gather evidence: structure, volume, order flow and fundamentals. Combine these into a repeatable routine—scan, analyze, plan, execute, review.
If you trade crypto, remember liquidity and slippage vary wildly across chains. Combining hands‑on chart work with curated crypto spot trading signals can help you catch high‑probability setups while managing chain‑specific risks.
Frequently Asked Questions
Do I need TradingView Pro to trade effectively?
No. You can learn and trade with the free plan, but Pro adds faster data, more indicators per chart, multiple layouts and advanced screener features. If you use TradingView daily and want to speed up workflow, Pro is often worth it.
Can I place live trades from TradingView?
Yes. Connect a supported broker via the Trading Panel and execute directly from charts. Not all brokers are supported, so check compatibility and test with small sizes first.
How do I avoid indicator overload?
Pick a small set of indicators that serve distinct purposes: trend, momentum, and volume or order flow. Use price action and structure as your primary signals and indicators for confirmation. Test combinations on historical data before trading live.
What’s the best way to learn Fibonacci and other tools?
Practice. Use Replay mode to apply Fib retracements on past moves and observe reaction points. Combine Fib with support and resistance and volume to see what works for your style.
Are crypto signals helpful for spotting opportunities?
Signals can speed discovery and provide watchlist‑ready setups across many tokens and chains. Use them as a supplement to your analysis, especially when scanning dozens of markets. Always validate a signal with your own chart checks and risk rules.
