

Table of Contents
- Why this report matters right now
- Report snapshot: who was asked and what they said
- What investors expect for Bitcoin dominance
- Survey follow-ups (December): conviction is still high
- Q4 market performance and the altcoin pain
- Bitcoin: deeper on-chain signals to watch
- Ethereum: sentiment, supply dynamics, and utility growth
- Macro, liquidity, and the digital gold question
- Scenario planning for Q1 2026
- What to watch in Q1
- Practical considerations (not investment advice)
- Are institutions really still accumulating Bitcoin?
- Will altcoins rally in Q1 2026?
- What are the biggest risks over the next 3–6 months?
- What on-chain metrics matter most right now?
- Is Bitcoin still “digital gold”?
- Will Ethereum upgrades change the game?
- Bottom line
Why this report matters right now
As January 2026 wraps up, the market feels like the calm before a storm or the moment of lift-off—depending on who you ask. A joint report from Coinbase‘s institutional arm and Glassnode pulls together survey sentiment, on-chain data, and market structure analysis to paint a picture of where crypto might head in Q1. The findings are neither blindly bullish nor doom-and-gloom bearish. Instead they give us a nuanced read: investors are cautious but not capitulating, altcoins are under pressure, and macro liquidity still plays a starring role.
Report snapshot: who was asked and what they said
The report surveyed 148 participants, almost evenly split between institutional (75) and retail (73) respondents. Eight focused questions plus four follow-ups in December reveal how both groups adjusted risk appetite and expectations across Q3 and Q4 of 2025.
Key survey takeaways:
- Risk appetite shifted higher among retail—50% of retail respondents reported taking on higher risk in Q4 compared with 56% reporting normal risk in Q3.
- Institutions became split—in Q4 institutional respondents were roughly even between normal and higher risk exposures (42% vs 41%).
- Market cycle views diverged—by Q4, many institutions moved away from a clear bull-market narrative. 26% even said we were already in a bear market. Retail sentiment shifted from bullish to more cautious with those labeling it a bull market falling from 29% to 16%.
- Top tail risks remained consistent: the macro backdrop, declining liquidity, and underwhelming regulation.
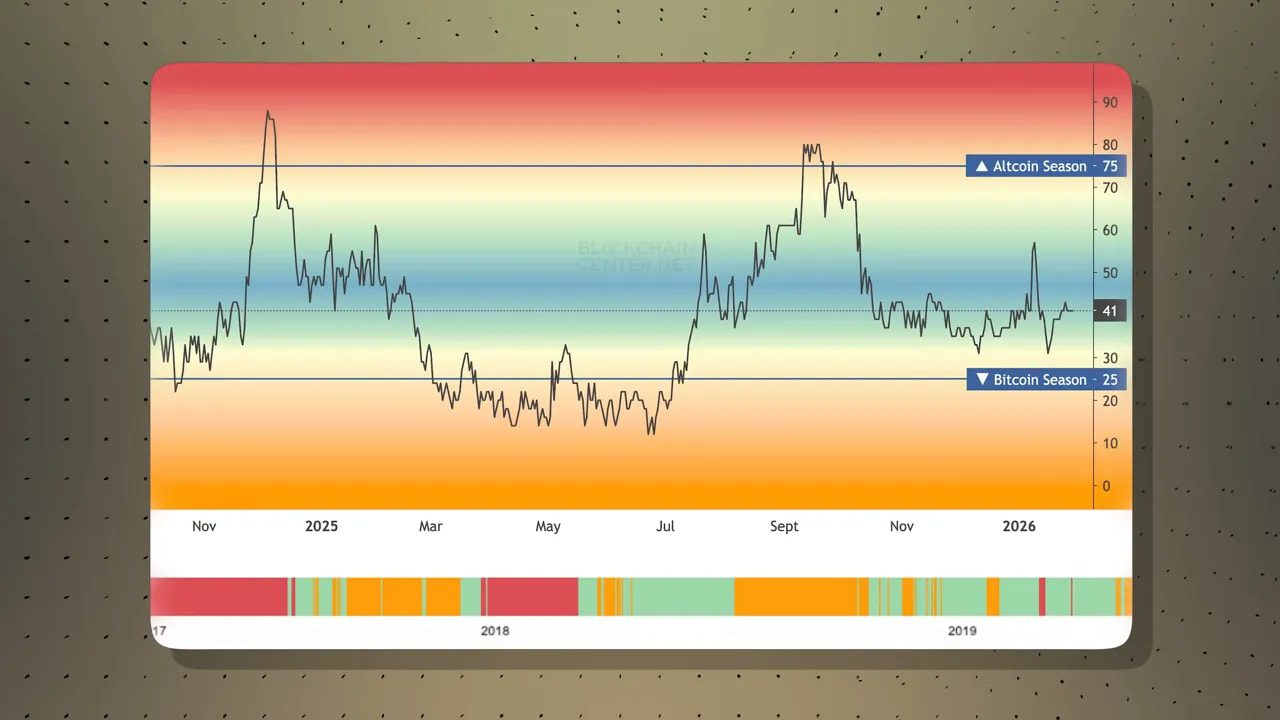
What investors expect for Bitcoin dominance
Bitcoin dominance expectations offer a window into whether people expect an altcoin season. In Q3 some respondents expected dominance to fall below 55% (a sign of altcoin rally potential). By Q4 that probability dropped dramatically.
- Institutional view: the share expecting BTC dominance to drop below 55% fell from 33% to 16% in Q4; 40% now expect dominance above 60%.
- Retail view: 41% expect dominance above 60%, 34% expect 55–60%, and 24% expect a dip below 55%.
The takeaway: sentiment shifted away from a confident altseason and toward a Bitcoin-dominant near-term market.
Survey follow-ups (December): conviction is still high
Four December questions shed light on valuation beliefs and behavior after the October 10 liquidation event:
- 71% of institutions and 60% of retail said Bitcoin is undervalued. That is a striking majority among institutions and implies a higher chance of accumulation rather than mass selling.
- Small-cap outperformance is not a consensus. Retail split evenly; only 32% of institutions believe small-caps will outperform in the next 12 months, while 45% think it is unlikely.
- Reaction to the October crash: 60% of institutions and 70% of retail either held or bought the dip. In a hypothetical 10%+ drop in the short term, 80% of institutions and 85% of retail said they’d hold or buy more.
That level of conviction—especially among institutions—changes the dynamics of a downturn. It reduces the chance of a vicious waterfall where every sell begets more sell orders.
Q4 market performance and the altcoin pain
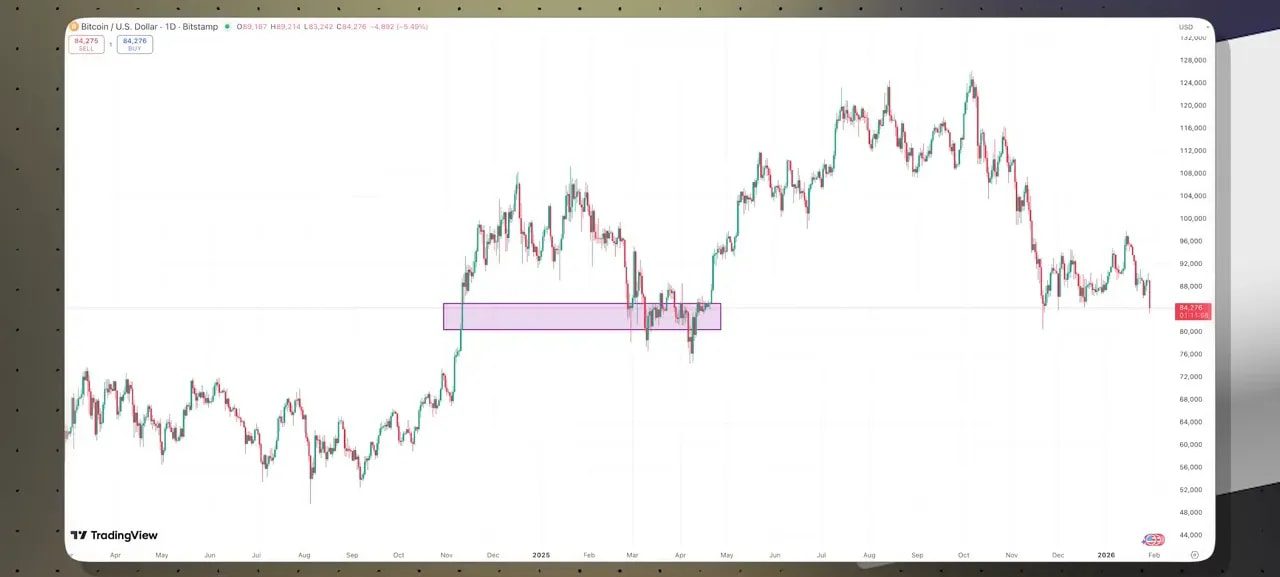
Q4 2025 was ugly for most altcoins. Bitcoin hit an all-time high above $125,000 before the October liquidation, but dominance barely budged even after the drawdown. Mid-cap and small-cap tokens were far more vulnerable.
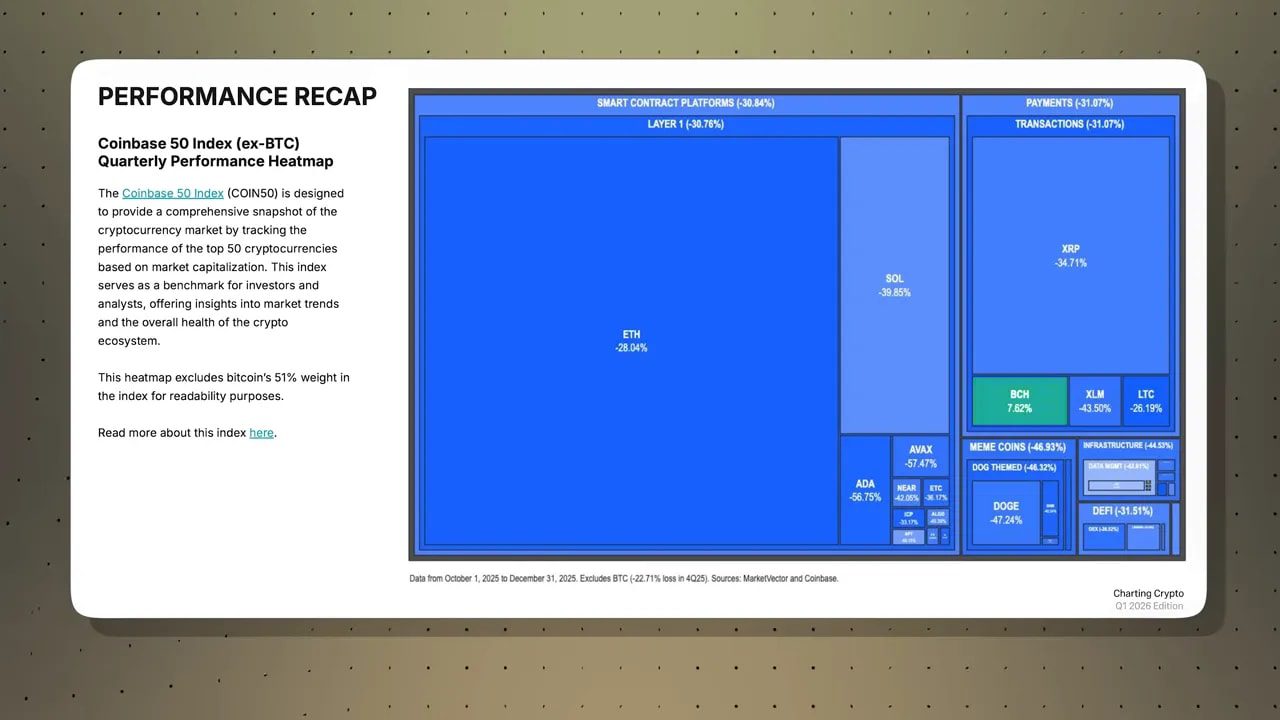
The Coinbase 50 index, which tracks the top 50 tokens by market cap, was broadly down in Q4:
- ETH -28%
- XRP -34%
- SOL -40%
- ADA -56%
- BCH +7% (the lone outlier)
These moves drove the altseason index sharply lower—the market had hoped an altcoin ETF wave would spark rotation, but reality delivered much less lift.
Bitcoin: deeper on-chain signals to watch
The report leans heavily on on-chain metrics to interpret investor behavior. Here are the ones that matter most and what they imply.
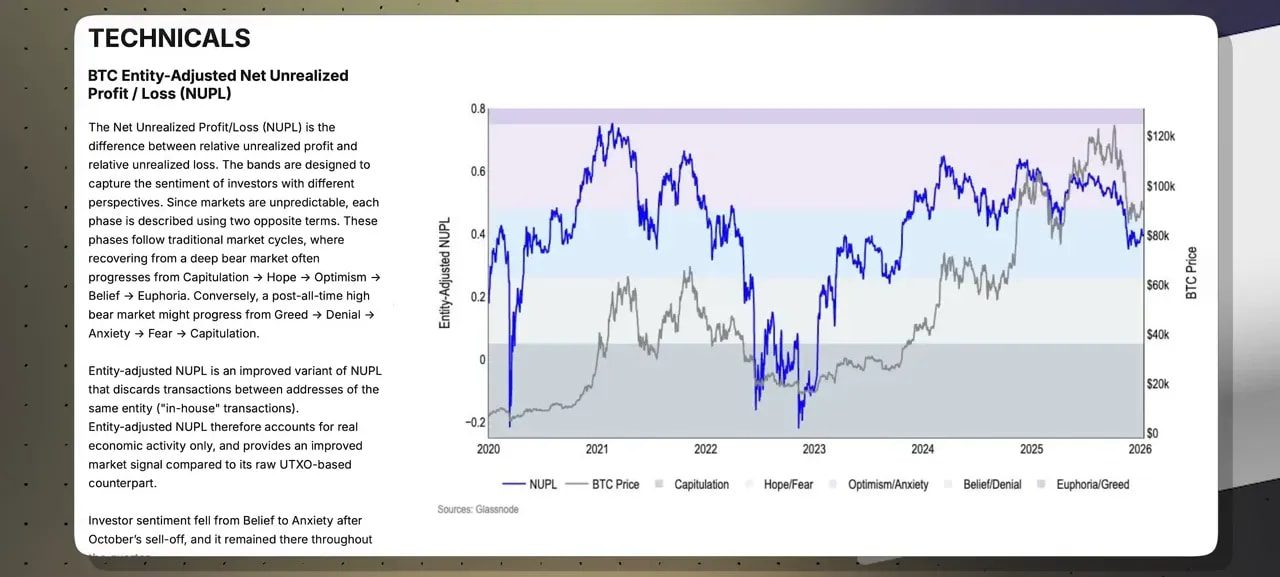
NUPL (Entity-adjusted net unrealized profit and loss)
NUPL measures how much unrealized profit or loss holders are sitting on after adjusting for entities that control multiple wallets. After October, NUPL moved from belief to anxiety and remained subdued through year-end. In plain terms: many holders were no longer comfortable, and sentiment didn’t recover quickly.
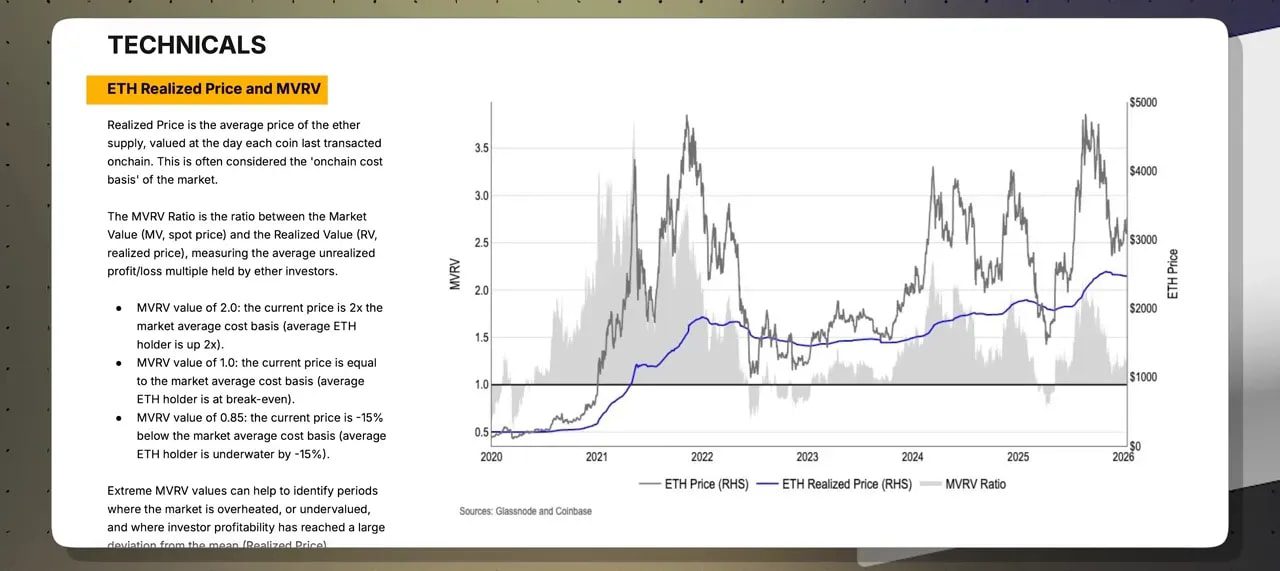
MVRV: how profitable holders are
MVRV compares market value to realized value to estimate average holder profit. Bitcoin’s MVRV sat around 2.2, implying most holders are roughly 2x up from where they acquired BTC. When many holders are significantly in profit, selling pressure tends to rise as people lock gains.

Supply profitability bands and accumulation zones
Supply profitability tracks the percent of supply in profit and plots it against statistical bands (plus one and minus one). After the October sell-off, Bitcoin’s supply profitability plunged to the minus one band—often considered an accumulation opportunity. According to the report, many investors accumulated in the $80k–$85k range during that period.
Active vs dormant supply
Active supply (moved in the last 3 months) jumped 37% in Q4 while dormant supply (no movement in 12+ months) fell only 2%. That signals short-term trading activity spiked during the crash but long-term holders remained relatively glued to their positions. Still, the drop in dormant supply suggests the market is slowly becoming more turnover-driven.
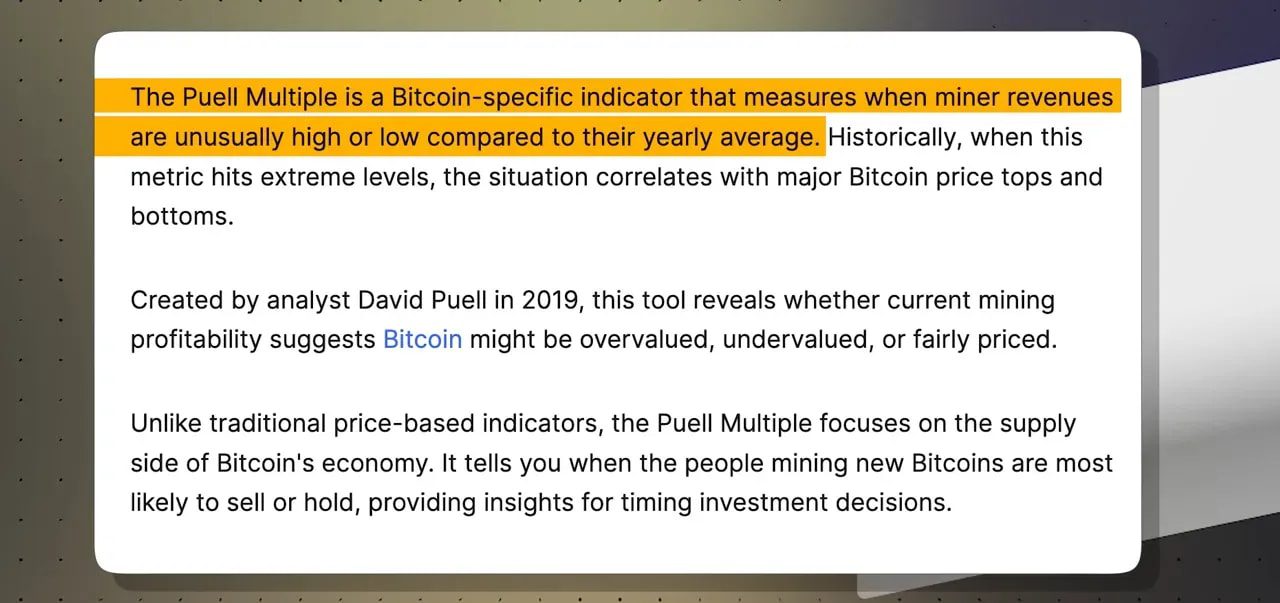
Puell Multiple and miner pressure
The Puell Multiple measures daily miner revenue against a 365-day moving average. It fell to about 0.9 in Q4, indicating miners earned 10% less than historical norms. Interpretation is mixed: lower miner revenue can mean less incentive to sell, but it can also force miners to liquidate more BTC to cover costs when revenue is tight.
Long-term holder flows
Examining BTC held for 155+ days against exchange flows suggests July–September 2025 may have been a period where some long-term holders realized profits or reallocated. That aligns with the MVRV signal: many holders are up significantly and might be taking chips off the table.
Ethereum: sentiment, supply dynamics, and utility growth
Ethereum’s narrative in 2025 was more about utility than pure price speculation. On-chain activity, layer 2 adoption, and tokenized asset growth were central themes.
Newble sentiment swings
Ethereum’s newble metric—another sentiment proxy—oscillated dramatically. It showed capitulation in Q1 2025, optimism at ETH’s highs in Q3, and fear again in Q4. That roller coaster reflects cyclical sentiment but also points to a maturing market where price volatility and real-world adoption move independently at times.
ETH MVRV and supply profitability
ETH’s MVRV was also around 2.2, meaning many holders were significantly in profit. Supply profitability swung from roughly 40% in profit earlier in the year to near-universal profitability at all-time highs and then back toward losses by year-end. This volatility likely encouraged some long-term holders to cash out during the late-cycle peak.
Active and dormant supply dynamics
Ethereum’s dormant supply dropped 9% in Q4—far larger than Bitcoin’s 2%—which suggests more long-term ETH holders chose to move coins, likely reallocating or taking profits after the surge. This is a meaningful signal: ETH holders showed greater willingness to rotate in response to market weakness.
Layer 2 adoption, transactions, and fees
One of the most encouraging trends: transactions across Ethereum and its layer 2s have steadily increased since January 2023, with each major upgrade driving activity spikes (Denkun, Pekstra, Fusaka). Importantly, user fees have fallen even as transactions rose—thanks largely to Denkun and layer 2 scaling improvements. Lower fees with rising throughput is exactly what institutional adopters want.

Macro, liquidity, and the digital gold question
Bitcoin’s price still correlates with equities to an extent, but its correlation with gold is minimal. In 2025 gold outperformed nearly everything, which undercut the “digital gold” narrative for BTC.
On liquidity, BTC’s correlation with M2 money supply across major economies remains positive. Economists expect M2 to be modestly growing into early 2026 rather than tightening sharply. That is potentially supportive for risk assets. But if M2 does tighten unexpectedly, downside risk for BTC increases materially.
Scenario planning for Q1 2026
No forecast is guaranteed, but the report allows us to sketch plausible scenarios based on current data and sentiment.
Bullish scenario
- Institutional accumulation continues as many firms view BTC as undervalued
- M2 remains benign and liquidity supports risk assets
- Ethereum upgrades improve scalability, driving renewed interest and tokenized asset flows
- Gold’s momentum fades and some flows rotate into crypto
Result: BTC finds support on dips, ETH benefits from institutional adoption, and altcoins rally later in the cycle.
Base case
- Markets remain choppy. BTC trades sideways with periodic volatility.
- Institutions buy selectively; retail remains cautious.
- Altcoins underperform until a clear macro or liquidity improvement triggers rotation.
Bearish scenario
- Macro surprise tightens liquidity or a major geopolitical shock hits risk assets.
- Regulatory setbacks pause institutional flows.
- Long-term holders take profits, amplifying selling pressure while miners and some institutions rotate out.
Result: deeper drawdown and delayed recovery for altcoins, with BTC still seen as the relative safe haven within crypto.
What to watch in Q1
- Macro data and M2 / liquidity trends—these will heavily influence risk appetite.
- Institutional flows and reported accumulation—surveys suggest appetite to buy the dip; watch actual flow data.
- BTC and ETH MVRV / NUPL—these help indicate when profit-taking is likely to slow.
- Layer 2 and Ethereum upgrade progress—real adoption, lower fees, and tokenized assets are the drivers institutions look for.
- Regulatory clarity—positive regulation that supports innovation will be a catalyst; poor outcomes will be a headwind.
Practical considerations (not investment advice)
If you’re thinking about positioning for the year ahead, keep these practical points in mind:
- Trim, don’t panic if you’re sitting on sizable unrealized gains—MVRV suggests many are at this point.
- Consider scaling into positions over time rather than a single lump-sum entry; the market remains volatile.
- Watch liquidity and macro headlines closely—unexpected shifts can dramatically alter risk-on flows.
- Keep an eye on Ethereum’s institutional use cases—if tokenized real-world assets and stablecoins continue growing on ETH, that is a structural tailwind.
- Diversify exposure by time horizon—short-term traders and long-term holders face different risks; align position sizing accordingly.
Are institutions really still accumulating Bitcoin?
Survey responses indicate strong conviction: 71% of institutions called BTC undervalued and many said they would hold or buy the dip. While survey intent does not guarantee flows, it suggests accumulation is more likely than wholesale selling in short-term drops.
Will altcoins rally in Q1 2026?
Most respondents shifted away from expecting an immediate altseason. Altcoin performance looks tied to liquidity, Ethereum’s institutional adoption trajectory, and whether BTC dominance falls. A broad altcoin rally seems less likely in the early part of the year unless a clear macro or funding catalyst emerges.
What are the biggest risks over the next 3–6 months?
The top three tail risks identified were the macro backdrop, declining liquidity, and poor or restrictive regulation. Geopolitical shocks, industry-specific failures, or large hacks were also cited as plausible downside risks.
What on-chain metrics matter most right now?
NUPL, MVRV, supply profitability bands, active vs dormant supply, and miner revenue (Puell Multiple) provide useful signals about holder behavior and sell-side pressure. Tracking these helps gauge whether dips are likely to be absorbed or amplified.
Is Bitcoin still “digital gold”?
Gold outperformed BTC in 2025 and their correlation is weak. The digital gold narrative remains debated—Bitcoin can act as a risk-on or risk-off asset depending on liquidity and macro conditions. Expect the narrative to evolve with institutional adoption and macro cycles.
Will Ethereum upgrades change the game?
Improvements that lower fees and raise throughput on layer 2s, plus upgrades that support institutional uses (tokenized assets, stablecoins), increase Ethereum’s appeal. If upcoming upgrades deliver tangible scalability gains, ETH could attract renewed institutional capital even if short-term sell pressure remains.
Bottom line
The Coinbase and Glassnode analysis offers a pragmatic view: investors are cautious but committed. Institutions show meaningful conviction in Bitcoin’s value proposition, and Ethereum is gaining structural support through higher throughput and lower fees. The near-term market will remain sensitive to macro liquidity, regulatory developments, and investment flows. If liquidity stays supportive and upgrades deliver on scalability, 2026 still has the potential to be the year crypto wanted 2025 to be.
Data and on-chain signals do not guarantee outcomes, but they do give a clearer map for what to monitor. Keep track of MVRV, NUPL, active supply trends, and macro liquidity. Those will tell you far more than hype.
