

Table of Contents
- Why October 10 still feels like a wound
- What actually happened on 10/10 — quick recap
- The big question
- Three leading theories
- Which theory fits the evidence best?
- How long until the forced selling is over?
- How traders can respond
- What this means for longer-term investors
- Checklist: signals, data points, and red flags
- Final read: what I think really happened
- Where to look next
- Closing thought
- FAQ
Why October 10 still feels like a wound
On October 10 something snapped. The markets didn’t just take a haircut — they experienced a liquidation cascade that left order books thin and price action unusually sensitive to any trade. Bitcoin fell roughly 15% within hours, the S&P sold off, and more than $19 billion of leveraged positions were erased in about a day.
That kind of immediate damage explains the initial crash, but it does not explain what followed. Instead of a rapid cleanup and stabilization, selling pressure lingered for months. Spreads stayed wide, alts continued to wick violently, and activity often felt like a hidden forced seller was still dumping into thin liquidity.
What actually happened on 10/10 — quick recap
The day began with a macro shock: an escalation in trade tensions that pushed markets risk off. Stocks dropped nearly 3% intraday while Bitcoin sliced through key technical levels. Once price momentum reached critical levels, a cascade of liquidations kicked in.
When billions of dollars in leverage are removed so quickly:
- Order books thin out and liquidity vanishes.
- Forced sells fall into increasingly thinner bids, which creates more forced sells.
- Auto deleveraging (ADL) mechanisms on some exchanges executed, sometimes closing otherwise profitable positions to cover losses on the other side of the book.
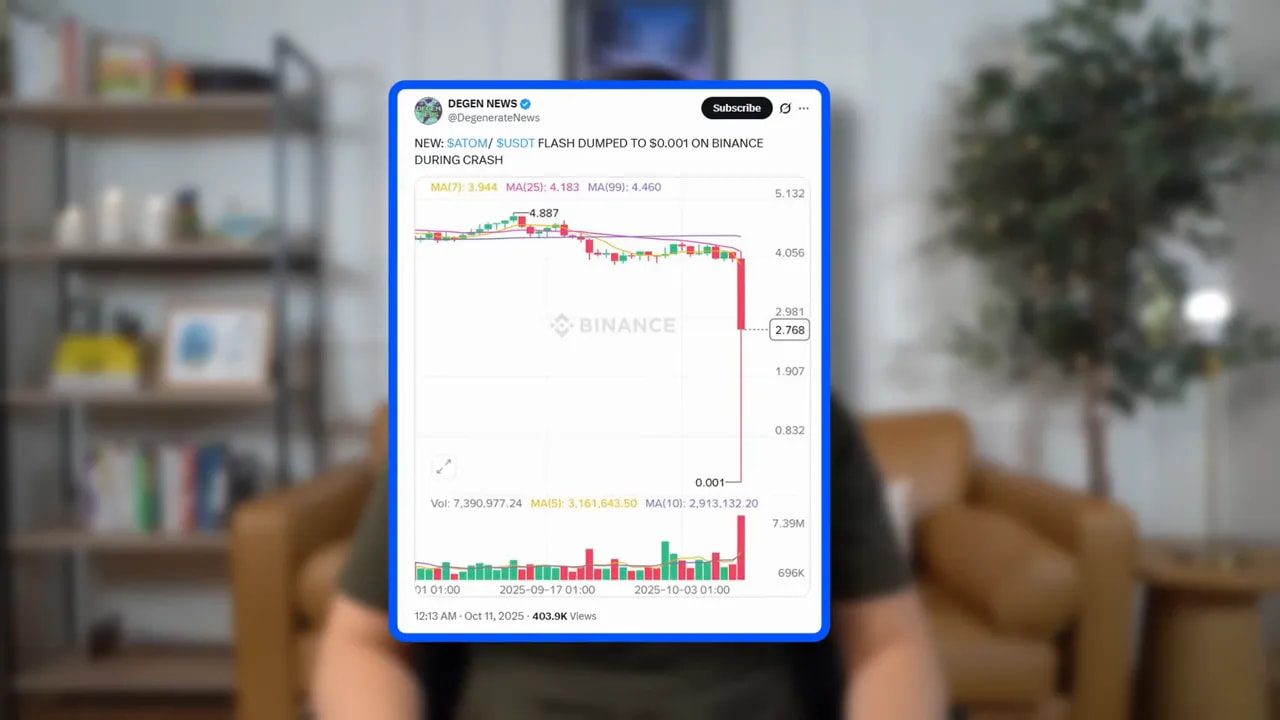
That ADL point is crucial. ADL doesn’t only punish reckless 50x levered traders; it can force-close hedges and create balance-sheet damage for market makers and funds that thought they were properly hedged. Add in wild altcoin behavior — 30% to 60% drops, temporary stablecoin depegs, and intra-exchange token wicks to near zero — and you have a systemic stress event that touched both centralized platforms and on-chain products.
The big question
Everything above explains the crash itself. It does not explain why relentless selling persisted for months after leveraged positions were supposedly flushed. Typically, once leverage is cleared, liquidity returns and prices stabilize. This time the market continued to behave as if a forced seller still existed. So what are the plausible explanations?
Three leading theories
Theory 1 — Major market makers were structurally damaged
Market makers provide vital liquidity, especially in volatile markets. Many operate delta neutral strategies: they offset directional exposure with shorts and hedges. When ADL forced the closure of profitable shorts, those hedges vanished and left market makers with unhedged long positions as prices fell.
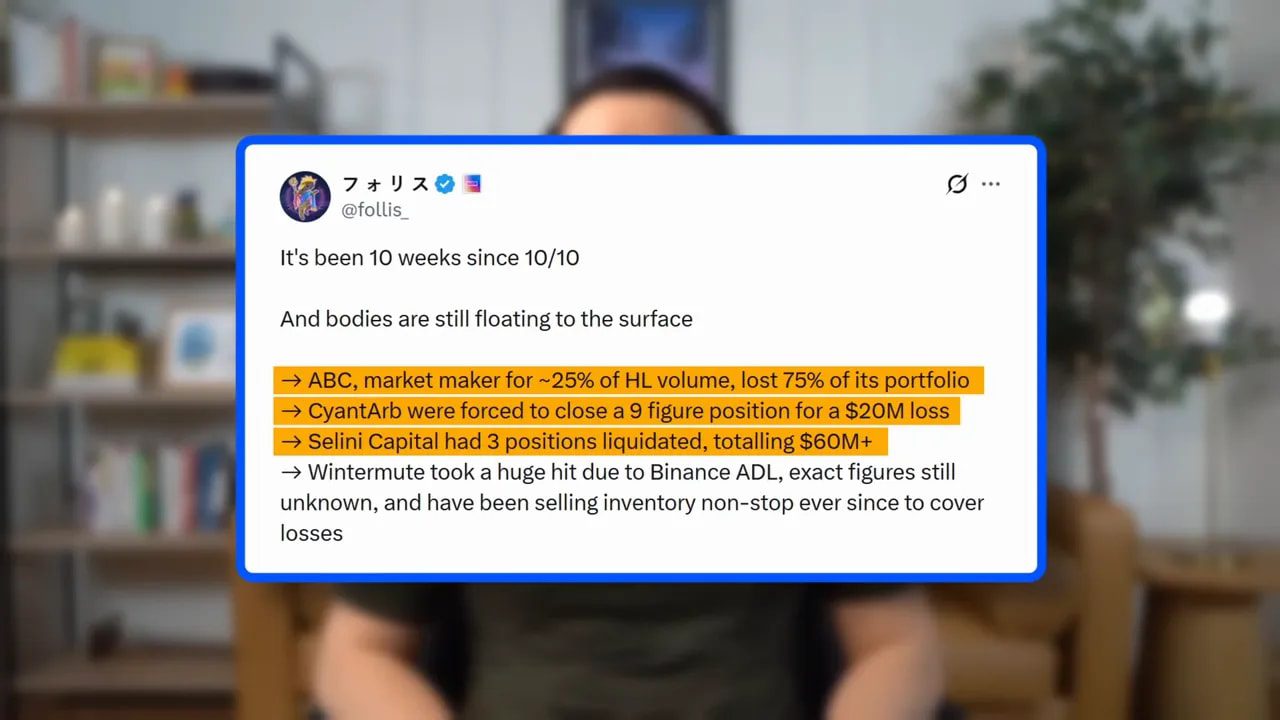
Several firms reported real losses that day. Publicly reported names include ABC, ScientArb, and Selene Capital, each admitting to tens of millions lost. Rumors circulated that 30% to 50% of market making liquidity was impaired.
When market makers get hurt, they understand they are not obligated to supply liquidity. Without regulatory compulsion, they can and will pull back to protect capital. That makes markets more fragile, causing thin books and outsized price moves on lower volumes.
Implication: If market making capacity was permanently impaired, the “new normal” is an order book that reacts more violently to flow, meaning that even small sell programs can push price sharply lower.
Theory 2 — An exchange-level hole, with Binance as the suspect
Binance was ground zero for many of the issues that day. Faulty price oracles and exchange-specific anomalies triggered massive local liquidations that then propagated elsewhere. Binance later compensated users from its insurance fund for roughly $300 million, which implicitly acknowledged operational problems.
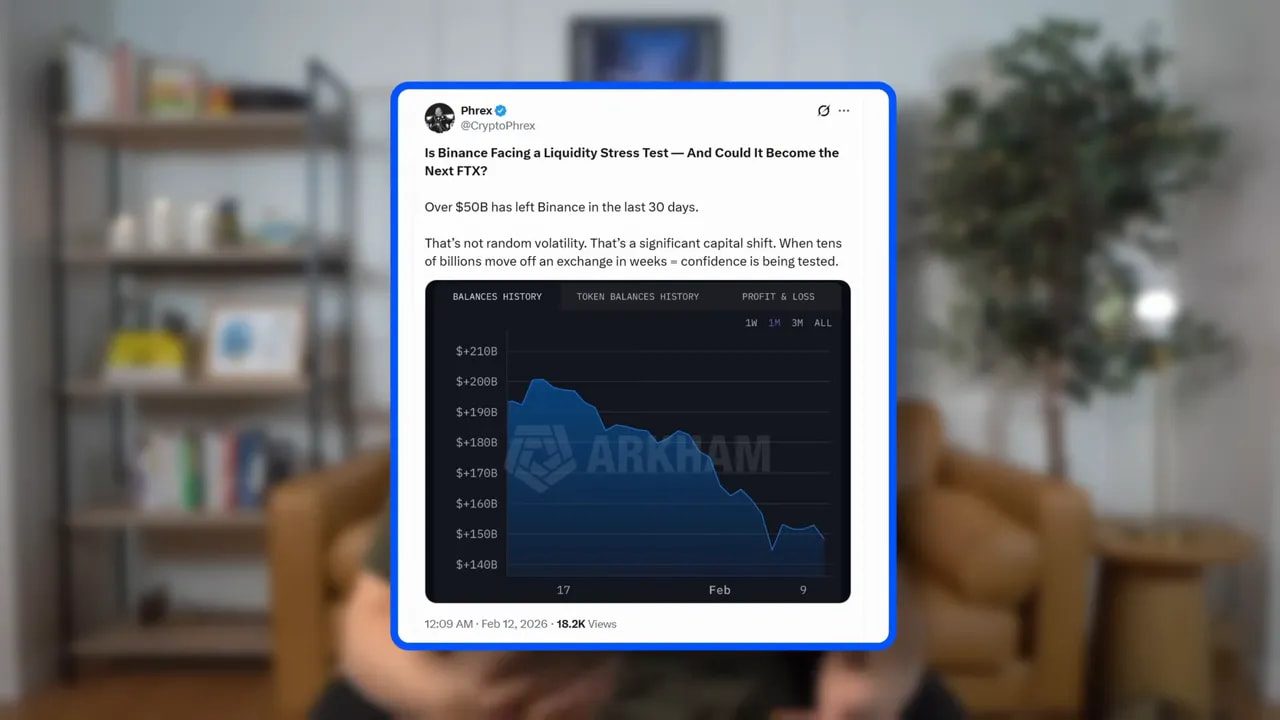
On-chain data showed substantial outflows from Binance in the weeks after the event, and certain patterns suggested persistent selling during Asia hours. That sparked a line of suspicion: did Binance suffer a large shortfall and intentionally push price down to trigger liquidations and plug the hole?
Reasons this theory gained traction:
- Exchange-level oracle faults directly contributed to the cascade.
- Large compensations paid out from the insurance fund created the appearance of a hole being patched.
- Tight temporal correlation between Binance flows and price declines during certain trading windows.
Reasons to be skeptical:
- On-chain reserves, as tracked publicly, do not clearly support a catastrophic insolvency claim.
- Accusing a major exchange of deliberate market manipulation is serious and requires proof, which has not been provided.
Implication: If an exchange-level solvency issue existed, forced selling could persist until internal positions were closed or recapitalized. However, current public data does not conclusively support outright insolvency.
Theory 3 — A Hong Kong cross-asset fund blew up and has been selling to fill a hole
This is the most specific and, depending on your view, the most intriguing theory. It was popularized by experienced traders who observed market structure patterns that resembled a cross-asset desk de-levering over an extended period.
The hypothesis: a Hong Kong-based hedge fund or cross-asset desk suffered massive losses on 10/10, perhaps due to over-levered exposure across equities, FX carry trades, and crypto. To repair capital shortfalls they allegedly sold aggressively into crypto over subsequent months.
Key elements of this idea:
- Cross-asset exposure creates correlated liquidation across equities, precious metals, and crypto when a funding currency (for example the yen) moves sharply.
- Such funds may have financed positions through the yen carry trade — borrowing low-yield yen to buy higher-yielding assets. When the yen strengthens unexpectedly, margin calls can cascade.
- Some speculative names were floated, but none confirmed. The opacity of some Hong Kong fund filings leaves room for discovery as regulatory documents are published.
Implication: If a large cross-asset fund blew up and was forced to liquidate crypto holdings over months, then the forced selling should dry up once they finish selling or go bankrupt and stop trading. Regulatory filings could reveal the truth, and that would be the clearest path to closure.
Which theory fits the evidence best?
To be blunt, none of the theories has airtight proof. It’s been several months, and no confirmed bankruptcy or insolvency has come to light that directly explains the sustained selling. That makes a single-cause explanation less likely.
A more plausible and less sensational explanation is a broader cross-asset deleveraging event, driven primarily by TradFi stress, that spilled into crypto and left longer-lasting selling pressure. Crypto is more connected to TradFi than it used to be — prime brokers, hedge funds, and derivatives desks now link liquidity across asset classes.
In this view:
- 10/10 was the trigger: a macro shock that caused forced deleveraging across multiple markets.
- ADL and exchange-specific events amplified the initial damage, injuring market makers and reducing liquidity supply.
- Some funds and desks were likely hurt enough to de-risk or sell into subsequent months, sustaining the downward pressure.
How long until the forced selling is over?
Timing depends on what actually happened. If it was a single fund that blew up and has been selling to fill a hole, then the selling could end when that fund finally stops trading — which could be weeks to a few months. The FTX unwind took roughly two months to be mostly priced in; a smaller event would likely digest faster.
If instead the persistent selling is structural — market makers pulling back, exchanges tightening risk settings, and TradFi desks remaining cautious — then the normalization becomes a function of capital returning to those roles. That could take longer because it requires balance-sheet repair and confidence restoration.
Signals to watch that would suggest the selling is ending:
- Gradual tightening of spreads and thicker order books across major pairs.
- Reduced frequency of extreme single-day percentage drops in Bitcoin and major alts.
- Decreasing net outflows from major exchanges and fewer large on-chain transfers to exchange addresses.
- Regulatory disclosures or fund filings that close the loop on any blown funds or desks.
How traders can respond
Market environments like the post-10/10 period are messy. Liquidity is less reliable, execution is more expensive, and classical indicators can behave differently. Here are practical steps traders can take:
- Reduce execution sizes and be mindful of slippage. In thin books, smaller trades matter less to price than larger ones.
- Use limit orders more than market orders, or split orders to avoid walking the book.
- Manage leverage conservatively. Volatility spikes can trigger liquidations quickly.
- Monitor exchange-specific anomalies. Differences between exchanges may signal local issues or flow concentration.
- Track on-chain exchange inflows and reserves. Persistent outflows can indicate continued selling pressure.
For traders who rely on timely trade ideas, integrating a robust information edge can help. Cryptocurrency trading signals that surface unusual flow, whale transfers, or exchange-specific imbalances can be especially useful in periods when manual analysis and rapid execution are required. Signals are not a substitute for risk management, but they can highlight developing opportunities and risks across chains at scale.
What this means for longer-term investors
For investors with time horizons measured in years, events like 10/10 are corrections in a larger narrative. The facts that matter long-term are adoption, on-chain activity, and macro liquidity trends. Short-term structural fragility can create opportunity, but it also raises the bar for active trading. Understanding how liquidity providers, exchanges, and cross-asset desks interact is crucial for interpreting price action beyond simple supply and demand.
Checklist: signals, data points, and red flags
- ADL events and exchange compensation disclosures — signal internal stress on platforms.
- Persistent exchange outflows — indicate selling pressure or custody shifts.
- Thin order books and widened spreads — suggest impaired market making capacity.
- Cross-asset sell-offs (equities, precious metals) coinciding with crypto moves — hint at TradFi spillover.
- Regulatory filings for funds with Hong Kong or Asian domicile — potential confirmation of fund-level blows.
Final read: what I think really happened
My best guess is not a Hollywood-style single villain. It is a systemic flashpoint: a TradFi-driven deleveraging event that intersected with fragile crypto market structure. ADL, exchange oracle problems, and some impaired market makers all amplified the shock. The result was a months-long period of fragile liquidity and sustained selling that felt like a hidden forced seller.
That explanation is less thrilling than a single big bankruptcy, but it fits the ambiguous evidence much better. And it has useful implications: once TradFi risk appetites normalize and capital returns to market-making roles, liquidity should recover and the abnormal selling should fade.
Where to look next
Keep an eye on regulatory filings from regional funds, exchange reserve reports, and on-chain exchange flows. Watch for reduced ADL referrals and clearer, deeper order books. Those would be the clearest signals that the market has moved past the post-10/10 fragility.
If you’re actively trading, combining careful execution with timely flow signals and disciplined risk management will serve you better than speculation alone. For those looking for an information edge, cryptocurrency trading signals that flag unusual transfer sizes, concentrated exchange inflows, and rapid open interest changes can help you identify the moments when liquidity stress is escalating or abating.
Closing thought
Markets routinely surprise us with how they transmit stress. October 10 was one of those days where macro policy, exchange mechanics, and participant behavior combined to produce an uncommon aftermath. Whether the lingering selling ends soon or grinds on a bit longer will depend on how balance sheets repair and how TradFi appetite for risk evolves. Watch the data, keep risk explicit, and don’t anchor to any single narrative until the filings and flows give you definitive answers.
FAQ
Did a single firm or exchange go bankrupt on October 10?
There is no public, confirmed evidence of a single catastrophic bankruptcy tied directly to the October 10 event. Several firms reported significant losses, and exchanges acknowledged operational issues and paid compensation, but no definitive insolvency has been proven.
Why did selling continue after leverage was flushed?
Possible reasons include market maker balance-sheet damage, ongoing forced selling from hurt funds or desks, exchange-specific issues that discouraged liquidity provision, and TradFi deleveraging that continued to transmit pressure into crypto markets.
How can I tell when the forced selling has ended?
Look for thicker order books, narrower spreads, reduced frequency of extreme intra-day moves, declining exchange outflows, and regulatory or fund filings that close the loop on any large-blowup hypotheses.
Should I trade differently because of this?
Yes. Reduce leverage, use limit orders or split executions to minimize slippage, and prioritize robust risk management. Consider using reliable trade signals to identify unusual flows and potential execution hazards during periods of impaired liquidity.
Can cryptocurrency trading signals help in this environment?
Yes. Signals that surface whale transfers, concentrated exchange inflows, and rapid changes in open interest can help you detect when selling pressure may intensify or when liquidity is returning. Use them as an informational layer alongside execution discipline and risk controls.
Will regulatory filings reveal the truth?
They might. Regional fund filings and exchange regulatory disclosures can provide clarity on whether specific desks or funds suffered catastrophic losses. Expect some lag before filings appear and be cautious about speculative name-calling until documents are available.
