

Table of Contents
- Why this Fibonacci approach works (and why most traders get it wrong)
- My core idea in one sentence
- Set up your Fibonacci tool
- The 5-step Fibonacci + Fair Value Gap strategy
- Real chart walkthroughs (what this looks like)
- Entry, stop and take-profit rules (quick checklist)
- Advanced tweak (boost risk to reward)
- Common mistakes to avoid
- FAQ
- Final notes
Why this Fibonacci approach works (and why most traders get it wrong)
Fibonacci retracement is one of those tools traders keep coming back to because it actually works — when used correctly. Most people drop the tool on a chart, eyeball the golden zone, and pray. That gets you some winners, but not consistently enough. The difference between mediocre results and sniper entries is context: combine Fibonacci with structure, liquidity, and a clear confirmation signal.
My core idea in one sentence
Use Fibonacci retracement with custom levels, applied inside a high-interest area (a higher-timeframe fair value gap), wait for a lower-timeframe liquidity sweep and a change of character, then enter at the golden zone with a tight stop and a clear take profit.
Set up your Fibonacci tool
On TradingView (or your charting platform), use the Fibonacci retracement tool and change the default levels to my secret configuration:
0
0.706
0.618
0.79
1
These levels highlight three main zones where price has the highest probability of pulling back and reversing — the zone traders call the golden zone.
Screenshot: where to find the Fibonacci tool and where to change settings.
The 5-step Fibonacci + Fair Value Gap strategy
This is the exact routine to repeat on your charts. Keep each step clear and only move to the next after the previous condition is met.
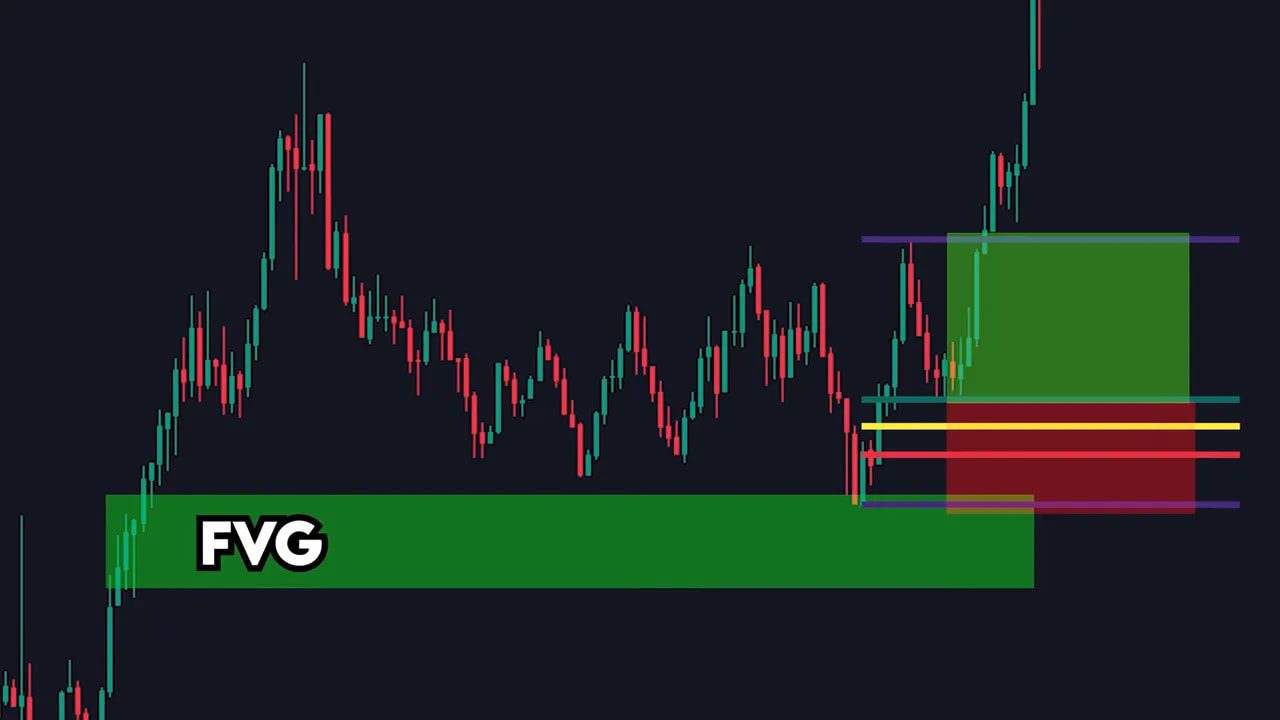
- Find a high-interest area (higher timeframe)
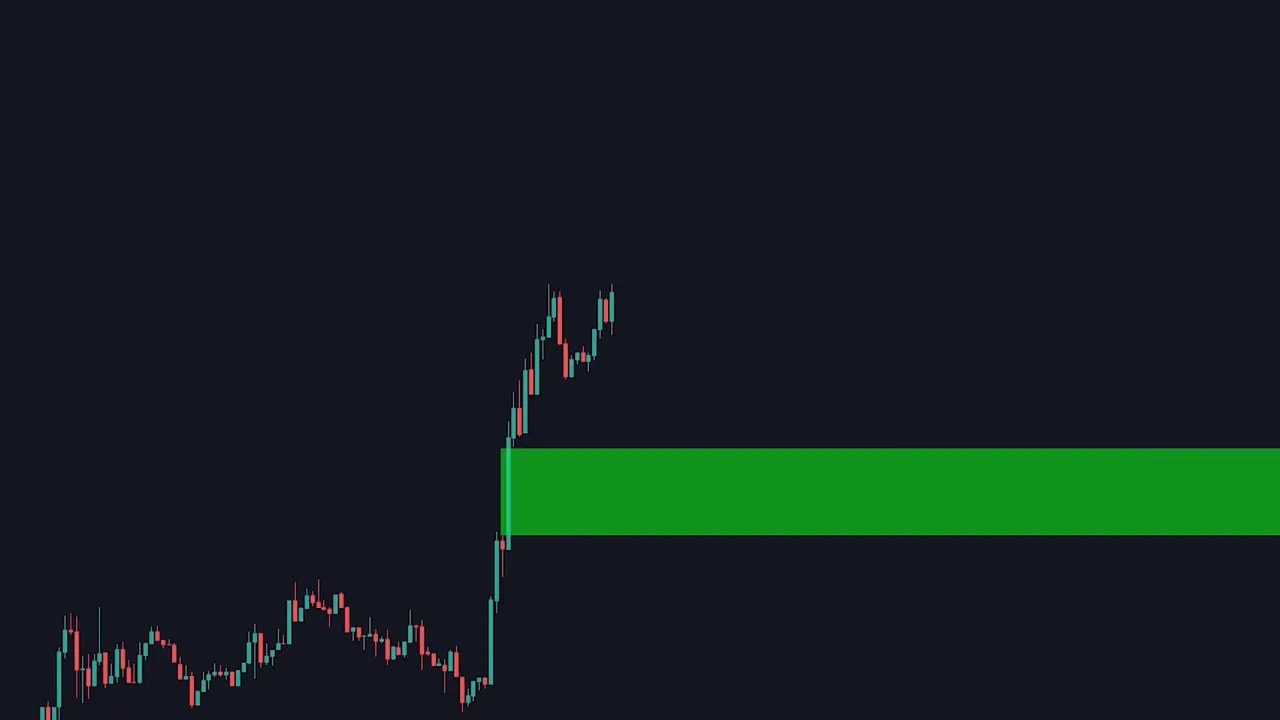
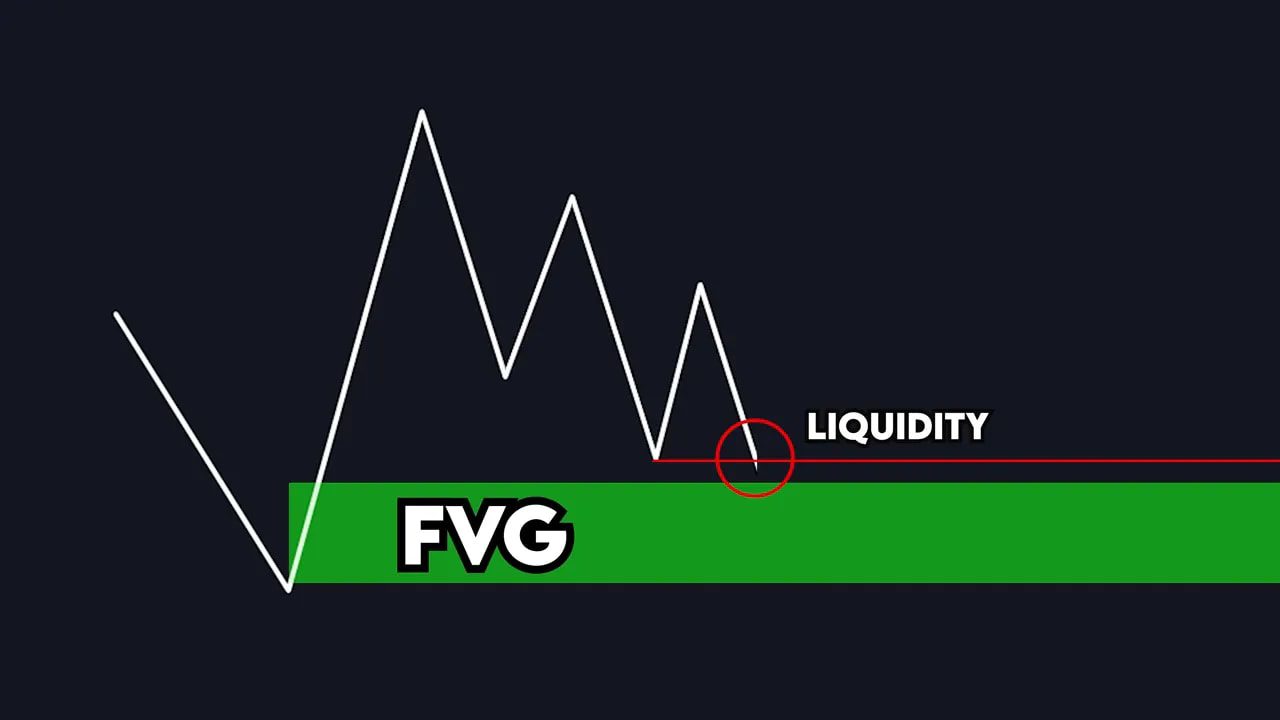
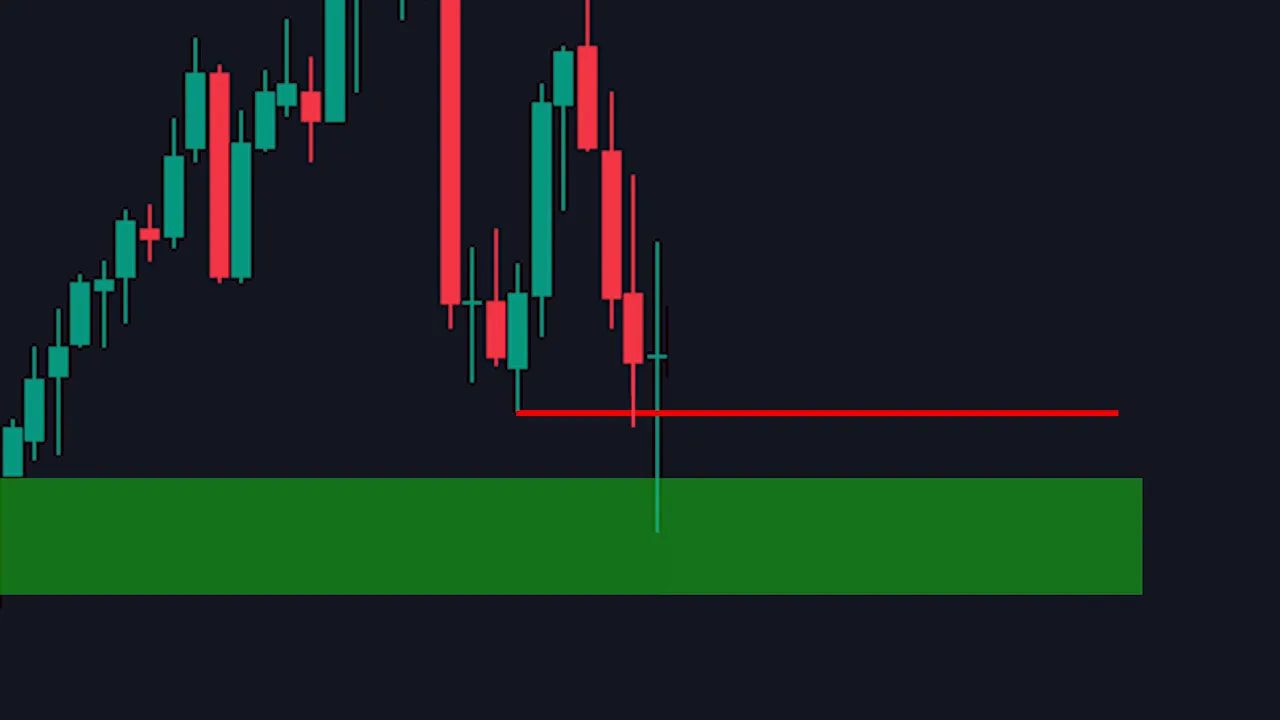
Go to the 4-hour or daily timeframe and look for a fair value gap — a rapid three-candle move that creates an imbalance (large candle with little opposition). Mark the gap from the wick before the move to the wick after the move. On higher timeframes these gaps often get revisited and filled.
- Switch to a lower timeframe and look for liquidity
Move down (for example to 30-min or 15-min). Price should sweep a recent low to collect liquidity (stop orders) ahead of entering the high-interest gap. That sweep is the market grabbing liquidity before reversing into the imbalance.
- Wait for a change of character (confirmation)
Inside the gap, price must bounce and then break the previous high (for bullish scenarios). That break is a change of character: it confirms buyers are taking control and the gap is valid.
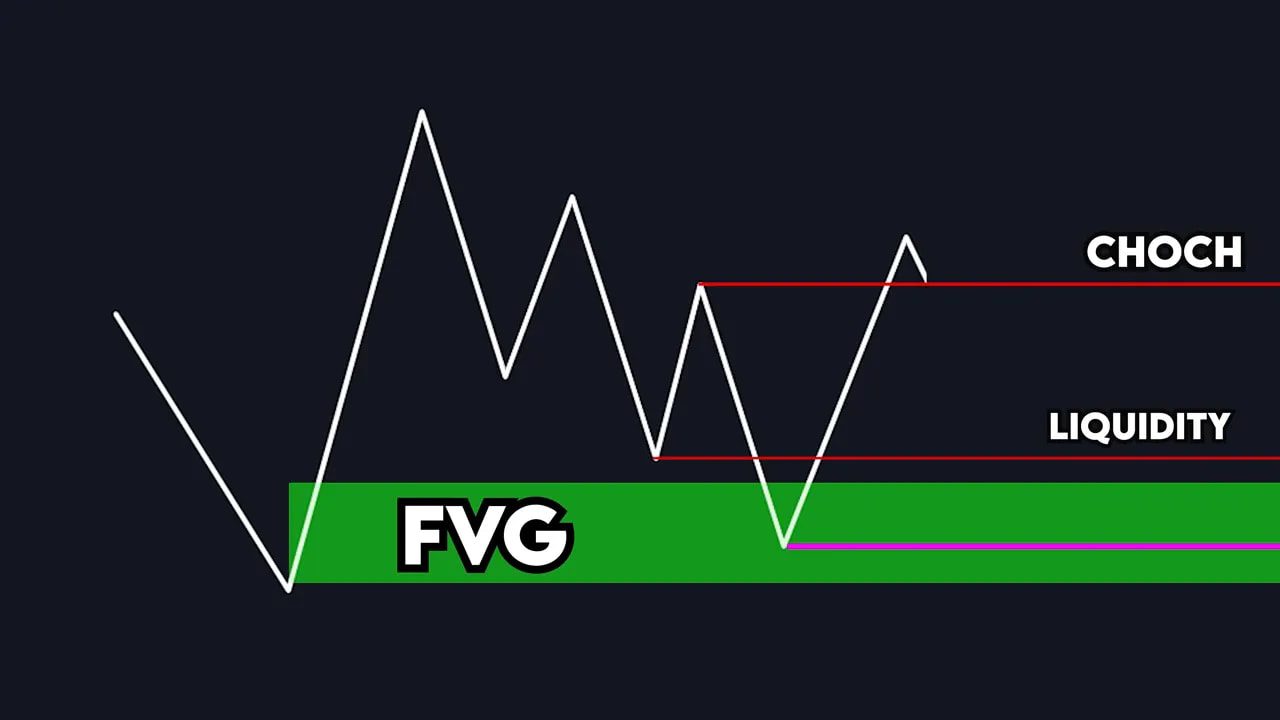
- Place your Fibonacci
Draw Fibonacci from the low at the liquidity sweep to the high of the change of character swing. The modified levels will produce a golden zone where price has the best chance of retracing to and reversing.
- Enter the trade
Enter around the 71% level (0.706 in the settings). Place your stop loss below the most recent low (the sweep low) and set your take profit at the high formed by the change of character. This gives a tight stop and a clean, logical take-profit target.
Real chart walkthroughs (what this looks like)
Example 1: On the 4-hour you spot an uptrend and a fair value gap. Drop to 15-min, see a liquidity sweep, price enters the gap and breaks the prior high (change of character). Draw Fibonacci from the sweep low to the change-of-character high. Wait for retrace to the golden zone, enter at ~71%, stop under the low, target the high — result: clean bounce and hit TP.
Example 2: Same workflow, another pair, same outcome. Fair value gap on 4-hour, liquidity sweep on lower timeframe, change of character, Fibonacci from low to high, golden zone retrace, entry, and win.
Entry, stop and take-profit rules (quick checklist)
- Entry: around the 71% level in your custom Fibonacci.
- Stop loss: below the most recent low (the liquidity sweep low or the bottom of the fair value gap).
- Take profit: the high created at the change of character (the swing high you used to draw the Fibonacci).
- Timeframes: identify the fair value gap on 4H or daily, confirm on 30-min / 15-min.
- Risk management: risk a consistent percentage per trade and use the R:R from the setup. Many examples hit >2:1, and you can optimize this further.
Advanced tweak (boost risk to reward)
The base method delivers tight stops and reliable wins. There is an advanced take-profit optimization that extends targets and improves overall reward without loosening your stop. That tweak is part of a structured, repeatable PDF guide designed to help you scale this strategy while protecting capital.
Common mistakes to avoid
- Dropping Fibonacci on any random move without confirming structure or liquidity.
- Using default Fibonacci levels only. The custom 0.706 / 0.79 additions matter.
- Entering before a clear change of character confirms momentum shift.
- Ignoring higher-timeframe context. Fair value gaps on small timeframes are less reliable.
FAQ
What exact Fibonacci levels should I use?
Use these values: 0, 0.706, 0.618, 0.79, 1. The 0.706 level is your primary entry (the golden zone entry), 0.618 and 0.79 help you see nearby support/resistance within the retrace.
Which timeframes are best for this strategy?
Identify high-interest areas (fair value gaps) on the 4-hour or daily timeframe. Drop to 30-minute or 15-minute to find the liquidity sweep and change of character for entries.
What is a fair value gap and how do I mark it?
A fair value gap is a rapid, imbalanced three-candle move where one candle is much larger and leaves a gap of unfilled orders. Mark it from the wick immediately before the big move to the wick immediately after. That zone often acts as a magnet for price to return and fill the imbalance.
Where should I place my stop loss?
Place stops below the most recent low — typically the liquidity sweep low or the bottom of the fair value gap. That keeps the stop tight and rooted in logical market structure.
Can I use this on forex, crypto, stocks?
Yes. The concept of fair value gaps, liquidity sweeps, and Fibonacci retracements applies across markets. Always adapt position sizing to the instrument’s volatility.
Final notes
This method combines structure (fair value gaps), order flow dynamics (liquidity sweeps), and Fibonacci retracement to produce high-probability entries with small stops and clear targets. Practice it on a demo account until you see repeatable setups, then apply risk-managed live trades.
Try these settings and the five-step routine on your charts and note how often price respects the golden zone when the full context lines up.
