

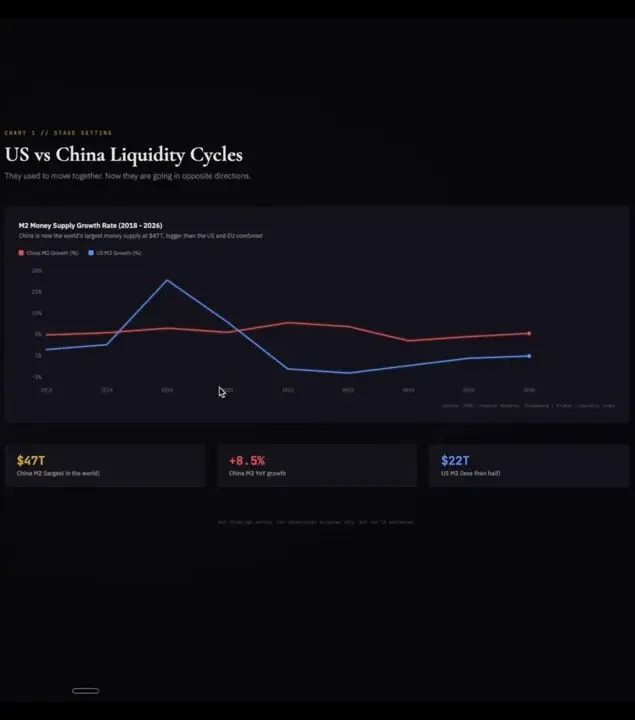
China now controls roughly $47 trillion of money in circulation — a pool larger than the United States and Europe combined. Since 2018 this domestic money supply (M2) has been growing near 8 percent year over year, and policy after the 2021 property shock has pushed Beijing into aggressive liquidity expansion. That flood of capital is finding a home, but not in Bitcoin. Instead, gold and other hard assets are absorbing a huge portion of eastern liquidity. The result is a growing “liquidity wall”: a stream of capital expanding in the East that is largely shut off from crypto.
Table of Contents
- What is the liquidity wall?
- China’s M2 expansion: numbers, motives and the legacy of a property crash
- How gold becomes China’s escape valve
- Capital efficiency: gold versus Bitcoin
- Why Bitcoin is cut off from China’s liquidity
- Bitcoin trades like tech — and that changes how it responds to shocks
- Trading and risk management in a bifurcated liquidity world
- What this means for investors
- Three plausible scenarios for the next 12–36 months
- How to think about allocation and timing
- FAQ
- Final thoughts
What is the liquidity wall?
The liquidity wall is a simple way to describe a structural mismatch between where money is being created and what assets that money can legally or practically buy. China is expanding its M2. Much of that newly available liquidity is channeled into safe-haven, tangible assets — gold, silver, real estate and selected equities — rather than digital assets like Bitcoin, which remain restricted or banned at scale.
The mechanics matter. When a major economy expands its money supply, that capital normally flows across asset classes and borders. If that capital is constrained — for example, by regulations, capital controls, or outright bans on certain asset purchases — those flows pile up in the instruments that remain accessible. For China today, that instrument is gold.
China’s M2 expansion: numbers, motives and the legacy of a property crash
M2 refers to the amount of money readily available in an economy: cash, checking deposits, and near-money assets. China’s M2 has been growing steadily, and that growth has produced a domestic money supply of about $47 trillion. For context, the U.S. M2 stands near $22 trillion.
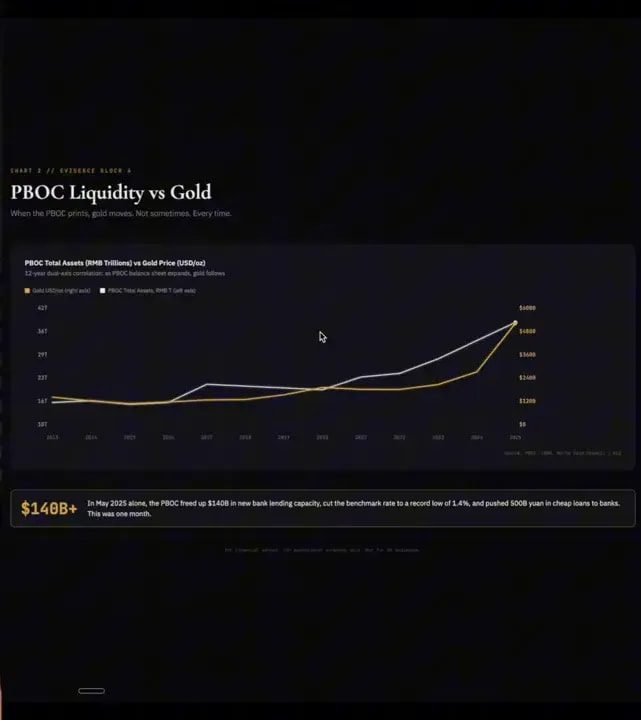
Why print? The short answer: to soften the fallout from a severe property downturn and to prevent a debt-deflation spiral similar to Japan’s experience in the late 1990s. The Evergrande collapse in 2021 exposed deep vulnerabilities in Chinese property financing. To stabilize the system, policymakers have cut interest rates — pushing the policy rate down to historically low levels — and loosened bank regulations to unlock liquidity (estimates on unlocked liquidity run around $140 billion from recent measures).
The policy playbook mirrors Japan’s response to its own property crash: aggressive monetary easing to reduce the real burden of debt. The trade-off is a debasement of the domestic currency in real terms and an incentive for domestic actors to shelter wealth in hard assets that hold value better than paper money.
How gold becomes China’s escape valve
Gold is uniquely positioned to absorb that eastern liquidity. Central banks can buy physical metal and store it; households and investors can hold coins, bars, or jewelry. Unlike Bitcoin, gold is not banned, it is widely accepted across jurisdictions, and it has centuries of cultural and institutional acceptance in China.
Two structural features make gold a particularly potent sink for money supply expansion:
- Large portions of the gold stock are illiquid. A vast amount of gold is permanently held in jewelry, cultural holdings, and central bank vaults. Those holdings are not actively traded, so marginal purchases by institutional buyers can have outsized effects on price.
- Underreported central bank accumulation. Official statistics on central bank gold holdings frequently understate real purchases. Analysts estimate some central bank buying is underreported by multiple times, meaning true demand can be far higher than public figures suggest.
The practical consequence is that relatively modest net flows into gold can translate into large percentage moves in gold market value. That makes gold an efficient absorber of money supply expansion, especially when governments and banks prefer preserving value inside their own jurisdictions.
Capital efficiency: gold versus Bitcoin
Comparing how much an asset’s market cap moves per dollar of new investment gives a sense of “capital efficiency” — how big an impact new flows have on price. Recent data illustrate a striking divergence between gold and Bitcoin.
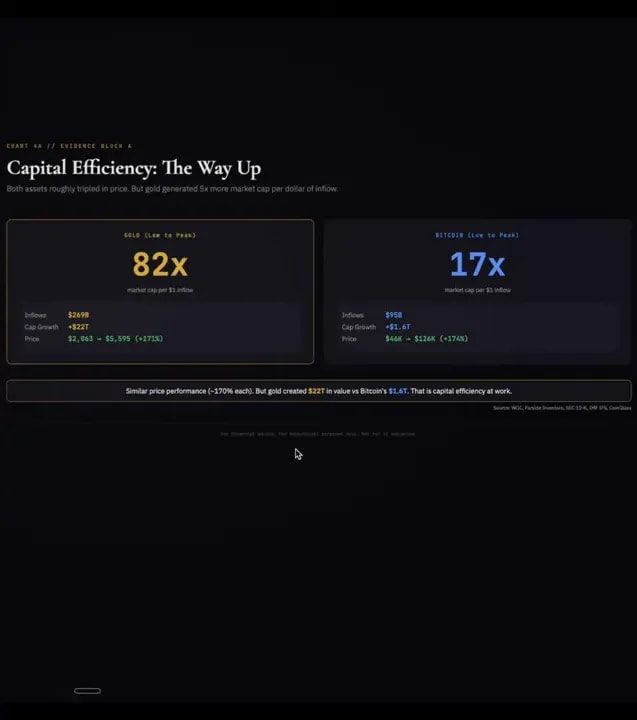
Between the start of 2024 and a subsequent market high, reported inflows into gold (ETFs plus central bank purchases) were roughly $269 billion, while the gold market cap increased by an estimated $22 trillion — a ratio that suggests massive price leverage from relatively modest flows. Bitcoin, on the other hand, recorded about $95 billion of inflows in the same period and saw its market cap rise by roughly $1.6 trillion.
Put another way:
- Every reported dollar into gold drove multiples of its market cap many times larger than the same dollar into Bitcoin during this interval.
- Even under conservative estimates that account for underreporting, gold appears several times more “capital efficient” than Bitcoin when absorbing large-scale liquidity from central institutions.
Why this matters: Bitcoin requires much more incremental capital to move the price compared to gold when central-bank-sized flows are at work. That creates a structural advantage for gold when governments are the marginal buyers.
Why Bitcoin is cut off from China’s liquidity
A crucial structural fact: China restricts, and in many practical ways bans, retail and institutional access to Bitcoin markets. That means a large portion of the planet’s expanding money supply cannot be deployed into BTC through legal, transparent channels.
Some private and illicit flows into Bitcoin from within China exist, but they represent a tiny fraction of global volume (estimates suggest on the order of 1.5 percent of total Bitcoin trading volume is attributable to such clandestine flows). For that reason, the bulk of China’s newly created capital looks to assets like gold, property, and other traditional stores of value.
Meanwhile, the parts of the world that do have easy access to Bitcoin — the U.S., Europe, UK and many developed markets — are not in aggressive money creation mode right now. Their liquidity cycles are neutral or contractionary. In short, the largest expanding pool of liquidity is in the East where Bitcoin is effectively off-limits; the pools that can and will buy Bitcoin are not expanding at the same pace.
Bitcoin trades like tech — and that changes how it responds to shocks
Another structural reality about Bitcoin is how it behaves inside global trading books: it trades, in practice, like technology equities — even like levered tech. Large asset managers, hedge funds, and institutional desks often trade Bitcoin using the same alpha buckets they use for software and high-growth tech exposure. As a result, Bitcoin’s price becomes correlated with tech equity flows, risk-on/risk-off cycles, and the same unwinds that hit software stocks.
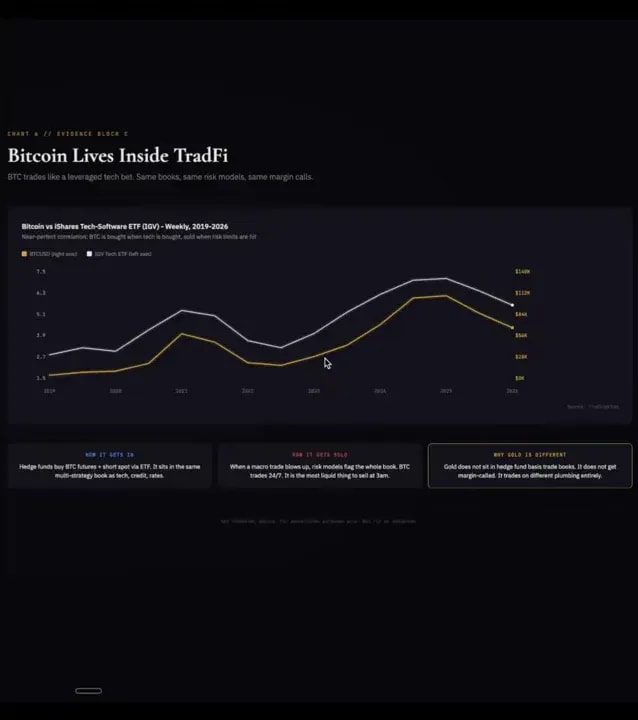
A practical example: when hedge funds engage in the basis trade using Bitcoin futures and spot positions, they are exploiting a small spread. If that spread suddenly widens — for reasons such as liquidity shocks or margin stress — funds must rapidly deleverage, triggering selling in futures and spot markets simultaneously. Big sell-offs in tech can translate into big sell-offs in Bitcoin because they often sit in the same books and face the same margin rules.
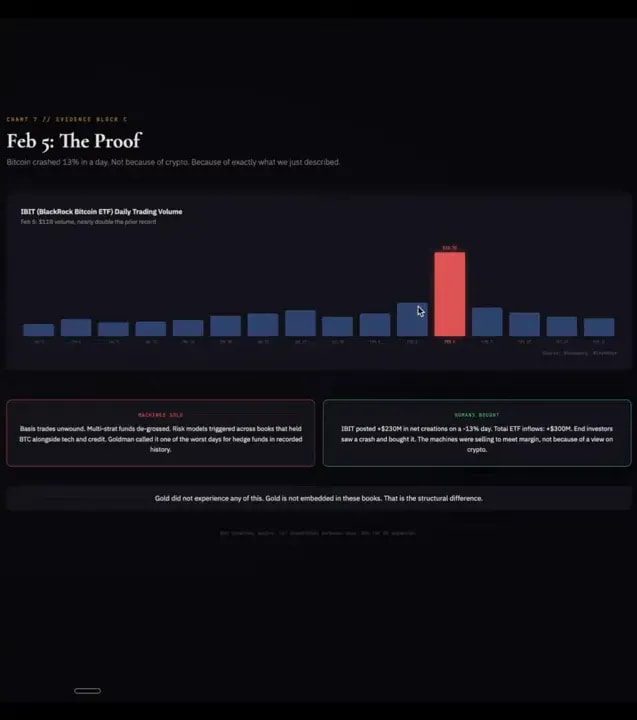
On days of extreme stress — think the February 5 exchange event — Bitcoin’s correlations to tech and to the broader hedge fund complex become painfully obvious: tech sells off, basis trade costs spike, funds unwind, and Bitcoin gets swept along for the ride.
Trading and risk management in a bifurcated liquidity world
Traders and investors operating in this environment need tools and perspectives that reflect these structural mismatches. Knowing whether inflows are coming from central bank balance sheet expansion or from leveraged hedge-fund strategies changes how you read price action.
For execution and tactical positioning, many active traders rely on real-time market signals and pattern recognition to navigate rapid basis changes or liquidity spikes. If you are tracking cross-market correlations and rapid funding-rate moves, a robust signal service that highlights when macro liquidity shifts are likely to stress crypto markets can be useful. Well-crafted crypto trading signals can provide timely alerts around volatility regimes, funding rate anomalies, and correlation breakouts — helping you act quickly when flows flip or when the basis trade goes pear-shaped.
What this means for investors
The structural picture leads to several practical takeaways:
- Gold is the natural recipient of China’s liquidity. Because of legal access and institutional preference, large pools of eastern capital are steering into gold as a value-preserving vehicle while domestic currency debases in real terms.
- Bitcoin remains a function of western liquidity and leveraged market structures. Its short-term trajectory is heavily correlated with U.S. tech flows and hedge fund positioning, not necessarily with eastern money supply cycles.
- Price moves can be asymmetric. Selling pressure tends to move prices more than equivalent buying pressure — a common feature in illiquid or asymmetrically held markets. That effect makes it easier for a relatively small spike in selling to materially depress price, while it can take far larger buying waves to restore previous highs, especially when key buyer classes are absent.
- Regulatory change is the wildcard. If China loosens access to Bitcoin, a previously closed $47 trillion bucket could re-route material flows into crypto over time. Conversely, tougher restrictions or accelerating gold accumulation would further entrench the current divergence.
Three plausible scenarios for the next 12–36 months
- Continued gold dominance: China keeps expanding M2 while maintaining crypto restrictions. Gold absorbs the majority of that liquidity, cementing a divergence where precious metals outperform digital stores of value for a prolonged period.
- Western liquidity unlocks Bitcoin: Central bank or commercial bank policy in the U.S. and Europe loosens and balance sheets expand via different mechanisms. Large institutional flows begin to target Bitcoin more aggressively, reducing the capital-efficiency gap and pushing BTC prices independently of gold moves.
- Regulatory thaw in China: Beijing eases prohibitions or creates regulated onshore access to tokenized or custody-backed Bitcoin products. Over time, this opens the door for eastern capital to participate in crypto, which would be a structural price driver for BTC.
How to think about allocation and timing
Asset allocation should reflect two things: correlation and access. Gold behaves differently from Bitcoin and often provides a portfolio hedge when fiat debasement is the concern. Bitcoin can be a high-volatility growth-like allocation inside a portfolio, but it is currently more sensitive to western financial plumbing than to eastern money supply cycles.
Timing matters. If liquidity expansion is the main driver you care about, watch central bank balance sheet moves, M2 growth, and policy announcements across major economies. Observe funding rates, basis spreads, and ETF flow data for Bitcoin on the trading side — these indicators will show stress before prices necessarily turn.
FAQ
Why can’t China buy Bitcoin at scale?
China has imposed regulatory restrictions on cryptocurrency trading, exchange operations, and domestic custodial services. While private peer-to-peer and offshore channels exist, legal, transparent, onshore routes are limited. That makes large-scale, sanctioned purchases of Bitcoin impractical for central actors and many institutional investors inside China.
How does M2 growth translate into asset price moves?
M2 growth increases the pool of money that can be deployed into assets. When money supply expands, investors seek stores of value or yields; where that money lands depends on access, cultural preference, and regulatory constraints. Large, concentrated buyers (like central banks) can push prices sharply if the asset has limited immediate liquidity, as is the case with physical gold.
Can Bitcoin become a global store of value like gold?
It could, over time, but several conditions would need to change: broad regulatory acceptance across major economies, deep institutional custody solutions, and an expansion of the pool of buyers. Today Bitcoin functions more like a high-beta, tech-like asset class in many trading books, and until access barriers fall, its ability to absorb central-bank-sized flows will be limited.
What is the basis trade and why does it matter for Bitcoin?
The basis trade exploits price differences between spot and futures markets. Traders buy spot and sell futures, capturing the spread as an interest-like return. When spreads widen suddenly (for example, during margin stress), funds must unwind positions quickly. Those forced liquidations drive selling across both futures and spot markets, which can amplify Bitcoin price declines.
How should active traders prepare for liquidity shocks?
Monitor funding rates, basis spreads, ETF flows and macro liquidity indicators such as M2 and central bank balance sheet moves. Use disciplined risk sizing, maintain liquidity buffers, and consider subscribing to timely trade signals that highlight shifts in intraday funding or correlation breakdowns. A reliable signal service can help identify when macro liquidity rotations will likely stress crypto markets.
Final thoughts
The current divergence between where global liquidity is being created and what assets are accessible to that liquidity is reshaping price relationships. China’s expanding money supply and active gold accumulation have created a liquidity wall that systematically favors precious metals over Bitcoin for now. Bitcoin’s path upward depends not only on crypto-native demand but on broader changes in global liquidity and regulatory access.
That’s not a fatalistic conclusion. Markets evolve. Regulatory frameworks change, pools of capital shift, and correlations break — sometimes permanently. For anyone trading or allocating capital, the most useful stance is probabilistic: watch the data, understand the structural constraints, and adapt positions when the balance of evidence shifts. If you trade actively, consider signal-driven alerts to help navigate rapid funding-rate moves and correlation shocks; having timely information about liquidity regimes can be the difference between getting run over and getting out ahead.
What do you think will break the liquidity wall first: a regulatory thaw in China, a renewed Western liquidity expansion, or something else entirely? The next moves will be decisive for both gold and Bitcoin.
