

Table of Contents
- Outline
- Weekend in one line
- What happened and why it matters
- Energy markets: Straits of Hormuz and the real black swan
- Gold and oil reaction — big moves, smaller follow-through
- Stocks, PMI and the macro backdrop
- Bitcoin: dip, then pump — why that happened
- Altcoins and individual trades to watch
- Trading approach in a volatile weekend
- Where value might be hiding
- Final notes on positioning
- FAQ
- Parting thought
Outline
- Weekend summary: what happened and why markets reacted the way they did
- Energy markets and the Straits of Hormuz risk
- Gold and oil: the initial moves and what they mean
- Stocks, PMI data, and the “big money” read
- Bitcoin’s surprising pump and the critical technical levels
- Altcoins, MicroStrategy, Solana, Tesla — trade setups to watch
- Practical trading tips and using cryptocurrency trading signals
- FAQ
Weekend in one line
The weekend served up a geopolitical shock: targeted strikes in the Gulf after an escalation with Iran. Markets reacted, but not the way many headline-screaming takes predicted. Gold and oil jumped, stocks wobbled then shrugged, and Bitcoin—ironically—popped after an initial dip. If you felt whiplash from the headlines, you’re not alone. There’s a lot to unpack, and most of it boils down to three things: risk perception, physical supply risk in energy, and trader positioning.
What happened and why it matters
The strikes hit leadership targets and produced waves of missile and drone activity across the Gulf—UAE, Bahrain, Kuwait, Qatar and beyond. On the ground, missile defense systems were working hard. Locally, things were loud and tense; in one reported instance a drone explosion shook a house about a kilometer away. But from a market perspective, the impact depends on whether the conflict stays limited to air bases and symbolic targets or escalates to oil infrastructure and key shipping lanes.
Why the focus on the Gulf? Because this region is the engine of global oil and LNG flows. Disruptions reverberate worldwide—shipping routes, refining capacity, and access to liquefied natural gas. That’s why even isolated strikes near facilities like Ras Tanura get traders’ attention.
Energy markets: Straits of Hormuz and the real black swan
The Straits of Hormuz is the choke point everyone references for good reason: a narrow stretch where a large percentage of seaborne oil transits daily. If that gets mined or effectively closed, prices would spike dramatically because the physical supply would be instantly constrained.
Over the weekend a few tankers were struck and caught fire. Saudi Arabia temporarily shut down parts of the Ras Tanura refinery after a drone caused a small fire. These were not cataclysmic hits—but they are reminders that oil infrastructure can be targeted, and that’s the kind of damage that changes the global supply calculus.
Right now, markets are pricing in uncertainty, but not apocalypse. Traders are asking whether Iran would raise the stakes by hitting oilfields or mining shipping lanes. For Tehran, that’s a double-edged sword: closing Hormuz hurts everyone, including their own export capacity. So the likelihood of a self-destructive permanent closure remains a live debate among strategists.
Gold and oil reaction — big moves, smaller follow-through
Gold and oil saw weekend spikes—but the intraday action tells a more nuanced story. Gold ran up by a few hundred dollars from the pre-strike level but then pulled back. Oil opened sharply higher (a roughly $10 pump from a $72 close to $82 open) but quickly cooled, settling around the high $70s per barrel at the time of these notes.
What does this mean? The knee-jerk reaction was risk-off: safe-haven bids into gold and commodity repricing for oil. The follow-through suggested that larger market participants were not convinced this was a wholesale supply shock yet. In other words, headline volatility moved prices, but big liquidity players did not treat it as a structural change—yet.
Stocks, PMI and the macro backdrop
Economic data also mattered. The ISM Manufacturing PMI came in at 52.4, marginally below the prior 52.6 but still in expansion territory. That keeps the narrative of an economy that’s not rolling over, which matters a lot for risk assets. With a solid PMI, the S&P 500 opened in the green despite geopolitical headlines.
Markets are balancing two narratives: geopolitical risk pushing towards safe havens and solid economic readings propelling risk assets. When those forces hit at the same time, you often get choppy but contained moves—sharp intraday swings that resolve without a directional trend until clearer information arrives.
Bitcoin: dip, then pump — why that happened
The most eyebrow-raising market reaction was Bitcoin. It initially dipped to around $63,000 when the strikes hit. That was the immediate risk-off move—liquidity-seeking and capital preservation. But Bitcoin then rallied and was trading higher after that initial shock.
Two forces are worth noting here. First, crypto has become an institutional hedge in some portfolios, and flows can reverse quickly when traders decide risk is contained. Second, technicals matter. Traders were watching a few critical levels, particularly the 20-day exponential moving average.
Why the 20-day EMA matters
The 20-day EMA is a common short-term momentum filter for traders. A daily close above it often signals a shift from short-term bearishness to respite or a relief rally. At the time under discussion, a daily close around $69,000 was the number traders wanted to see to get back above that 20-day EMA. Reclaiming that level would not guarantee a new bull run but could fuel a relief rally—especially after a prolonged stretch of negative monthly closes.
Bitcoin had closed five consecutive months in the red—something last seen in 2018. That sequence historically preceded significant rallies, though not always to all-time highs. For long-term investors, deep drawdowns can create value opportunities. For short-term traders, the immediate play is watching the daily closes and momentum indicators.
“Crypto is trading at a 50% discount to its long-term trend… as long as you have a multi-year view, this is a fantastic time to enter.”
That perspective—coming from experienced investors who’ve been in the space for a decade—matters because it reframes current price action as potentially cyclical value rather than a structural failure. Still, always match that view with risk tolerance and time horizon.
Altcoins and individual trades to watch
If Bitcoin’s behavior is a risk barometer, altcoins tell you how aggressive traders are willing to be beyond BTC. A few names stood out over the weekend.
Solana
Solana is a useful proxy for risk-on appetite. The technical setup showed a chance to close above the 28-day EMA. A daily close above key exponential moving averages could prompt a move back up toward the longer trend line, potentially offering a trade from roughly $80 to $120 if momentum holds.
MicroStrategy (MSTR)
MicroStrategy has been crushed over many months, but on the weekly chart it bounced off major support. The weekly MACD showed a bullish crossover in heavily oversold territory and the RSI was very low. Those are turning-signal ingredients for a potential mean-reversion trade. It’s a risky play because MSTR amplifies BTC exposure, but it’s one to watch if you believe BTC stabilizes or recovers.
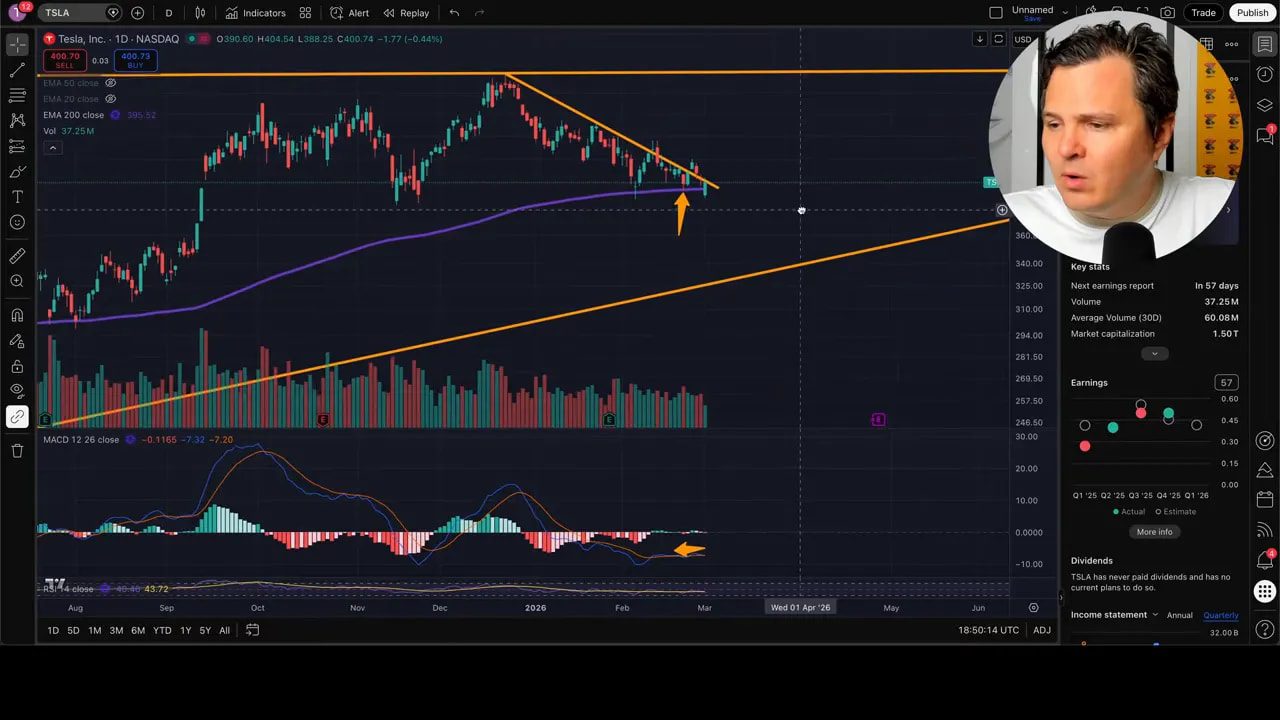
Tesla
Tesla is still in a broader downtrend despite periodic bounces. It bounced off the 200-day EMA a few times but hasn’t broken the downtrend. A break above the downtrend would be bullish, while a failure and a break under the 200-day could be a chance to add on dips—targets talked about included the low $300s.
Trading approach in a volatile weekend
Volatility driven by geopolitical events creates opportunity and risk. Here’s a practical approach to trade responsibly:
- Let price settle before taking fresh directional risk. Intraday spikes can reverse; waiting for a daily close above/below key levels reduces false signals.
- Use tight risk management. Position size for worst-case scenarios. When political risk is the catalyst, outcomes can be binary and fast.
- Combine macro and technical views. Know the big-picture risk (e.g., energy supply) and the immediate technical triggers (e.g., 20-day EMA on BTC).
- Diversify across strategies. If you trade futures or leverage, hedge with options, or stagger entry points to avoid being fully exposed to a sudden escalation.
- Have a plan for quick liquidity events. In stressed markets, slippage widens. Plan exits in advance and be ready to reduce exposure fast.
For traders who need timely, actionable entries and exits, using a reliable source of trade ideas can be a force multiplier. Our cryptocurrency trading signals provide succinct buy and sell levels, stop-loss guidance, and risk sizing recommendations—helpful when markets move faster than human reaction time.
Where value might be hiding
Periods of drawdown create asymmetrical opportunities if you have a multi-year view. Bitcoin historically has rewarded long-term holders—data points show that investors who hold BTC for four years historically end up profitable across multiple cycles. That doesn’t guarantee outcomes, but it frames the current discount (crypto trading below long-term trend) as potentially attractive for patient capital.
Deep value zones are where selective investors start scanning for high-conviction names: large but battered equities like MicroStrategy for leveraged BTC exposure, leading altcoins that show network activity and developer momentum, and strategic positions in broad crypto indices.
Final notes on positioning
Geopolitical shocks are inevitable. The important questions for market participants are: does this change the structural supply/demand for an asset, and do traders believe it will be contained? Based on the price action, the market’s current read is “contained”—but that can change fast. Watch the Straits of Hormuz, watch physical strikes on oil infrastructure, and watch liquidity flow in and out of major safe-haven assets.
If you’re an active trader, combine macro awareness with clear technical triggers. If you’re a longer-term investor, focus on risk-adjusted entry points and be prepared to average in over time instead of trying to time a single bottom.
FAQ
How did the Iran strikes affect Bitcoin immediately?
Bitcoin dipped initially as traders sought safety during the first shock. Once headlines stabilized and macro data did not show a structural economic collapse, BTC rebounded—driven by short-covering, opportunistic buying, and a technical move toward reclaiming short-term momentum indicators like the 20-day EMA.
Will oil spike dramatically if tensions continue?
Oil can spike if physical supply is threatened—especially if attacks expand to major refineries, oil fields, or the Straits of Hormuz. For now, markets are pricing in risk but not permanent disruption. Escalation to shipping lane closures or sustained damage to production would be the catalyst for a major spike.
Is gold still a safe haven in this environment?
Gold behaves as a safe-haven and inflation hedge; it rallied on the initial shock but pulled back after markets decided the event might be limited. Gold remains a hedge against uncertainty, but its near-term price action will track risk perception and real yields.
Should I buy BTC now if I’m a long-term investor?
If you have a multi-year horizon and can stomach drawdowns, dips like this can be attractive entry points. Historical cycles suggest long-term holders have often profited, but this is not guaranteed. Dollar-cost averaging reduces timing risk and spreads exposure over volatile periods.
How can I manage trades during fast geopolitical moves?
Keep position sizes conservative, use stop-losses, wait for clear daily closes beyond key technical levels before adding aggressive positions, and consider hedging with options. If you trade frequently, consider using curated cryptocurrency trading signals to streamline entry and exit decision-making during rapid moves.
Parting thought
Markets will continue to react to headlines, but not every headline changes the underlying supply-demand picture. The real game is separating noise from structural change. Track the physical risks in energy, watch whether geopolitical actions target infrastructure or shipping lanes, and keep an eye on key technical levels that tell you whether traders are willing to buy the dip or sell into the noise.
Trade with discipline, size positions to handle worst-case scenarios, and if you need help turning analysis into timely entries and exits, professional signals can cut through the noise and give you executable levels when volatility spikes.
Peace.
