

Table of Contents
- Outline
- What actually triggered the chaos?
- Immediate market impact: carnage and forced selling
- Bitcoin versus gold: the safe-haven thesis gets tested
- Institutional plumbing: ETFs, algorithms, and correlation by design
- Miners capitulate and stablecoin dry powder evaporates
- The Fed’s impossible trap: tariffs, inflation, and stagflation risk
- Liquidity matters: why Treasury bill issuance can drive Bitcoin
- Bitcoin’s issuance and scarcity: the math still favors BTC long term
- Historic pattern: every 40–50 percent correction recovered
- Sentiment at extremes: Fear and Greed index
- Is this the end of the digital gold thesis?
- Practical takeaways and how to position
- Who is being shaken out—and who benefits?
- Conclusion
- FAQ
Outline
- What happened: the tariff shock and legal drama
- Immediate market reaction: liquidations, ETF outflows, miner capitulation
- Bitcoin versus traditional safe havens: the gold divergence
- Macro picture: the Fed’s impossible trap and stagflation risk
- Liquidity, treasury bills, and why issuance matters for BTC
- Supply dynamics: Bitcoin’s scarcity vs gold’s inflation
- Why this may be a historic buying window—not the end
- Practical takeaways and how to position (risk management and tools)
- FAQ
What actually triggered the chaos?
A single policy move changed the market landscape almost overnight. A 6-3 Supreme Court decision briefly ruled the president’s previous tariff sweep unconstitutional, markets breathed, and Bitcoin bounced modestly. That reprieve was short lived. The president then invoked Section 122 of the Trade Act of 1974 and announced a new, never-before-used 15 percent global import surcharge covering virtually every trading partner for 150 days.
Section 122 allows temporary import surcharges to address “fundamental international payments problems.” Seen as historically unprecedented, it instantly reintroduced geopolitical and inflation uncertainty into price discovery for everything from equities to commodities to crypto.
Immediate market impact: carnage and forced selling
The market did not take this abstraction lightly. Bitcoin fell more than 5 percent in under two hours, plunging from roughly $67,600 to a low near $64,090. That sharp move cascaded into a forced liquidation event: more than $500 million in leveraged crypto positions were wiped out within 24 hours, and open interest in derivatives collapsed from about $38.3 billion to roughly $19.5 billion.
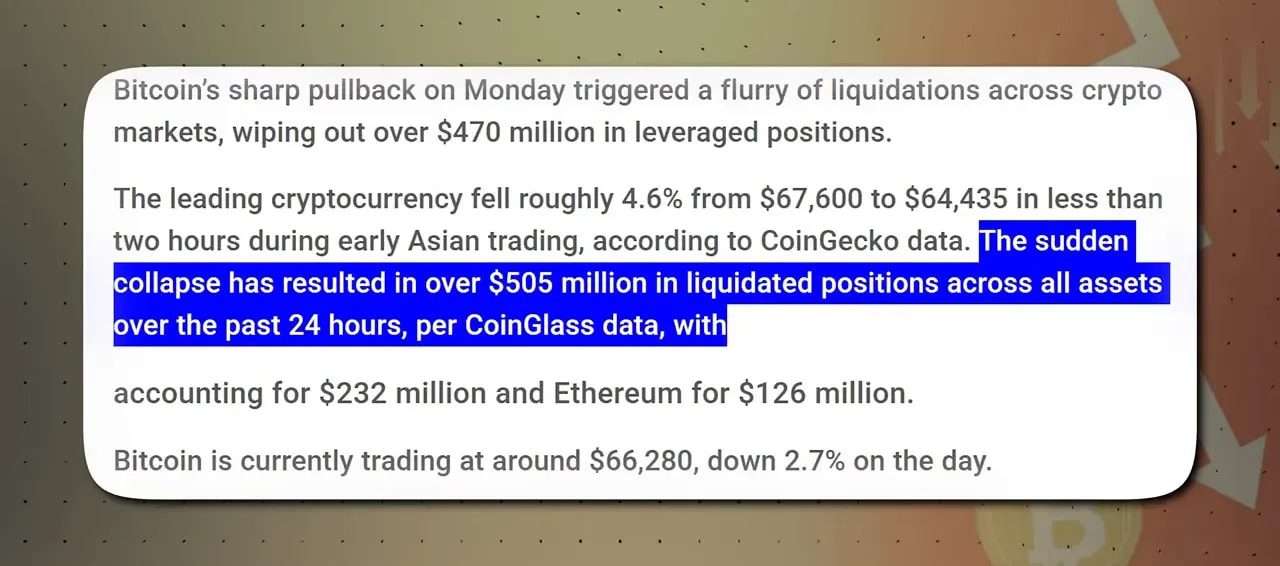
Over 136,000 traders were liquidated. These numbers are brutal reminders of how fragile highly leveraged positions can be when macro headlines bite. But the deeper story is the behavior divergence between Bitcoin and other traditional safe havens.
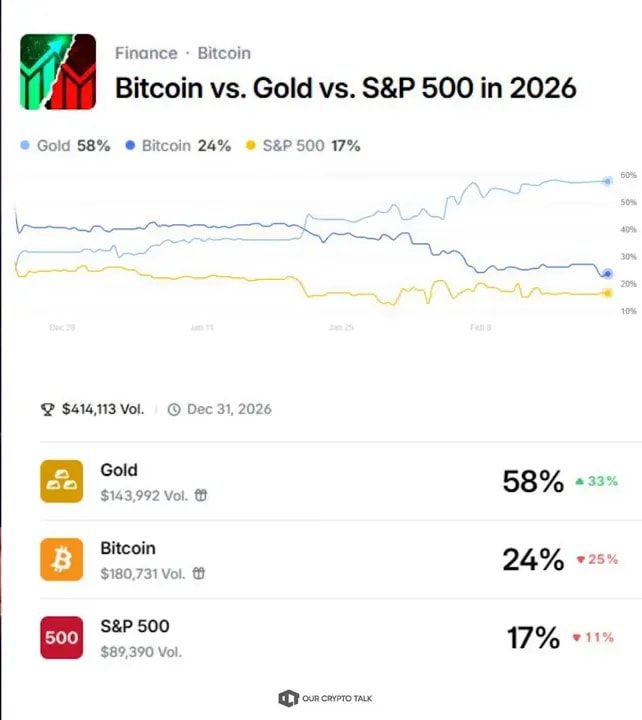
Bitcoin versus gold: the safe-haven thesis gets tested
The long-standing narrative pitched to many investors was simple: Bitcoin, as a capped, non-sovereign supply asset, should behave like digital gold. When governments print or geopolitical risk rises, Bitcoin should protect wealth the way gold has for millennia.
On tariff day that thesis failed its biggest test. Physical gold surged roughly 2.64 percent and rode back toward its all-time highs, while Bitcoin fell more than 5 percent on the same news. At one point the divergence measured more than six percentage points on the identical macro trigger.
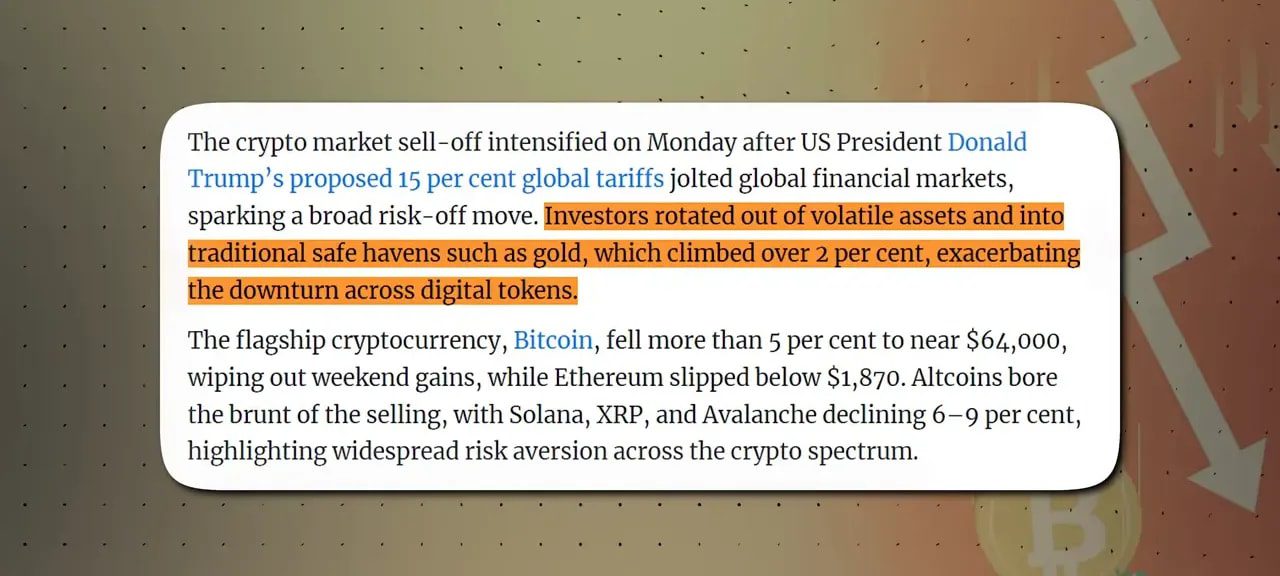
Relative to gold, Bitcoin’s purchasing power has collapsed in a short period: where one Bitcoin once bought about 38 ounces of gold in December 2024, that figure had slipped to nearly 13 ounces by this sell-off—an over 62 percent relative loss in just over a year.
That’s not an anecdote. It’s a structural result of how Bitcoin is being held and traded today. Rather than acting as a purely non-correlated store of value, Bitcoin recently behaves more like a high-beta tech asset that moves with risk-on/risk-off flows tied to equities.
Institutional plumbing: ETFs, algorithms, and correlation by design
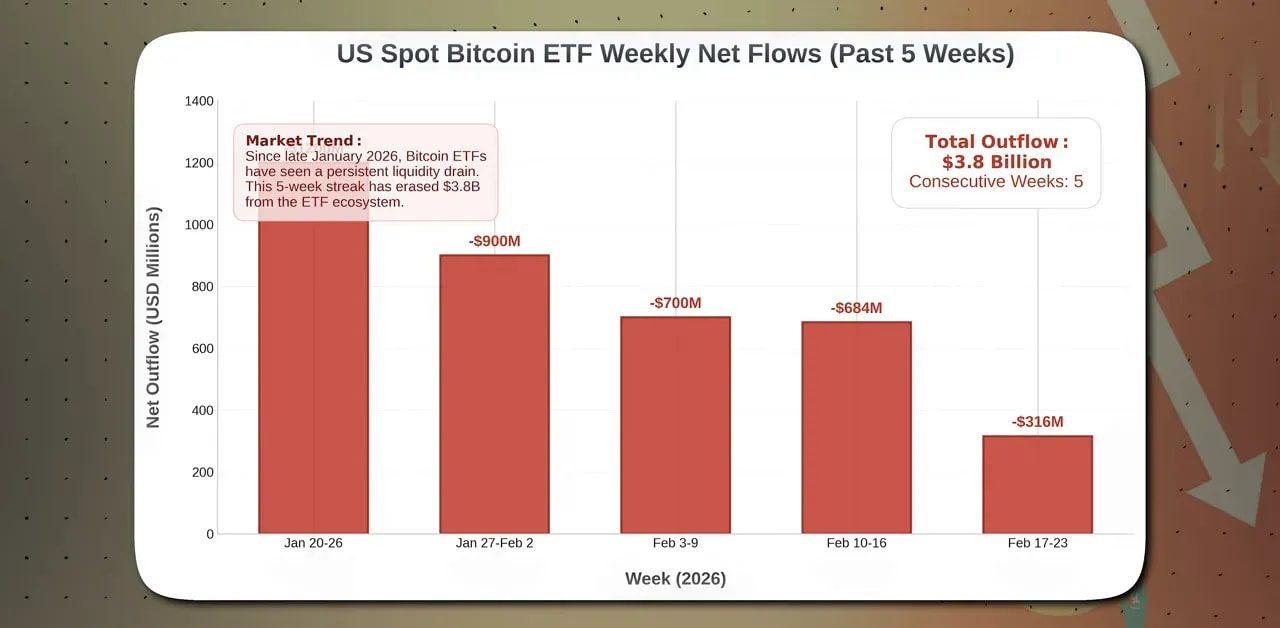
Institutional flows amplified the damage. Since late January, US spot Bitcoin ETFs recorded five consecutive weeks of net outflows—roughly $3.8 billion pulled from the ETF complex in a little over a month. Major funds saw sizable redemptions: BlackRock’s iBIt and Fidelity’s FBTC together accounted for a large share of these outflows.
When ETFs are integrated into traditional trading systems, they transform Bitcoin into an asset that gets sold automatically when risk-reducing signals trigger across a hedge fund’s book. An algorithm told to de-risk doesn’t think in narratives; it sells Apple, Tesla, long-dated bets, and tiny-bitcoin allocations indiscriminately. The consequence is institutional correlation by architecture.
Miners capitulate and stablecoin dry powder evaporates
Selling pressure didn’t come only from traders and ETFs. Large miners moved from hedging to outright liquidation. One of the largest public miners reported selling newly mined coins and liquidating its entire reserve, leaving it with zero BTC on the balance sheet. When miners—long considered structural buyers of last resort—turn sellers, it signals real stress.

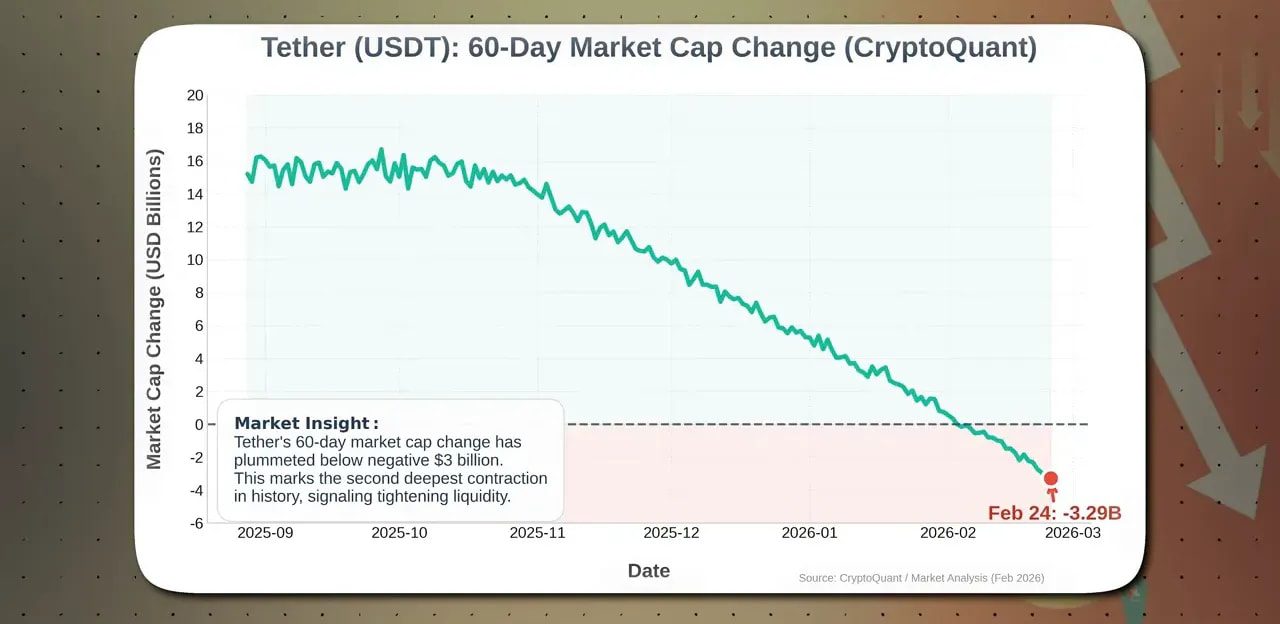
At the same time, stablecoin liquidity contracted. Tether’s market cap change over 60 days slid below negative $3 billion. Stablecoins act as the market’s dry powder; when that pool draws down, capital is not just rotating—it’s leaving the crypto ecosystem.
The Fed’s impossible trap: tariffs, inflation, and stagflation risk
Tariffs are inflationary by design. A 15 percent surcharge on imported goods filters through to consumers unless businesses accept margin compression. The Core Personal Consumption Expenditures Index, the Fed’s preferred inflation gauge, printed at a hotter-than-expected 3 percent year over year. That’s well above the Fed’s 2 percent target and complicates monetary policy.
The Federal Reserve faces a classic dilemma. It wants to cut rates to prop up a slowing economy, but rising inflation gives it little room to do so. Cutting prematurely risks igniting sticky inflation—stagflation, the worst environment for risk assets and a killer for high-multiple tech stocks and Bitcoin alike.
The market is already signaling this tension: Treasury yields are falling while the US dollar remains strong, and investors rotate into cash, government bonds, and gold. Risk assets get sold in the scramble.
Liquidity matters: why Treasury bill issuance can drive Bitcoin
A lot of Bitcoin commentary focuses on the Fed’s balance sheet or M2 money supply. Those are important, but data suggests another powerful liquidity lever: Treasury bill issuance. Since 2021, short-term Treasury issuance has shown an 80 percent positive correlation with Bitcoin with a lead time—big increases in T-bill supply often precede BTC strength months later.
T-bill issuance has been ebbing into early 2026, which aligns with recent Bitcoin weakness. However, a massive refinancing wave—estimated at $3 to $4 trillion annually—builds through 2029. The likeliest path is more short-term issuance to meet that demand. That could inject fresh liquidity into markets and, historically, has correlated with strengthening Bitcoin prices.

Bitcoin’s issuance and scarcity: the math still favors BTC long term
The supply side is simple and immutable: Bitcoin’s block reward now sits at 3.125 BTC per block, translating into roughly 450 BTC issued every day. That equates to an inflation rate around 1 percent annually—mathematically more scarce than gold’s estimated 1.5 to 2 percent yearly increase.
Markets are currently focused on macro fear and liquidity, not on this looming supply-deficit argument. When panic subsides and demand returns, that lower issuance rate will matter.
Historic pattern: every 40–50 percent correction recovered
History provides perspective. Since 2014, Bitcoin has endured nine major corrections in the 40 to 50 percent range from cycle peaks. After every one of those corrections Bitcoin eventually made a new all-time high. The average recovery time for falls of that magnitude historically falls between nine and fourteen months.
This downturn is not the 2022 systemic collapse where prices plunged about 77 percent amid exchange and lender insolvencies. This is a mid-cycle macro shakeout driven by policy headlines and heavy institutional flows. That distinction matters when thinking about recovery probability.
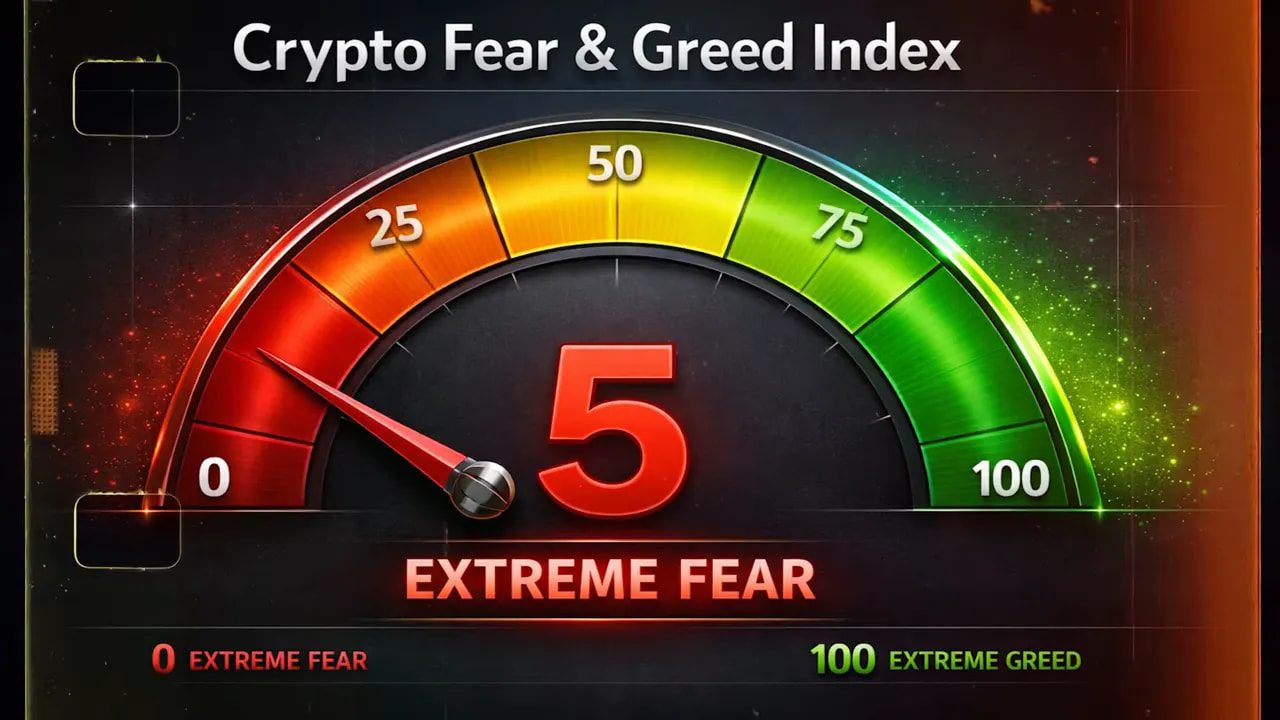
Sentiment at extremes: Fear and Greed index
Sentiment metrics have hit extremes. The Fear and Greed Index plunged to the low single digits—levels last seen in March 2020. Extreme fear often lines up with market bottoms because forced liquidations and weak hands capitulate, creating the conditions for the final wave of buying from contrarian, longer-term holders.
Is this the end of the digital gold thesis?
Short answer: not necessarily. The way Bitcoin traded on tariff day exposes a key truth: as long as BTC is deeply integrated into institutional products and ETFs, it will be subject to correlation with traditional risk assets in short-term stress. That undermines the narrative that Bitcoin is an immediate safe-haven substitute for gold.
But the long-term narrative for a decentralized, capped-supply asset remains intact if persistent inflation takes hold. If tariffs produce sticky inflation and central banks cannot cut, the fundamental case for holding assets with fixed supply grows stronger. In that world Bitcoin’s scarcity and censorship resistance could become increasingly attractive as an inflation hedge—particularly for capital outside traditional banking systems.
Practical takeaways and how to position
- Adjust exposure to volatility: Expect intra-day spikes and forced liquidations to continue while macro uncertainty remains. If you trade spot with leverage, reduce sizing to avoid wipeouts.
- Watch liquidity signals: Stablecoin supply and ETF flows are immediate market liquidity indicators. Large USDT contraction suggests dealers have less dry powder to buy dips.
- Follow treasury issuance: Rising T-bill issuance historically precedes Bitcoin strength. That can be a macro signal to increase exposure tactically.
- Respect miner behavior: Miners selling reserves is a near-term selling pressure signal. Conversely, when miners rebuild reserves, it often signals stabilization.
- Long term vs trading mindset: Distinguish between rebalancing because of algorithmic selling and core long-term convictions. ETFs contain sticky retirement and institutional capital less likely to panic-sell.
For active traders looking for more timely entry and exit signals during volatile windows, high-quality market analysis can make a meaningful difference. Cryptocurrency trading signals that combine on-chain indicators, liquidity metrics, and macro context can provide disciplined trade ideas and alert you to opportunities when the market is moving quickly. Used responsibly, they help manage risk and spot high-probability setups during panics without being driven purely by emotion.
Who is being shaken out—and who benefits?
The present environment primarily removes leveraged, short-term players and some hedge funds executing cash-and-carry trades. Long-term holders—retirement accounts, pension funds, and realistic belief investors—tend to be more “sticky.” The capitulation phase transfers real assets from fragile to patient hands.
Historically, those who can tolerate the drawdown and hold through the liquidity reset tend to be best positioned for the next leg up. That is not investment advice; it is a recurring market pattern observed across asset classes.
Conclusion
The tariff shock exposed two uncomfortable truths at once. In the short term, Bitcoin behaves more like a high-beta tech stock because institutional plumbing forces it to trade with equities. That reality undermines the “instant safe haven” story. At the same time, the asset’s fixed issuance and rising long-term liquidity needs point to a structural scarcity argument that still makes sense if inflation becomes sticky.
Market extremes, history, and supply math suggest this could be a significant contrarian buying window rather than the end of Bitcoin. The important question for any participant isn’t whether Bitcoin will eventually recover but whether you and your risk management plan will be in place when it does.
FAQ
Why did Bitcoin fall while gold rose during the tariff announcement?
Bitcoin fell because institutional flows and algorithmic de-risking sold BTC alongside equities. ETFs connect crypto to traditional finance plumbing, so when funds reduce risk they liquidate correlated positions. Gold, a traditional physical safe haven, was bought directly as a hedge against tariff-driven inflation, creating the divergence.
Does this mean Bitcoin is not an inflation hedge?
Not necessarily. In the short term, Bitcoin can be driven by risk sentiment and liquidity. Over the medium to long term, Bitcoin’s capped supply and low issuance rate make it structurally disinflationary compared with gold, potentially attractive in a higher-inflation environment.
How worried should miners selling be?
Miner selling increases short-term supply pressure but must be evaluated contextually. Miners selling reserves may be raising cash for operations or deleveraging. If selling is wide and sustained across many miners, it is a bearish signal; isolated selling by single large miners is concerning but not necessarily game-ending.
Are ETF outflows a sign that institutions are abandoning Bitcoin for good?
Not necessarily. Current outflows appear driven largely by hedge funds and basis trades being unwound. ETF holdings still represent tens of billions in sticky, long-term capital inside retirement and institutional allocations that are less likely to panic-sell over a 150-day tariff.
What indicators should I watch next?
Monitor stablecoin supply, ETF flows, miner reserve movements, Core PCE inflation prints, and T-bill issuance. These provide a timely read on liquidity and macro pressure that historically precede major moves in Bitcoin.
How can I act on opportunities while managing risk?
Use position sizing, stop-losses, and staggered entries. For active traders, disciplined signals—especially those that combine macro context with on-chain and liquidity indicators—can reduce emotional decision making. Consider tools like cryptocurrency trading signals to receive structured trade ideas and risk parameters in volatile markets.
