

Table of Contents
- Why this combination
- What you need and how to set it up
- Core idea: mean reversion
- Entry rules (clear and repeatable)
- Why the RSI threshold is important
- Key caveat: avoid trading during sideways, low-volatility regimes
- Using divergence to improve timing
- Trade management and practical tips
- Common mistakes to avoid
- FAQ
Why this combination
This strategy blends two simple, reliable tools to catch price moves back to the mean: Bollinger Bands to identify extreme price excursions and dynamic support and resistance, and RSI to filter out false signals by requiring genuine momentum extremes. Used together they produce clear, low-latency entries that work across stocks, forex, crypto, and futures when applied with proper risk management.
What you need and how to set it up
Open your favorite charting platform (TradingView recommended) and add these two indicators with the following settings.
- Bollinger Bands
- Length: 30
- Standard deviation: 2
- Optional: remove background shading for a cleaner look
- Relative Strength Index (RSI)
- Length: 13
- Upper band: 70
- Lower band: 30
These settings widen the band slightly and tune RSI sensitivity so the indicators work well together on many timeframes.
Core idea: mean reversion
“Mean reversion just means returning to the average.”
The goal is simple: when price moves sharply away from the moving average (the middle Bollinger line), it often reverts back. A push above the upper band signals an overextended rally; a move below the lower band signals an overextended selloff. But those alone produce many false alarms. That is where RSI confirmation comes in.
Entry rules (clear and repeatable)
- Long entry
- Price dips below the lower Bollinger Band.
- RSI drops below 25 (extreme oversold).
- Enter when RSI shows oversold and price is below the lower band with an appropriate stop and position size.
- Short entry
- Price breaks above the upper Bollinger Band.
- RSI rises above 75 (extreme overbought).
- Enter on the overbought RSI confirmation while price is above the upper band.
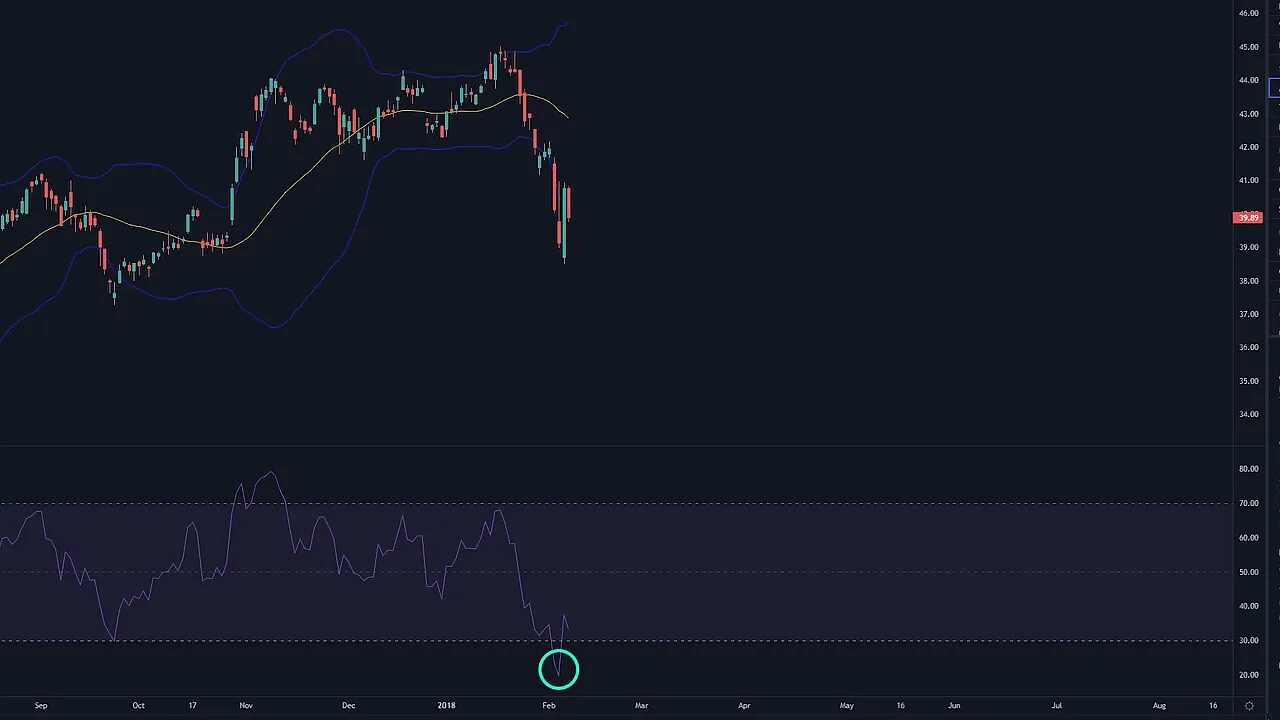
Example: when Apple’s price dropped below the lower band and RSI fell under 25, the setup triggered and price reverted back to the moving average, offering a high-probability long.
Why the RSI threshold is important
Using RSI extremes (25 and 75 rather than the usual 30 and 70) reduces false signals by requiring a stronger momentum imbalance before committing capital. This extra filter turns many mediocre setups into higher-probability trades.
Key caveat: avoid trading during sideways, low-volatility regimes
The strategy performs poorly when the market is range-bound and volatility collapses. Narrow, compressed Bollinger Bands signal these periods. During sideways action price can repeatedly dip below the lower band and keep trending lower, or break above the upper band and keep rising. Those are situations where entries based only on band touches and RSI may produce large losses.
Signs that the market is in a dangerous sideways phase:
- Bollinger Bands are very skinny and close together.
- RSI is stuck in a tame band and not reaching extremes.
- Price shows choppy, low-range candles without follow-through.
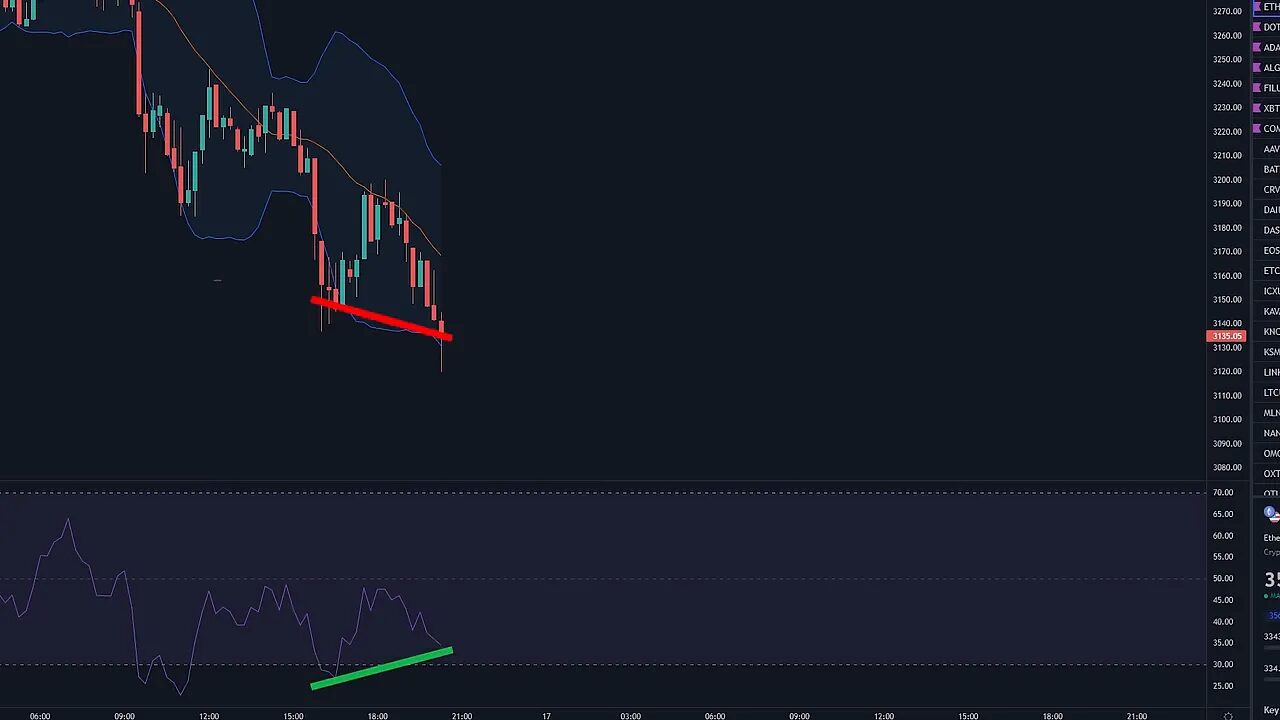
Using divergence to improve timing
Divergence between price and RSI is a powerful enhancement. Look for these setups:
- Price makes a lower low while RSI makes a higher low (bullish divergence) after RSI has been extreme and price touched or pierced the lower band. This increases the probability of a strong reversal.
- Price makes a higher high while RSI makes a lower high (bearish divergence) after RSI has been extreme and price touched the upper band.
When divergence appears in conjunction with the band/RSI extremes, the chance of price reversing back to the mean increases significantly.
Trade management and practical tips
- Always define a stop loss before entering. A reasonable stop is below the recent swing low for a long or above the recent swing high for a short.
- Use position sizing so a single loss does not meaningfully hurt your account.
- Consider taking partial profits near the middle Bollinger line and trailing the rest if momentum continues.
- Backtest this setup on multiple instruments and timeframes to understand its behavior. Not every market or timeframe will behave the same.
- Combine with higher-timeframe context: avoid countertrend entries against a strong higher-timeframe trend unless divergence is compelling.
Common mistakes to avoid
- Chasing every band touch. Wait for the RSI confirmation (25/75) or divergence.
- Trading during ultra-low volatility compression without extra confirmation.
- Using the wrong indicator settings. Stick to BB length 30 and RSI length 13 for this specific method unless you have tested alternatives.
FAQ
What indicator settings should I use for this strategy?
Set Bollinger Bands to length 30 with standard deviation 2. Set RSI to length 13 with upper band 70 and lower band 30. For entries use RSI extremes of 75 for shorts and 25 for longs.
When exactly should I enter a long or short?
Enter a long when price dips below the lower Bollinger Band and RSI drops below 25. Enter a short when price rises above the upper band and RSI exceeds 75. Look for divergence as an additional confirmation.
How do I avoid losing trades during sideways markets?
Watch the band width and RSI behavior. If bands are very narrow and RSI is muted, avoid trades or wait for a confirmed breakout with momentum. Use divergence to filter entries when the market shows signs of exhaustion.
Can this strategy be used across different assets and timeframes?
Yes. It can be applied to stocks, forex, crypto, and futures. However, results vary by timeframe and instrument. Backtest and paper trade to find the best timeframes for your style and risk tolerance.
