

Table of Contents
- Why Fibonacci works as a trading guide
- What Fibonacci retracement levels tell you
- How to set up the Fibonacci retracement tool on TradingView
- How to draw Fibonacci the right way
- Reading the levels and placing a trade
- Confluence increases the probability
- Practical trade rules to follow
- Key takeaways
- FAQ
Why Fibonacci works as a trading guide
Fibonacci is a simple number sequence that shows up across nature and price charts alike. In trading, the Fibonacci retracement tool helps identify likely pullback zones where price tends to pause or reverse. Used correctly, it points to areas where buying or selling pressure is most likely to produce a new higher high or a fresh leg down.
What Fibonacci retracement levels tell you
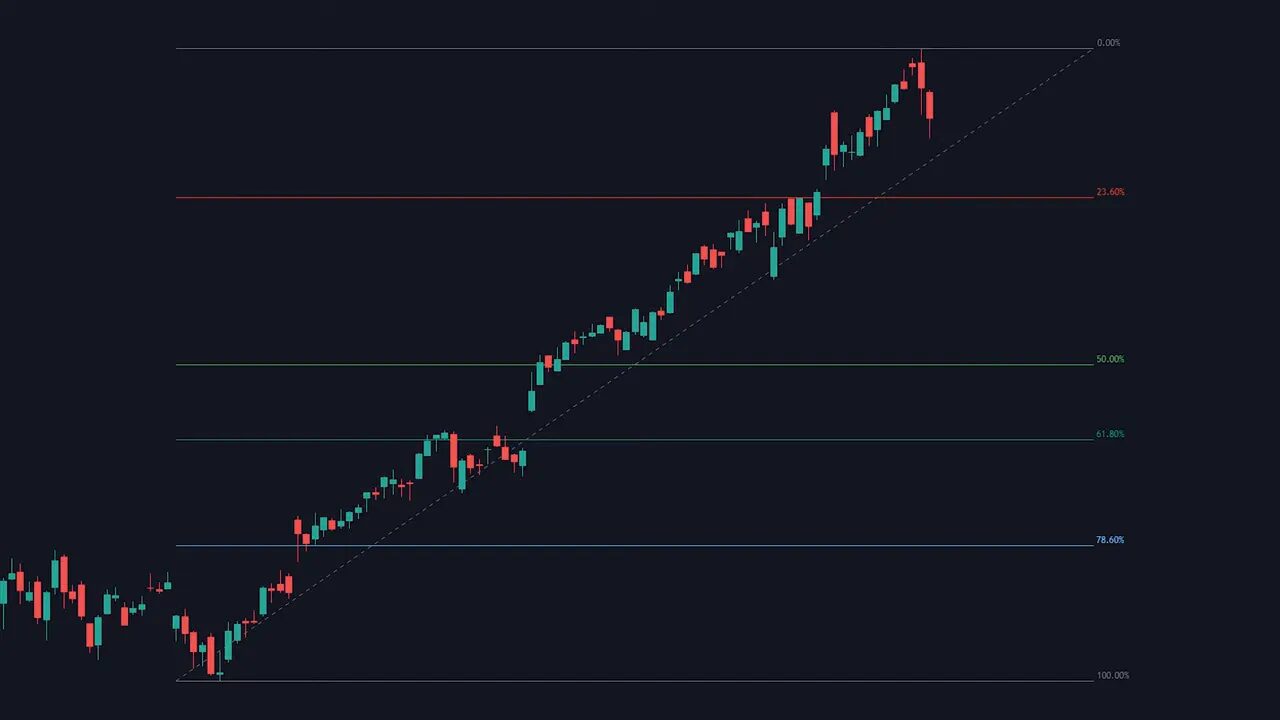
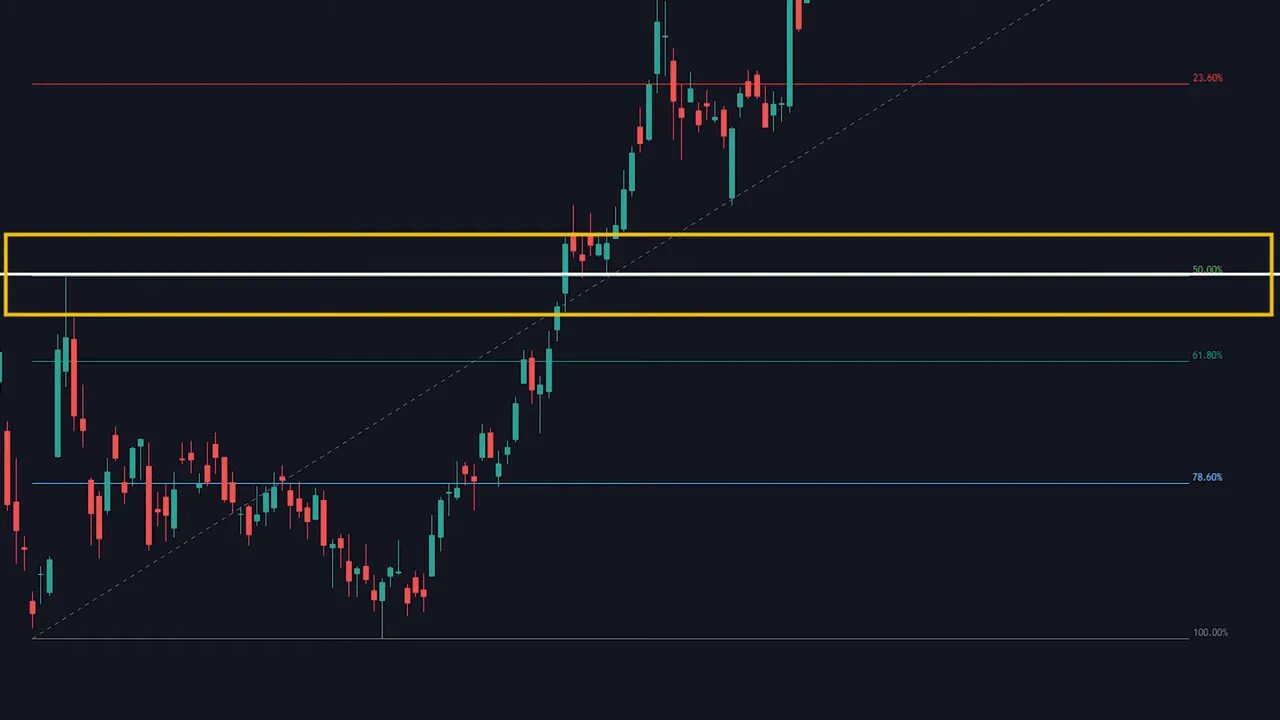
When you draw a Fibonacci retracement from a swing low to a swing high, the tool plots percentage levels that represent likely pullback zones. The common levels to watch are 23.6%, 50% and 61.8%. Traders often call the area between 23.6% and 61.8% the golden zone, where bounces or reversals are most probable.
Think of these lines as areas of support or resistance, not exact price pins. A brief breach does not always mean the level is broken. Also remember this rule: if price drops below the 100% line (the original swing low), the move often transitions from a pullback into a downtrend.
How to set up the Fibonacci retracement tool on TradingView
These settings keep the chart clean and make levels easier to read.
- Open TradingView and select the Fibonacci retracement tool.
- Uncheck the 0.382 level and any boxes after 1.0 so only the core levels remain.
- Turn off the background and prices to avoid clutter.
- Change level labels from values to percents and move labels from left to right.
How to draw Fibonacci the right way
Follow this simple checklist every time you use the tool:
- Find a clear trend with a visible swing low and swing high.
- Always snap to the wick when you place the tool — not the candle body. The wick shows the true extreme of price action.
- Drag from the swing low up to the swing high for an uptrend (or from high to low for a downtrend).
Reading the levels and placing a trade
After drawing your retracement, watch how price reacts at the levels. A few practical rules to use:
- Treat each Fibonacci line as an area of interest. Wait for price to show respect.
- Never enter immediately when price touches a line. Look for confirmation candles moving in your trade direction.
- Place a stop loss just beyond the level you are using as support or resistance.
Long example — entering and managing a trade
Draw from the swing low to swing high and wait. Price may retest the top 0% several times before pulling back to a lower Fibonacci level, such as 23.6%.

Once you see a bullish confirmation candle at 23.6%, consider entering with a stop loss right below that area. A solid management approach is to scale out as price hits higher levels: sell half at the previous high (0%) to lock in profit, then trail your stop higher or raise it to protect gains when price breaks the prior high and confirms continuation.
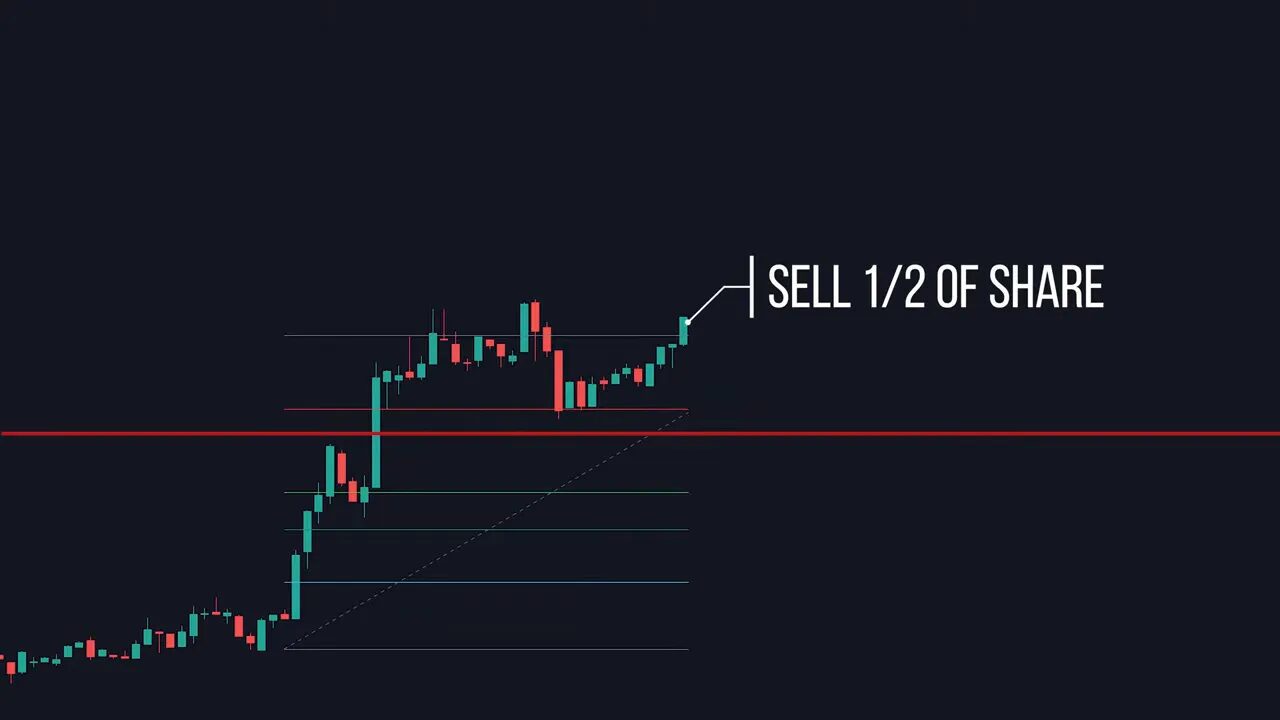
Raising your stop beneath the confirmed breakout protects your remaining position while allowing upside if the move accelerates.
Short example — using Fibonacci to short and scale out
When price tries and fails to hold above a Fibonacci level, a short setup can form. Watch for failed retests and confirmation candles rejecting a level.
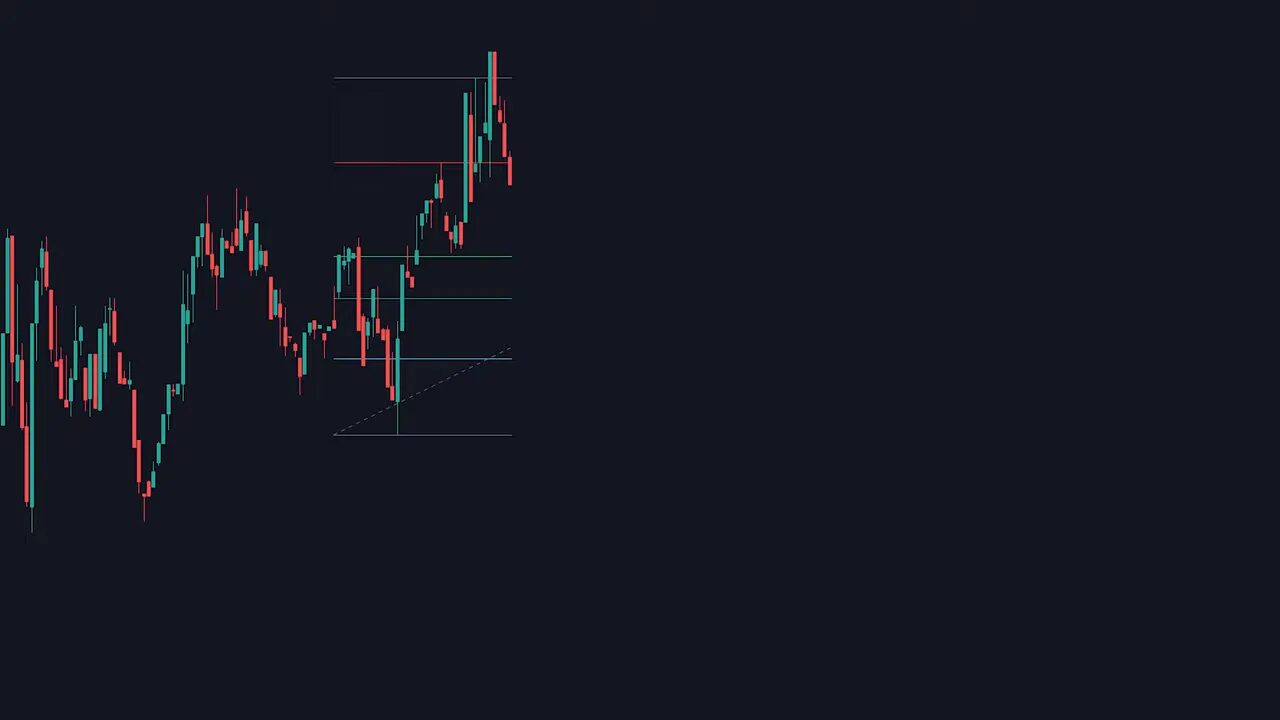
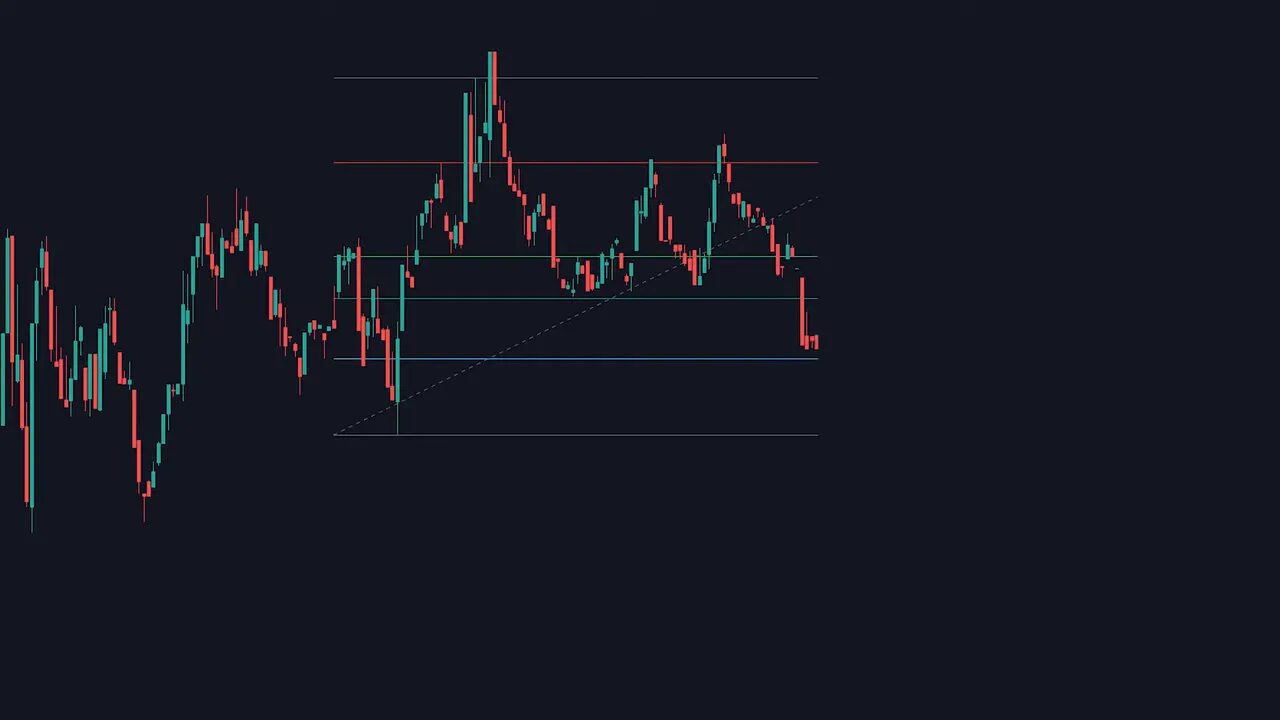
Scale out of the short position as price hits lower Fibonacci levels. A practical example:
- Sell about 25% at the 50% line.
- Sell another 25% at 61.8% once the level shows respect.
- Sell another 25% near 78.6% if price loses momentum.
- Keep a final portion for large moves beyond the 100% break, but protect it with a stop or trailing stop.
Confluence increases the probability
When a Fibonacci level lines up with a higher-timeframe support or resistance, the level becomes much stronger. That overlap significantly improves the odds that price will react there. Always scan daily or weekly levels for confluence before committing large size.
Practical trade rules to follow
- Treat levels as areas, not exact lines.
- Wait for confirmation (candles that show rejection or acceptance of the level) before entering.
- Scale out of positions to lock in profits as levels are hit.
- Use higher-timeframe confluence to improve trade quality.
- Place stops outside the wick extremes used to draw your retracement.
Key takeaways
- Fibonacci retracement levels are a powerful guide for finding pullback zones, but they are not precision lines.
- Always draw to the wick of swings and use clean chart settings for clarity.
- Look for confirmation before entering trades and scale out of positions at successive Fibonacci levels.
- Combine Fibonacci levels with daily support and resistance for higher probability setups.
FAQ
What settings should I use for the Fibonacci retracement on TradingView?
Uncheck the 0.382 level and any levels after 1.0, turn off the background and prices, change labels to percent, and move labels to the right. This keeps the chart clean and highlights the key levels to watch.
Should I draw Fibonacci to the candle wick or the candle body?
Always draw to the wick. Wicks represent the true extremes of price action and give more accurate retracement areas than candle bodies.
Which Fibonacci levels are most important?
The most commonly watched levels are 23.6%, 50%, and 61.8%. The golden zone typically refers to the area around 23.6% through 61.8% where reversals are most likely.
How should I manage stops and exits when trading with Fibonacci?
Place stops just beyond the Fibonacci area you are trading from. Use confirmation candles for entry, scale out of your position as successive levels are hit to lock in profit, and trail stops to protect remaining gains when price breaks higher or lower.
Can Fibonacci truly predict market bottoms or tops?
Fibonacci levels provide areas of interest and likely reaction zones, not exact forecasts. They work best when combined with confirmation candles, price structure, and higher-timeframe support or resistance for confluence.
