

Table of Contents
- What the RSI actually measures
- Why the typical 70/30 overbought-oversold approach fails
- Simple tweaks to make the RSI useful
- How to use multi-timeframe confirmation
- Price action confirmation: the final quality gate
- Where to take profits
- Use RSI as a strength indicator for pullbacks
- Which markets and timeframes work best
- Checklist before entering an RSI trade
- Final tips
- FAQ
What the RSI actually measures
The Relative Strength Index is a momentum oscillator that measures the speed and change of price over a set number of bars. It oscillates between 0 and 100 and, despite its fame, many traders use it the wrong way. The indicator was designed to measure strength, not to be blindly treated as a simple overbought/oversold trigger.
Why the typical 70/30 overbought-oversold approach fails
Most traders drop the RSI onto a chart and assume that readings above 70 mean “overbought” and readings below 30 mean “oversold.” That can sometimes work, but often the market keeps trending and gets even more extreme. The result is a lot of losing trades from early mean reversion plays.
Every indicator gives false signals. The goal is to reduce them by improving signal quality so the signals you do trade are more likely to win.
Simple tweaks to make the RSI useful
Two small changes dramatically improve the RSI’s usefulness.
- Change the overbought/oversold thresholds from 70/30 to 80/20. This reduces the number of signals and filters out weaker setups so the signals you keep are stronger.
- Confirm RSI signals on higher timeframes. If your lower timeframe shows an extreme, check the next higher timeframe. If the higher timeframe is not confirming, skip the trade.
How to use multi-timeframe confirmation
Example workflow:
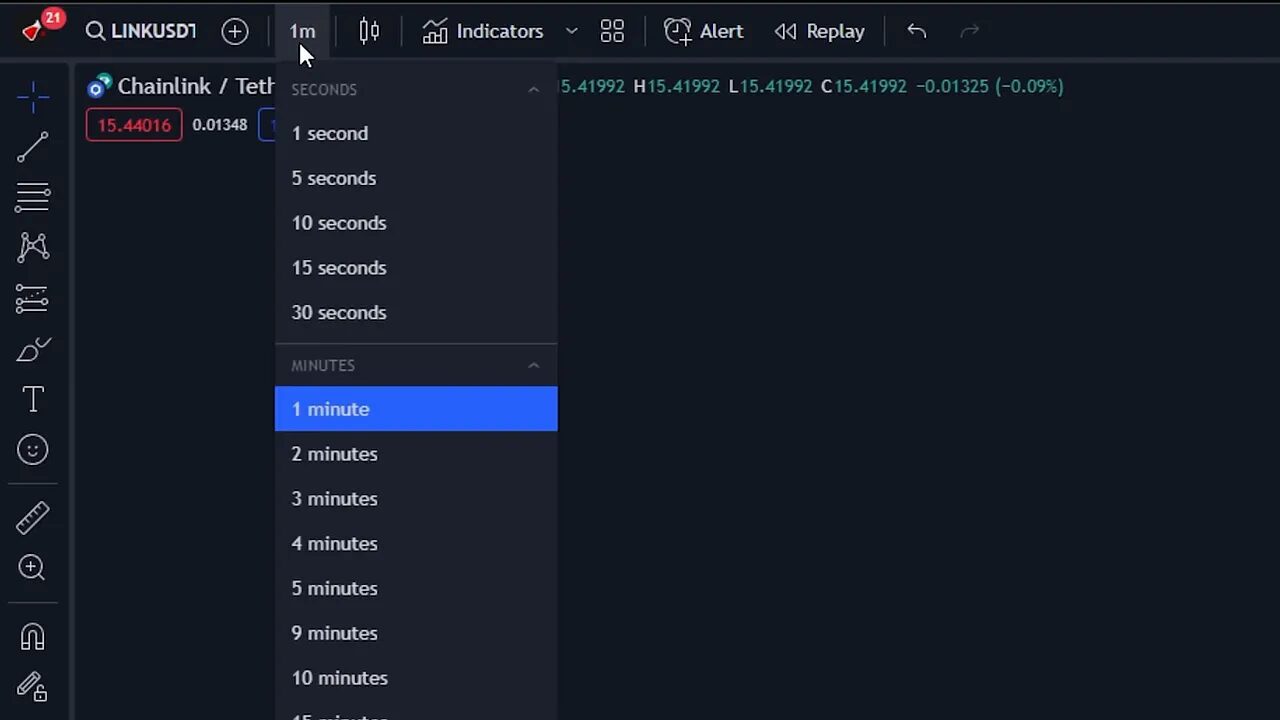
- Spot an RSI extreme on your execution timeframe (for example the 1-minute).
- Check the 5-minute and 15-minute RSI. If both are also at or beyond your threshold, the signal is stronger.
- If the higher timeframes do not confirm, wait.
Price action confirmation: the final quality gate
Even with 80/20 and higher-timeframe confirmation, you still need a price-action trigger to enter. One clean, high-probability method is the double-bar break:
- Identify two consecutive candles showing hesitation (weak bars).
- Enter immediately when price breaks the low (for shorts) or the high (for longs) of both bars. There is no need to wait for candle close once the break occurs.
- Set the stop loss above the confirming bar (for shorts) or below it (for longs).
Where to take profits
There are multiple valid approaches. Here are two that work well together:
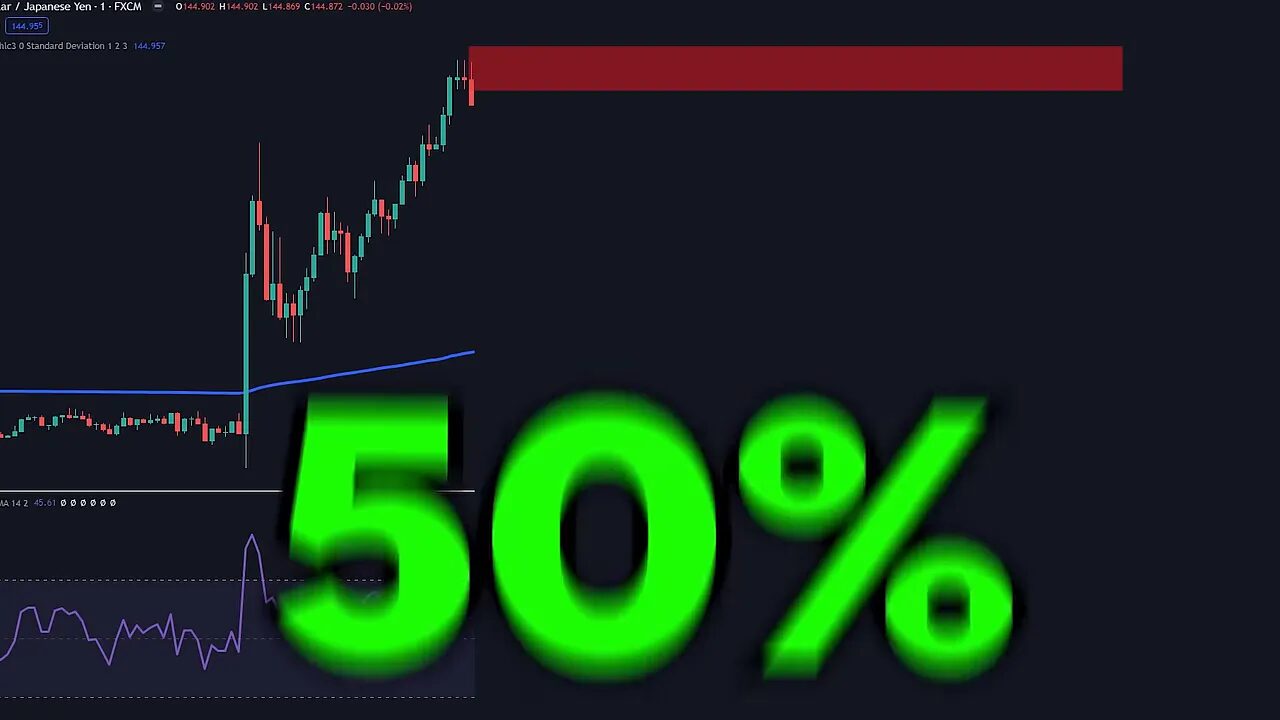
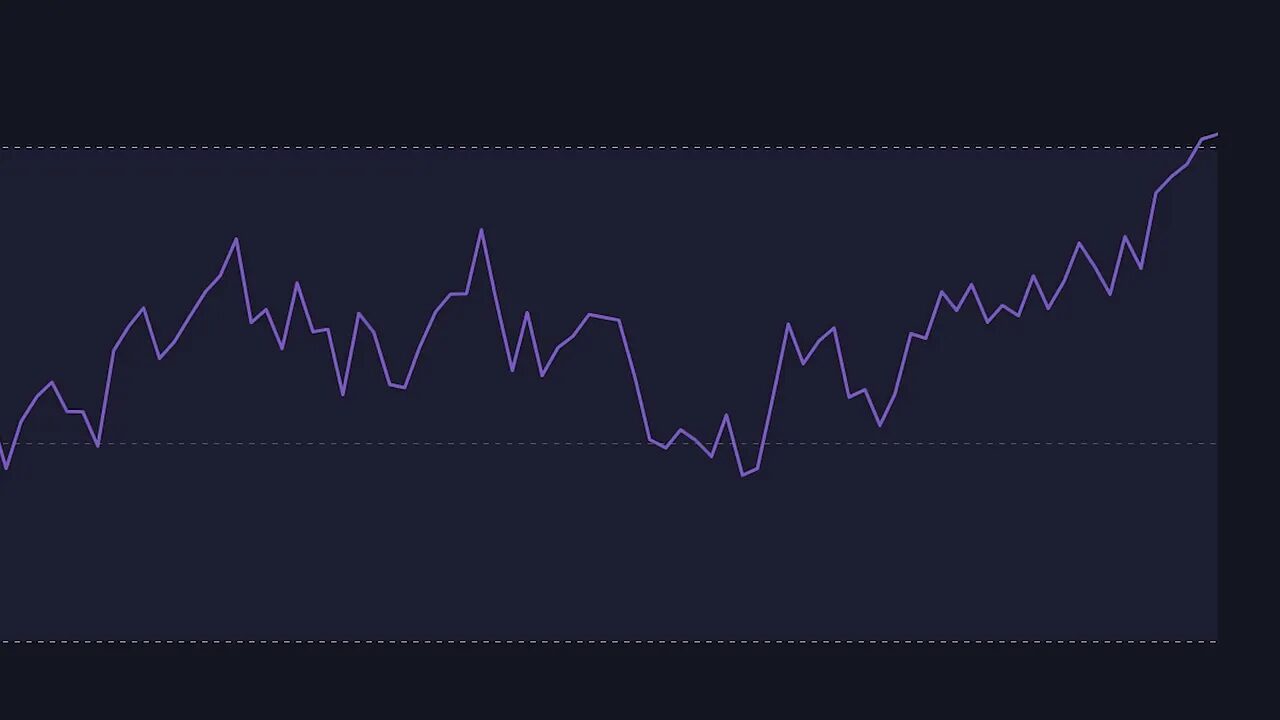
- Take partial profits (for example 50%) when the RSI returns to the midline (around 50). The RSI moving from extreme back to the midline is often a sign the momentum leg is cooling.
- Take the remaining profits at a structural level such as the VWAP. Adding VWAP to the chart gives you an objective second target.
Use RSI as a strength indicator for pullbacks
Arguably the RSI’s best use is spotting strength in trending markets rather than forcing mean reversion trades.
Pattern to trade:
- Identify a clear trend. The RSI should live in an upper quadrant (roughly 50 to 80) for bull trends, or in a lower quadrant for bearish trends.
- Wait for the RSI to drop to the midline (around 50). This is typically a pullback inside a strong trend.
- Enter when price/price action confirms the bounce off the midline. Combine this with price action signals (pin bars, double-bar breaks, bullish engulfing, etc.).
Which markets and timeframes work best
This approach works best in trending markets. If price is chopping sideways, the RSI will bounce between extremes and the pullback strategy will fail. Use higher timeframe context to confirm trend direction before hunting setups on lower timeframes.
Checklist before entering an RSI trade
- RSI threshold is at 80/20 (or other tightened level).
- Higher timeframe confirmation. The next timeframe or two align with the signal.
- Price action trigger (double-bar break or another setup) has occurred.
- Stop loss placed above/below the confirming bar.
- Profit plan defined (partial at RSI midline, rest at VWAP or structure).
Final tips
Small changes create big differences. Tightening the RSI thresholds and adding multi-timeframe and price action confirmation reduces false signals and increases trade quality.
Combine the RSI-as-strength approach for pullbacks with price action rules and objective targets like VWAP and you will be trading higher-probability setups instead of guessing mean reversions.
FAQ
What RSI settings should I use instead of the default 70/30?
Try 80/20 to reduce weaker signals. The tighter thresholds give fewer but higher-quality signals. Adjust slightly to suit the asset and timeframe.
Do I always need higher timeframe confirmation?
Yes. Checking one or two higher timeframes helps filter out false signals and ensures you are trading with the dominant momentum.
How do I combine RSI signals with price action?
Look for a price-action trigger such as a double-bar break, pin bar, or rejection candle. Enter on the break of the confirming structure and place your stop just beyond it.
Should I wait for candle closes before entering?
Not always. With a clear break of the confirming bars you can enter immediately. Waiting for close can cause missed opportunities in fast markets, but use discretion depending on your edge.
Where should I take profits when trading RSI signals?
Common approach: take partial profits when RSI returns to the midline (around 50) and take the remainder at VWAP or a nearby structural support/resistance level.
