
")
Table of Contents
- Introduction
- What Heikin Ashi actually shows and why it helps
- Three simple rules to identify a trend
- Spotting reversals with the doji setup
- Combine Stochastics for higher-probability entries
- Step-by-step Heikin Ashi Trading Strategy
- Risk management and practical tips
- FAQ
Introduction
The Heikin Ashi Trading Strategy cuts through market noise and makes trend identification far easier. By comparing real-time candles to Heikin Ashi candles and adding one momentum filter, you can spot strong trends and high-probability reversals without getting shaken out by every pullback.
What Heikin Ashi actually shows and why it helps
Heikin Ashi means average bar in Japanese. Instead of plotting raw price candles, it smooths price action into averaged bars so trends look cleaner. That smoothing makes it easier to see sustained buying or selling pressure because small pullbacks and chop get filtered out.
Always remember: Heikin Ashi is an averaged view of price, not the live price itself. Use it together with the real-time candles so you know current price levels while reading the smoothed trend on Heikin Ashi.
Three simple rules to identify a trend
Use these rules to declare a Heikin Ashi trend:
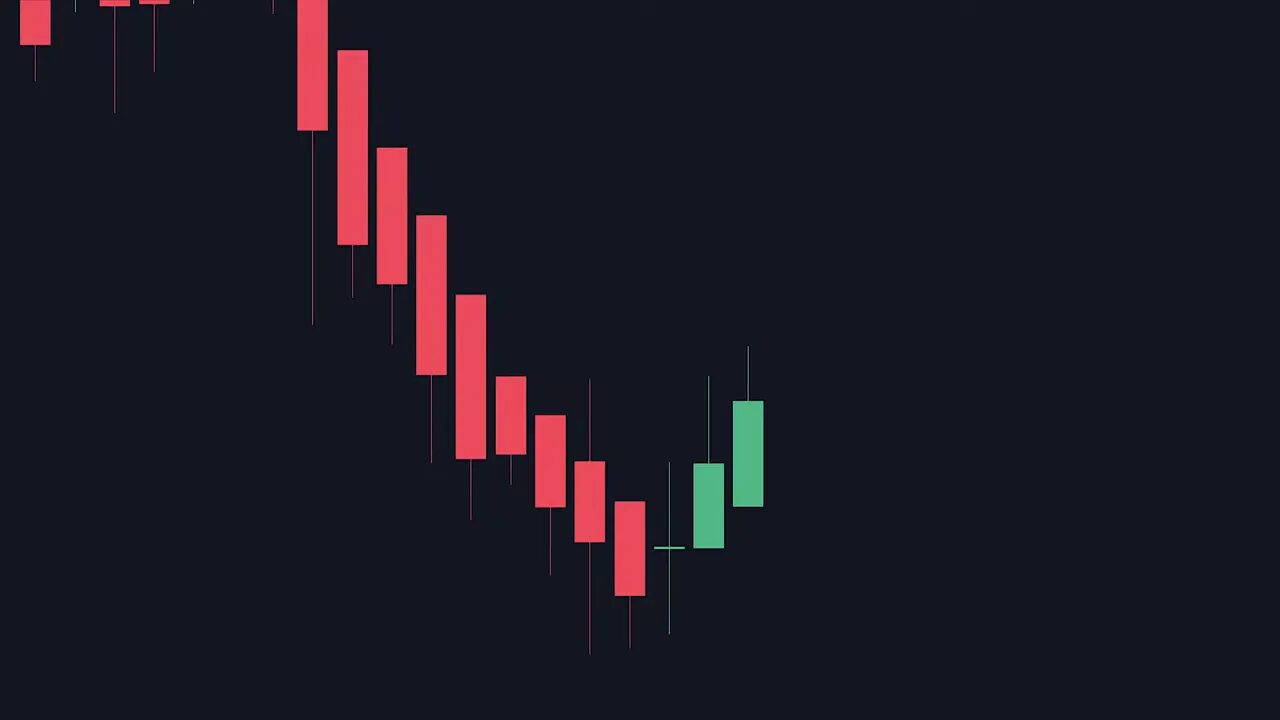
- Uptrend: Heikin Ashi candles are green, have large bodies, and show no lower wicks.
- Downtrend: Heikin Ashi candles are red, have large bodies, and show no upper wicks.
- No trend / weak momentum: Small bodies or candles with wicks on both sides indicate loss of momentum or chop.
These three visual cues let you stay in strong moves and avoid reacting to every red pullback during an uptrend or every green bounce during a downtrend.
Spotting reversals with the doji setup
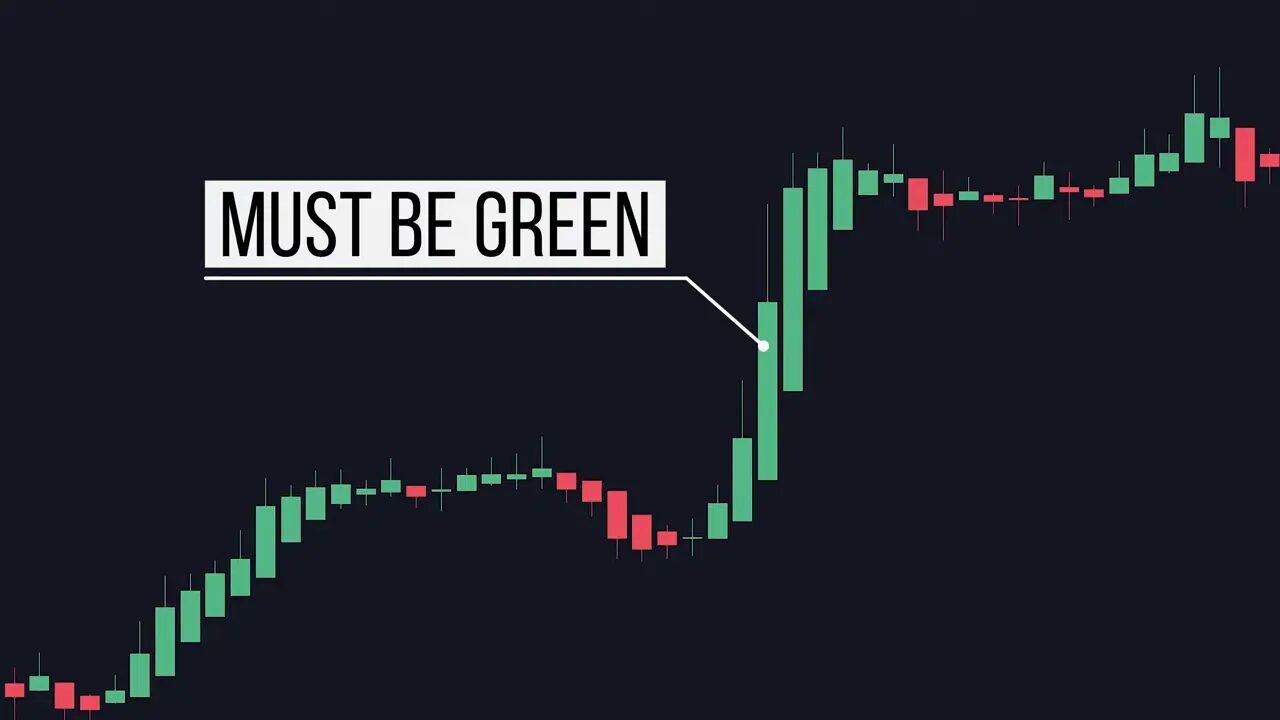
The clearest reversal signal on Heikin Ashi is a doji bar: a small-bodied candle with wicks on both sides. Use this as a trigger, not an entry. The entry comes after confirmation.
Entry rules for a reversal:
- Wait for a Heikin Ashi doji that appears during the losing momentum of the prior trend.
- Then wait for two candles in the opposite direction that have large bodies and only a single wick on the far side (for longs: two green candles with only upper wicks; for shorts: two red candles with only lower wicks).
- Ignore candles that have wicks on both sides when counting confirmations.
When the second confirming candle appears, that is your entry signal. This method reduces false flips and gives you a disciplined way to capture reversals.
Combine Stochastics for higher-probability entries
Adding the Stochastics oscillator helps time entries within weak momentum phases. Think of Stochastics like an RSI cousin: readings below the lower band indicate oversold conditions, and readings above the upper band indicate overbought conditions.
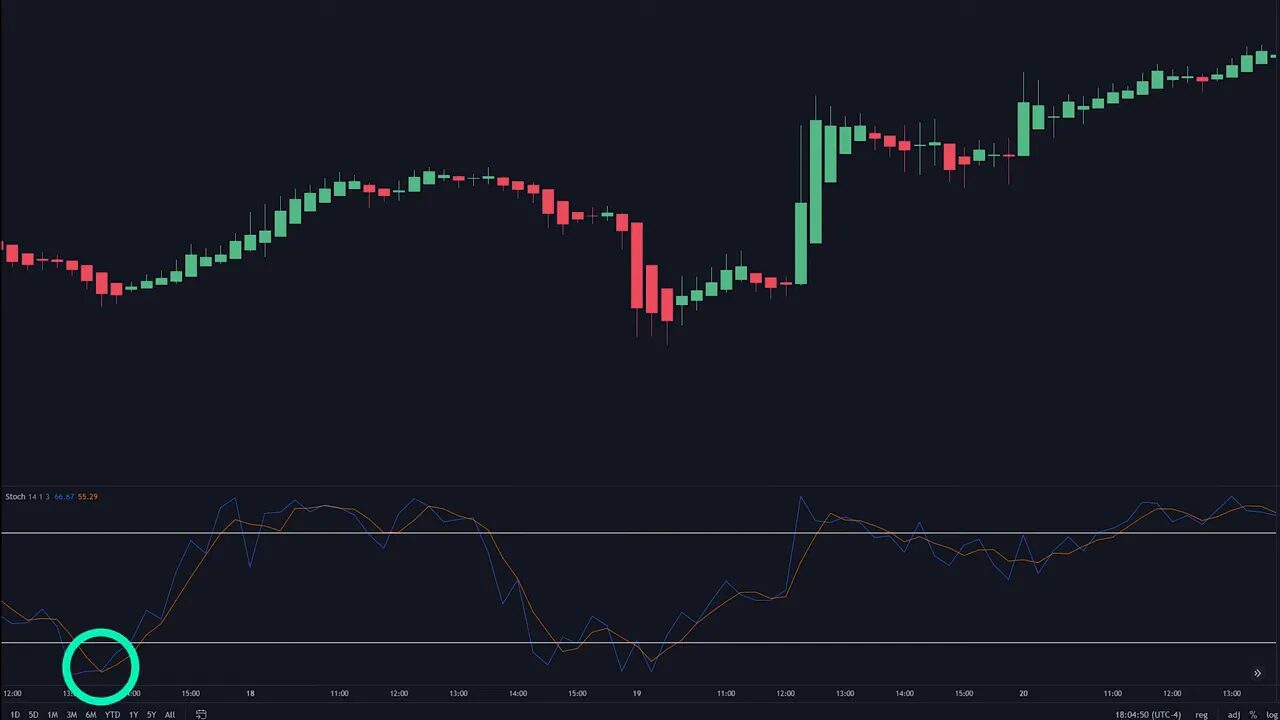
How to combine them:
- For longs, look for Stochastics crossing below the lower band during a weak down move, then follow the doji + two-candle Heikin Ashi confirmation.
- Avoid entries when Stochastics shows strong momentum in the same direction as the prior move. Weak momentum plus oversold Stochastics creates the best reversal odds.
When trading crypto markets, pairing this approach with our free crypto signals can help you quickly find coins showing the right chain-level momentum and volatility. Use signals to pre-filter candidates, then apply the Heikin Ashi Trading Strategy and Stochastics for precise timing.
Step-by-step Heikin Ashi Trading Strategy
- Open price and Heikin Ashi panels together on your charting platform.
- Identify trend using the three rules for Heikin Ashi candles.
- When momentum fades, wait for a Heikin Ashi doji.
- Confirm with two opposite-direction Heikin Ashi candles that have single-side wicks as described.
- Check Stochastics: prefer oversold/overbought crosses that align with your intended reversal trade.
- Enter on the second confirming candle. Set stop below the recent structure for longs or above for shorts. Manage risk per trade size rules.
Risk management and practical tips
- Use position sizing so a stop loss is a small percentage of your account.
- Prefer this strategy on timeframes that match your trading style. It works on multiple timeframes, but the same rules must be respected.
- Do not chase trades when momentum is strong in the prior direction; wait for the doji confirmation sequence.
- Backtest the setup on historical data and paper trade until you gain confidence.
- For traders watching multiple blockchains, free crypto signals help filter pairs with ideal liquidity and trend setups before applying the Heikin Ashi rules.
FAQ
What is the difference between Heikin Ashi candles and regular candlesticks?
Heikin Ashi candles are averaged bars that smooth price action to highlight trends. Regular candlesticks display raw open, high, low, and close prices. Use Heikin Ashi to read trend clarity and real candles to see exact price levels.
How do I confirm a reversal using this strategy?
Look for a Heikin Ashi doji, then wait for two opposite-direction candles with single-side wicks. Add a Stochastics crossing in oversold or overbought territory to increase the probability of success.
Which timeframe works best for the Heikin Ashi Trading Strategy?
The strategy works across timeframes. Shorter timeframes require faster execution and stricter risk management. Longer timeframes offer higher-probability signals but fewer trades. Test and choose what matches your style.
Can I use this strategy for crypto markets?
Yes. Many traders pair this approach with pre-filtering tools like free crypto signals to find coins with momentum and liquidity, then apply Heikin Ashi and Stochastics for timing entries and exits.
Are there common mistakes to avoid?
Common mistakes include entering before the second confirm candle, trading against strong momentum, and ignoring stop loss discipline. Patience and rule-based execution are essential.
Use these simple rules and filters consistently. The Heikin Ashi Trading Strategy removes noise, gives clear visual cues, and—when combined with a momentum filter like Stochastics—creates a disciplined approach to capturing trends and reliable reversals.
