

Table of Contents
- Why level 2 matters
- Level 1 versus level 2: the foundation and the detail
- How the level 2 screen is organized
- Reading control: how to tell if buyers or sellers are winning
- Use order book structure to identify support and resistance
- Volume and momentum: reading the tape like a money counter
- Applying level 2 to crypto and cross-market trading
- Putting it together: a simple breakout checklist
- Practice tips and mindset
- FAQ
- Final thoughts
Why level 2 matters
Level 2 market data gives you a live lens into a stock’s liquidity, showing supply and demand, likely support and resistance, and pending orders before they execute. Traders who use level 2 can spot impending breakouts, detect when buyers are losing interest, and see when sellers are taking control. If you want an edge in short-term trading, learning to read level 2 should be part of your toolkit.
Level 1 versus level 2: the foundation and the detail
Level 1 is the basics: bid price, bid size, ask price, ask size, last price, and last size. Think of level 1 as an outline that tells you where the market currently sits.
Level 2 expands that outline into a detailed map. It shows multiple bid and ask levels across different exchanges, order sizes at each price, and lets you see which side—buyers or sellers—has more presence at a glance.
How the level 2 screen is organized
Bids and asks
The level 2 screen typically has two columns. The left column lists the bids (buyers) and the right column lists the asks (sellers). The top of each column shows the best bid and best ask—the highest price buyers will pay and the lowest price sellers will accept at that moment.
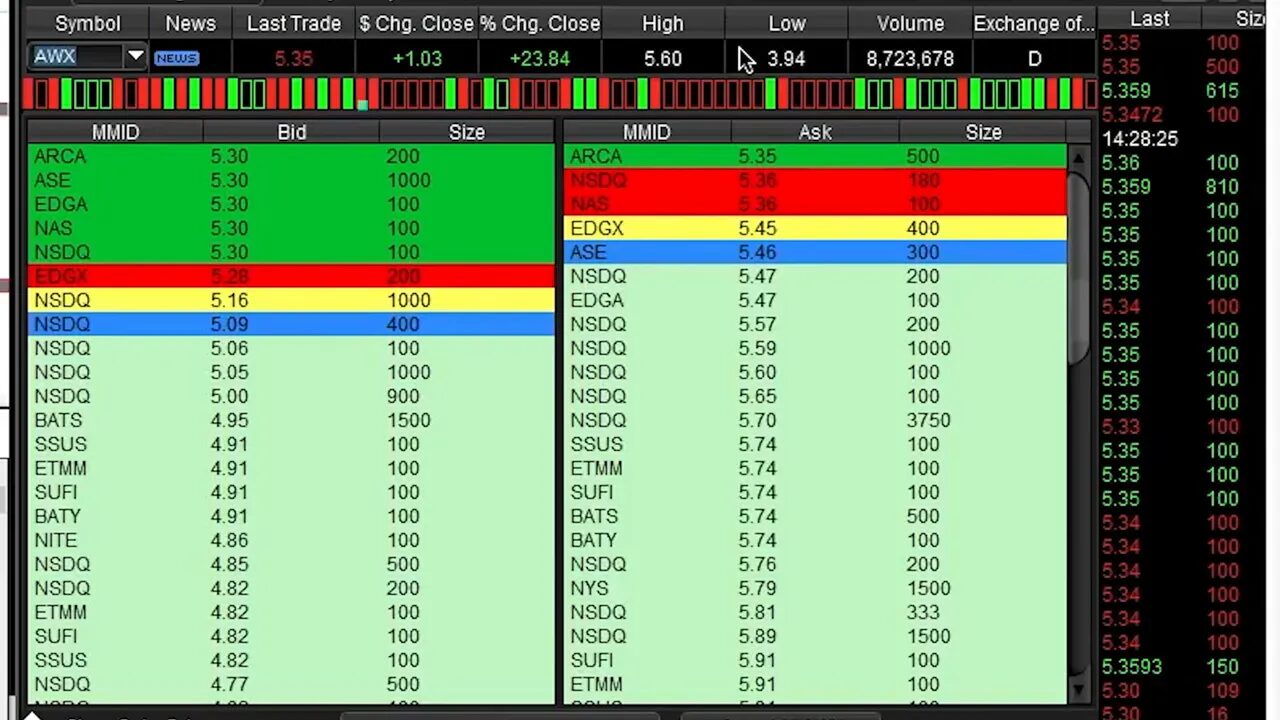
Exchange codes and order sizes
Letters next to orders are abbreviations for exchanges, so you can see where each order is routed from. The numbers are order sizes—the number of shares traders want to buy or sell at each price. Remember, these are limit orders and are pending until they fill.
Time and sales: the live tape
Time and sales, or the tape, shows orders as they fill in real time. Colors matter: green typically indicates a buy print, red a sell print, and gray prints inside the spread. It’s not just the prices you want to watch but the speed and color flow—these reveal the momentum behind a move.
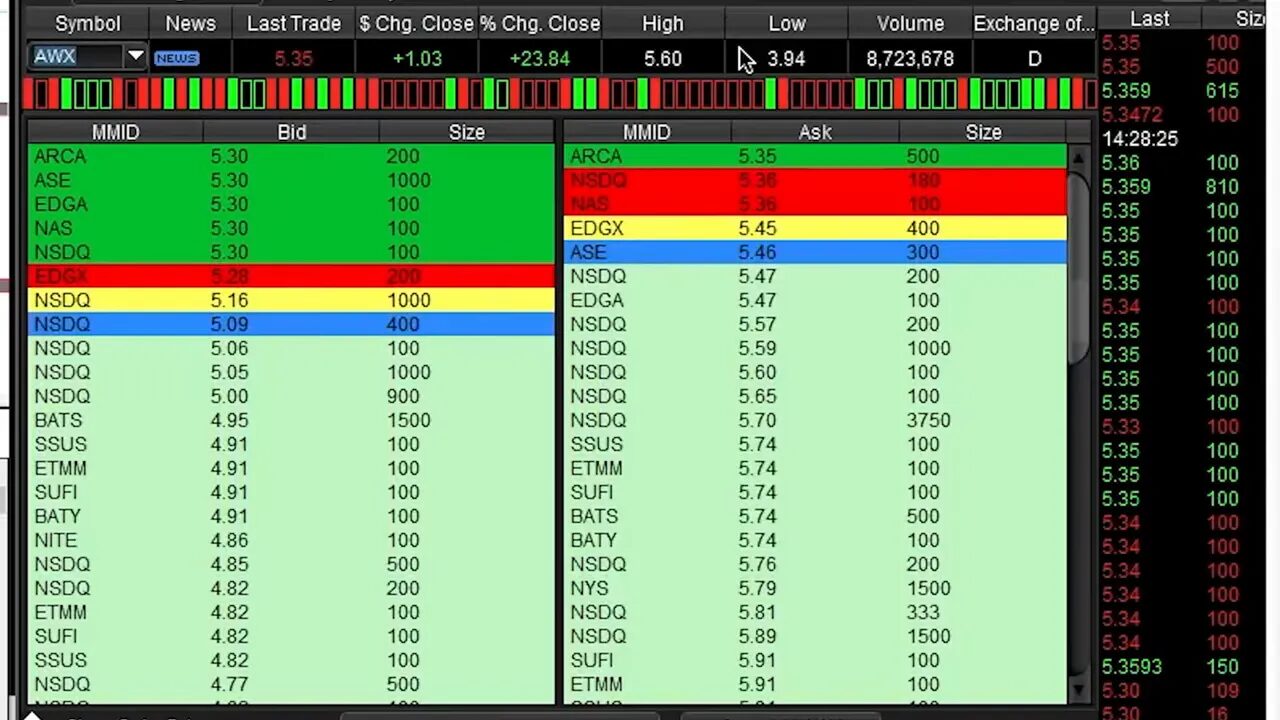
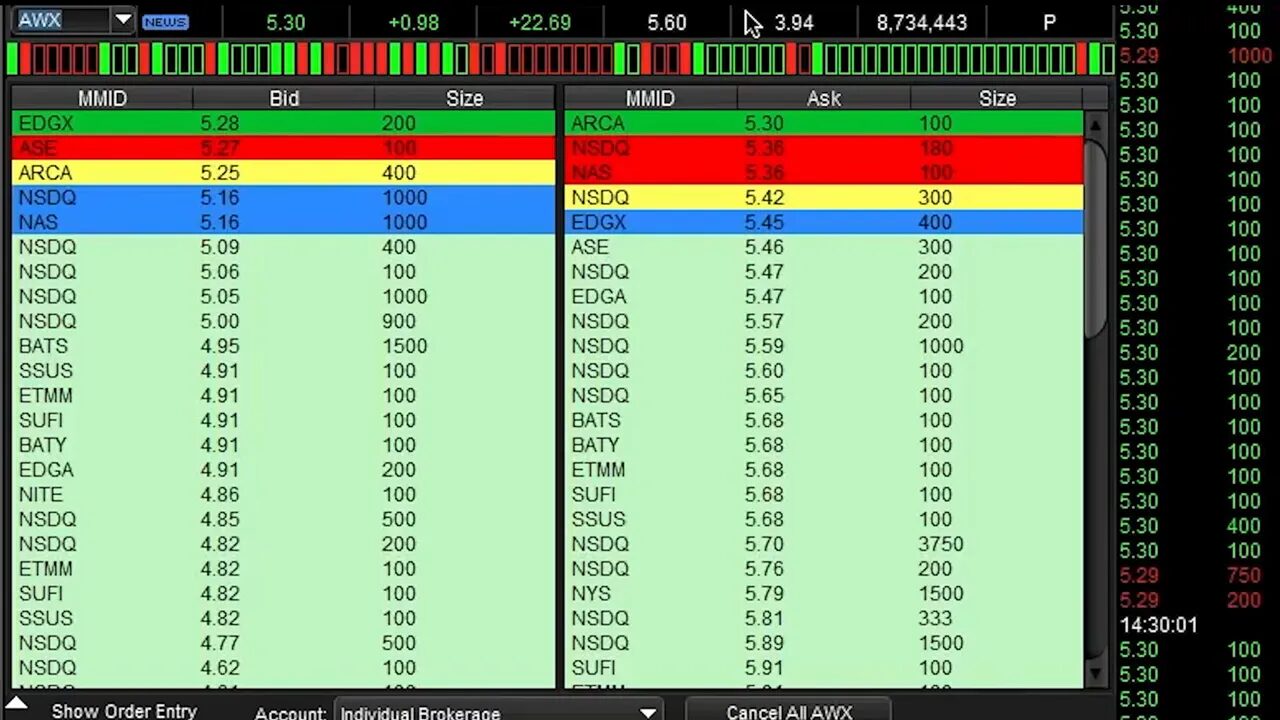
Reading control: how to tell if buyers or sellers are winning
Level 2 is most powerful when used around key support and resistance levels. Suppose price approaches a previous high at 5.30 and you want to know if it will break out. Look at the level 2 at that exact price.

If you see multiple buyers stacked at 5.30 from different exchanges (the level 2 often colors those blocks the same), that shows buying interest at that level. Traders call this “stacking”—multiple bids concentrated at one price. Seeing five bids vs one ask at a resistance level increases the chances of a breakout.
Stacking is not the whole story: size matters
Stacking shows the number of orders, but order size shows the weight behind them. Five bids of 100 shares each are not the same as a single sell order of 10,000 shares. The bigger order can act like a wall that needs to be absorbed before the price can move higher. When planning a long entry, prefer large stacks on the bid side and small stacks on the ask side. For shorts, the reverse applies.
Use order book structure to identify support and resistance
Big bid sizes far below the current price often mark strong support—lots of buyers willing to step in if price drops. Similarly, huge ask sizes above the price can act as reliable resistance. The more shares behind a level, the more likely it will hold.
Volume and momentum: reading the tape like a money counter
Volume drives price. No volume, no movement. Use time and sales to read momentum: a fast stream of green prints is a live signal that buyers are aggressively taking liquidity and pushing price up. If the tape slows down at a resistance level, that hesitation often precedes a reversal.
Watch both the color mix and the speed. A rapid stream of buys, accompanied by increasing volume, is a stronger confirmation for a breakout than just stacked bids alone.
Applying level 2 to crypto and cross-market trading
Order book dynamics and time-and-sales patterns exist across markets, including crypto. On many crypto exchanges you can read depth charts and order books that act like level 2. Large limit orders on centralized exchanges can be used the same way to spot support and resistance, or potential liquidity walls.
For traders looking to combine order book reading with trade signals, using a reliable signal service that focuses on market structure and liquidity can help identify higher-probability setups. If you follow opportunities across multiple blockchains, a service offering the best crypto trading signals can save time by highlighting trades where order book data and momentum line up. Use those signals to prioritize setups where the tape and order sizes confirm the move.
Putting it together: a simple breakout checklist
- Identify the key resistance or support level on your chart.
- Check the level 2 at that exact price for stacking and order sizes.
- Compare bid sizes to ask sizes—who has more weight?
- Watch time and sales for fast, colored prints (green for buys, red for sells).
- Confirm with rising volume on the chart and a fast tape before committing.
Practice tips and mindset
Reading level 2 is a skill that improves with focused practice. Start by watching one symbol at a time. Learn to instantly spot who has control: buyers or sellers. Expect to feel overwhelmed at first; after enough repetition you will read the tape the same way you read candlesticks.
Speaking of candlesticks, being able to interpret candle patterns alongside level 2 data is a complementary skill that helps decide entries and exits with more confidence.
FAQ
What is level 2 market data?
Level 2 shows the market’s order book across multiple price levels and exchanges, listing limit buy and sell orders and their sizes. It provides more detail than level 1, which only shows the best bid and ask and last trade.
How does stacking at a price indicate a breakout?
Stacking refers to multiple orders concentrated at the same price across exchanges. If buyers are stacked at resistance, they provide buying pressure that can absorb sellers and push price through the level. Always weigh stack count against order size.
Can I rely on level 2 alone to trade?
Level 2 is a powerful tool but not foolproof. Combine order book data with time and sales, volume, and price action—such as candlestick patterns—for higher-probability decisions.
Do hidden orders or dark pools affect what I see on level 2?
Yes. Not all liquidity is visible on level 2. Some orders are hidden or matched in dark pools, so large visible orders may not tell the entire story. Use level 2 as one input among several.
Is level 2 useful for crypto trading?
Yes. Many crypto exchanges provide order book and trade feed data similar to level 2. Reading depth and trade prints on crypto markets can reveal liquidity walls and momentum. For traders managing multiple chains, pairing manual reading with curated trade alerts or the best crypto trading signals can surface the most actionable opportunities.
Final thoughts
Level 2 market data turns the market from a black box into a readable map of intent. It lets you see who is stepping up at key prices, how big those commitments are, and whether momentum supports a move. Learn the screen layout, focus on stacks and sizes, read the tape for speed and color, and combine everything with volume and price action. With practice, level 2 becomes one of the most useful tools in a trader’s arsenal.
