

Turning $10,000 into $1.1 million in a year sounds impossible until you study the process behind it. The core idea here is simple: use volatility bands as breakout triggers, but only take breakouts that have real momentum and clear context. The result is a high-probability setup that works especially well on fast timeframes when paired with volume and trend confirmation.
Table of Contents
- What is the LW Volatility Breakout Strategy?
- Why this combo works
- Indicator setup (optimized for 5-minute charts)
- Entry rules — how to take a trade
- Managing trades and common edge cases
- Secret trick: respect higher-timeframe support and resistance
- Quick trade walkthroughs
- Risk management and position sizing
- Frequently asked questions
- Final notes
What is the LW Volatility Breakout Strategy?
This approach centers on a volatility channel indicator called the Dungeon Channels and two confirmations: the Larry Williams Large Trade Index (LWTI) and a volume moving average. The Dungeon Channels provide a median line and upper/lower bands. Breakouts beyond those bands can signal strong directional moves, but only when supported by trend strength and genuine volume.
Why this combo works
- Dungeon Channels identify local mean and volatility extremes. The median acts like a magnet for price; the bands define the breakout thresholds.
- LWTI confirms the predominant short-term trend so you do not buy into weak, counter-trend pops.
- Volume with a moving average shows whether a breakout has real participation or is just noise from a quiet market.
Indicator setup (optimized for 5-minute charts)
These exact values were tested on a five-minute timeframe. If you use a different timeframe, adapt and backtest accordingly.
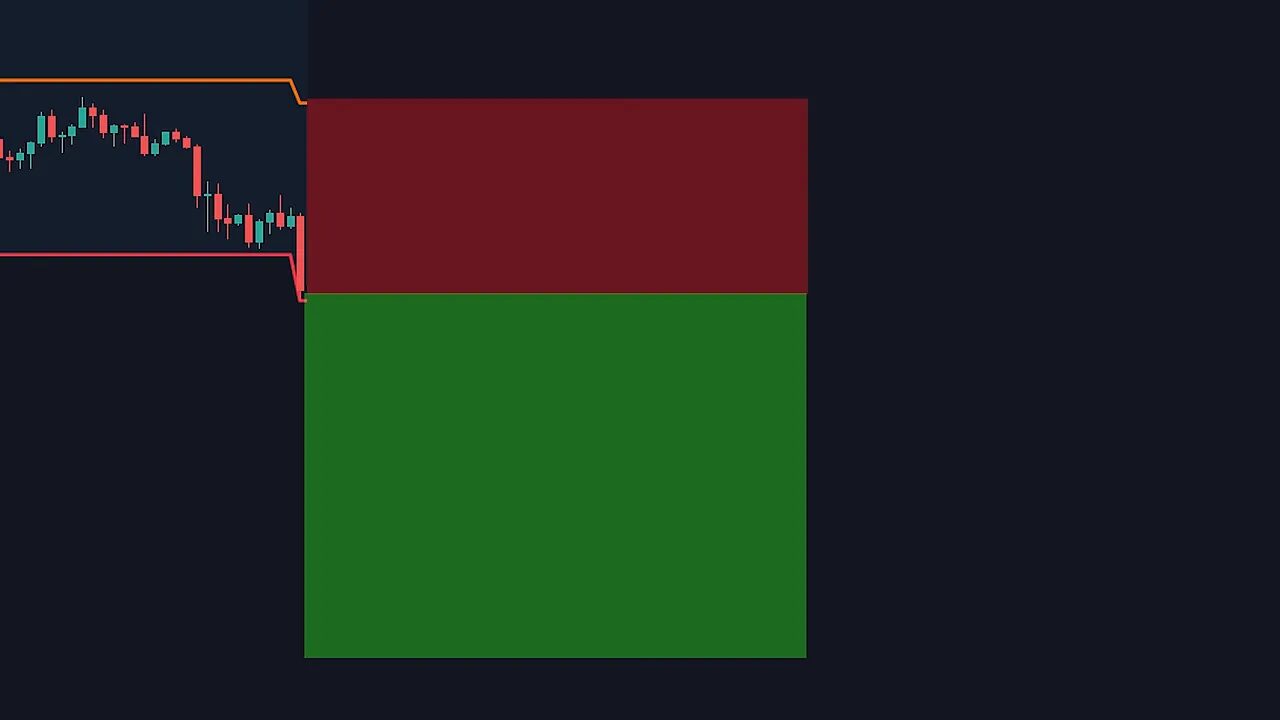
- Dungeon Channels: set the main length to 96 and color the bands so they are easy to spot (red recommended).
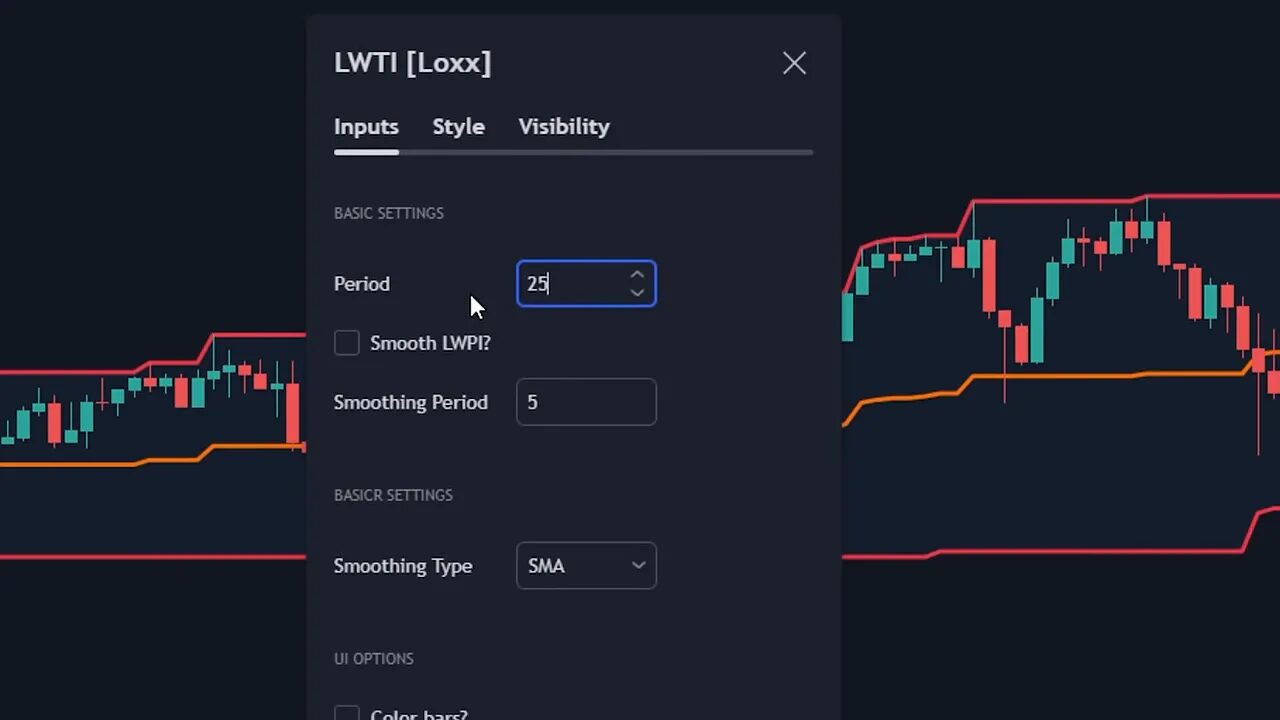
- LWTI (Larry Williams Large Trade Index): period = 25, smoothing = 20. Higher period favors longer trends; lower period catches shorter momentum.
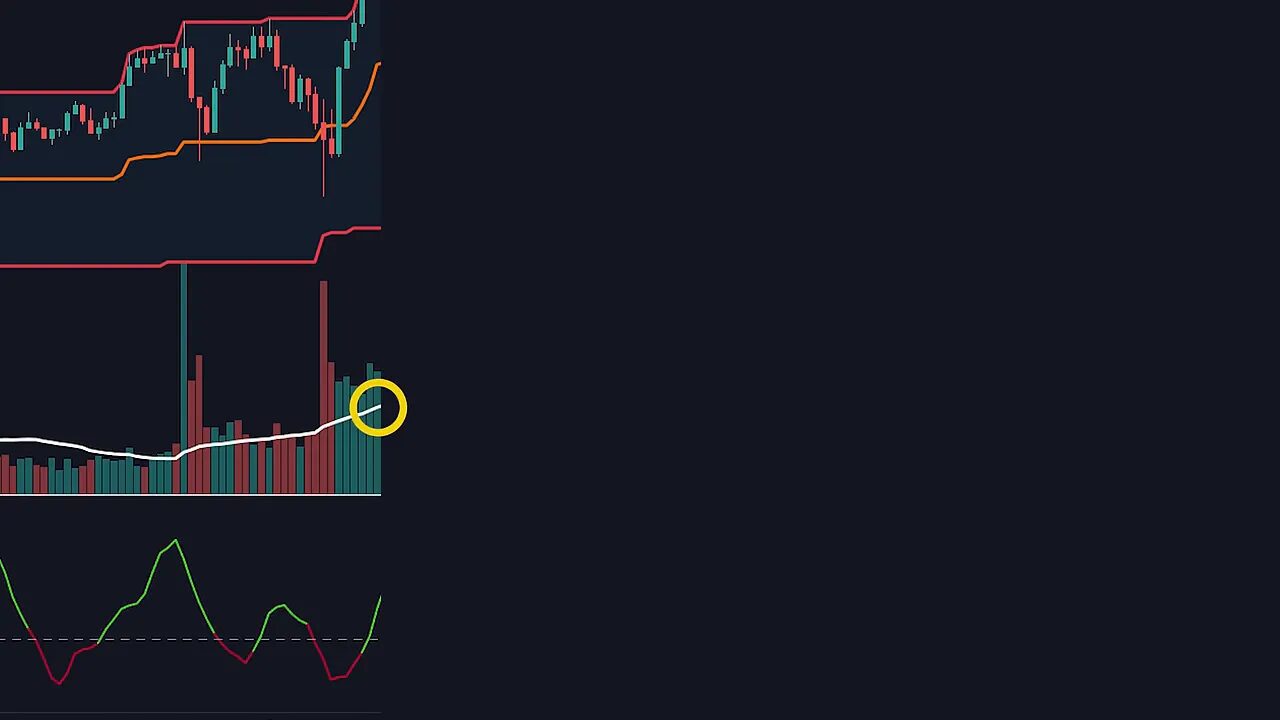
- Volume: enable a volume moving average with MA length = 30 and display it (white looks clear against most themes).
Entry rules — how to take a trade
All three criteria must be met at the same candle for a valid entry.
Long trade (buy)
- Price touches or breaks above the upper Dungeon Channel band.
- LWTI is green, indicating bullish trend confirmation.
- Volume bars are above the white volume MA and the bars are bullish (green).
Enter on the breakout candle once those three line up. Typical stop loss is placed right below the Dungeon median line. If the space between the upper band and the median is huge, use the recent swing low instead to avoid oversized stops. Target a 2:1 reward to risk as a baseline.
Short trade (sell)
- Price touches or breaks below the lower Dungeon Channel band.
- LWTI is red, indicating bearish trend confirmation.
- Volume bars are above the white volume MA and the bars are bearish (red).
Enter on the confirmation candle. Place stop loss above the Dungeon median or above a nearby swing high if the channel gap makes the median impractical. Aim for a 2:1 reward to risk target.
Managing trades and common edge cases
Consolidation is the strategy’s enemy. When bands squeeze, small, directionless moves will often trigger false breakouts. The LWTI plus volume filter reduces false signals by requiring both trend alignment and real participation.
Stop placement: in normal conditions put stops below/above the Dungeon median line. If that produces a very large stop relative to your account, tighten the stop to the recent swing low/high to preserve position-sizing discipline.
Secret trick: respect higher-timeframe support and resistance
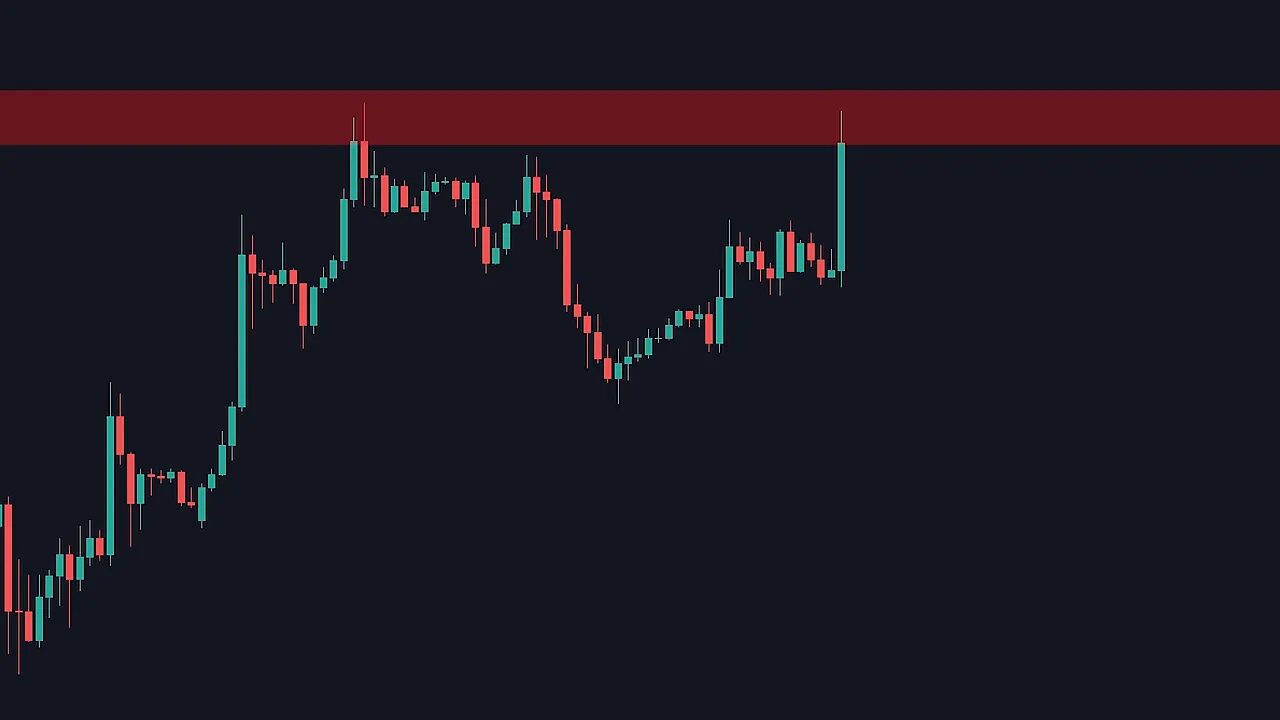
Signals can fail when they coincide with strong, nearby support or resistance. Always check a higher timeframe (one hour is a good default) and mark major levels or supply and demand zones. Avoid entering new breakouts right into those zones.
If price is breaking a major resistance and the three indicator conditions are met on the five-minute chart, that is a high-confluence setup—excellent for entries. Conversely, if the breakout attempts happen directly at a strong resistance, skip it to avoid chop and bounce failures.
For traders focused on crypto markets, this extra context is crucial. Crypto assets often exhibit violent moves around listed levels and on-chain events. Using a crypto signals service that highlights breakouts and volume surges across multiple blockchains can help you spot opportunities faster and filter out low-quality moves. When a crypto signal lines up with a Dungeon breakout plus LWTI confirmation, that creates a particularly compelling trade candidate.
Quick trade walkthroughs
- Long example: price touches upper band, LWTI turns green, volume spikes above MA with green bars; enter, stop below median, take profit at 2:1.
- Short example: price hits lower band, LWTI red, volume above MA with red bars; enter, stop above median, target 2:1.
Risk management and position sizing
Always size positions so that your stop loss equals a small percentage of your equity. The strategy is not about hitting the home run on every trade. It is about stacking small, well-managed, high-probability trades where the trend and volume do the heavy lifting.
Combining automated alerts from a crypto signals service with careful stop placement and defined take-profit targets can increase the number of actionable setups you catch while keeping emotional decision-making to a minimum.
Frequently asked questions
Which timeframe is best for this strategy?
This setup was designed for the five-minute timeframe. You can adapt it to other timeframes, but the indicator periods (Dungeon length = 96, LWTI period = 25, volume MA = 30) were tuned for five minutes and should be re-tested before using live.
Can I use this on crypto, stocks, and forex?
Yes. The signals are based on volatility, trend, and volume, which are universal. Crypto tends to have larger swings and unique liquidity patterns, so pairing the setup with chain-specific volume alerts or a crypto signals service helps identify high-probability breakouts across exchanges and chains.
What if the Dungeon bands are very tight?
Tight bands indicate consolidation. Avoid taking breakouts when bands are squeezed unless volume is clearly above the volume MA and LWTI confirms trend. Otherwise, wait for a clearer expansion of volatility.
How should I place stops when the channel gap is large?
If the gap between the upper band and the median is large, placing a stop at the median may create an oversized risk. Use the recent swing low or high instead to keep your stop size reasonable and preserve proper position sizing.
Do the indicators repaint or lag?
The Dungeon Channels and LWTI are derived from historical price and smoothing; they will inherently lag to some degree. The volume moving average is purely observational. That is why the strategy requires simultaneous confirmation across indicators to reduce false positives rather than relying on a single repaint-prone signal.
Final notes
This is a practical, repeatable approach: use the Dungeon Channels as breakout triggers, require trend confirmation from LWTI, and demand volume above a moving average. Add higher-timeframe context to avoid fading major levels. When these pieces line up you get clean, high-probability setups.
If you trade multiple markets and blockchains, pairing this method with reliable alerts—like a crypto signals service that highlights volume breakouts and level breaks—can reduce screen time and help you act quickly when the best trades appear.
