
I used nothing but support and resistance levels and pulled a 35% return in just 30 minutes. That outcome wasn’t luck. It came from a process: drawing cleaner levels from the right timeframes, treating them as zones rather than exact lines, and waiting for confirmation backed by multiple signals.
Table of Contents
- Why support and resistance still matter
- Top-down approach: start from the big picture
- Line chart trick to find clean levels
- Think in zones, not razor-thin lines
- Never enter blindly: wait for confirmation
- Make levels more accurate with confluence clusters
- Automate routine checks with plain-English bots
- Example trade workflow
- Key takeaways
- Frequently Asked Questions
- Final thought
Why support and resistance still matter
Support and resistance are the foundation of every price-based trading strategy. They tell you where supply and demand have historically shifted, and they shape entry, stop, and target placement. Most traders can draw a line, but few use those lines with discipline and context. The difference between a losing trade and a high-probability setup is how you draw, update, and confirm those levels.
Top-down approach: start from the big picture
Begin on a higher timeframe than the one you intend to trade. If you scalp on 1-minute or 5-minute charts, draw your major levels on the 1-hour chart. Higher timeframe levels hold more weight, reduce false breakouts, and prevent the clutter that comes from plotting every small swing on low timeframes.
When higher timeframe levels are respected, entries on lower timeframes tend to be cleaner and more decisive. Keep your chart focused on major turning points. Delete levels the market ignores and add new ones as structure changes. Updating your levels daily keeps them accurate and actionable.
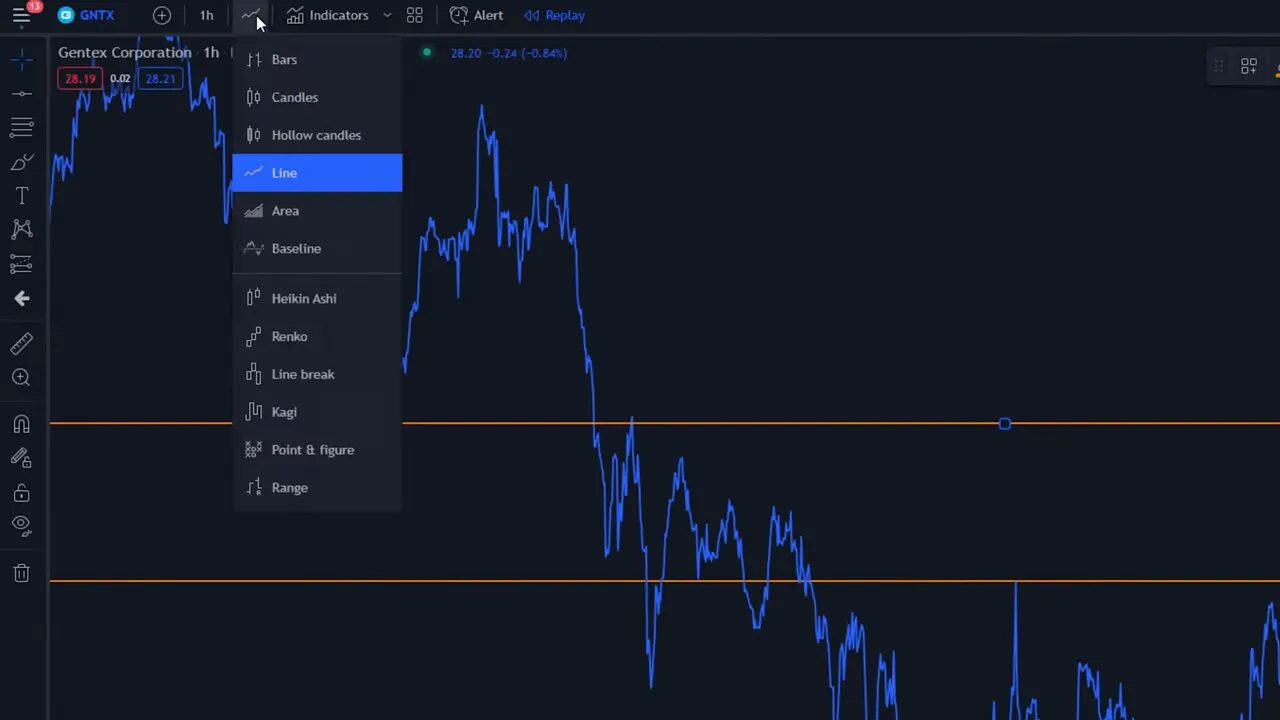
Line chart trick to find clean levels
If you struggle to spot key zones, switch your chart to a line graph for a few minutes. It removes the noise of wicks and candle bodies and highlights where price consistently holds. Mark levels on the line chart, then switch back to candlesticks to fine tune entries and stops.
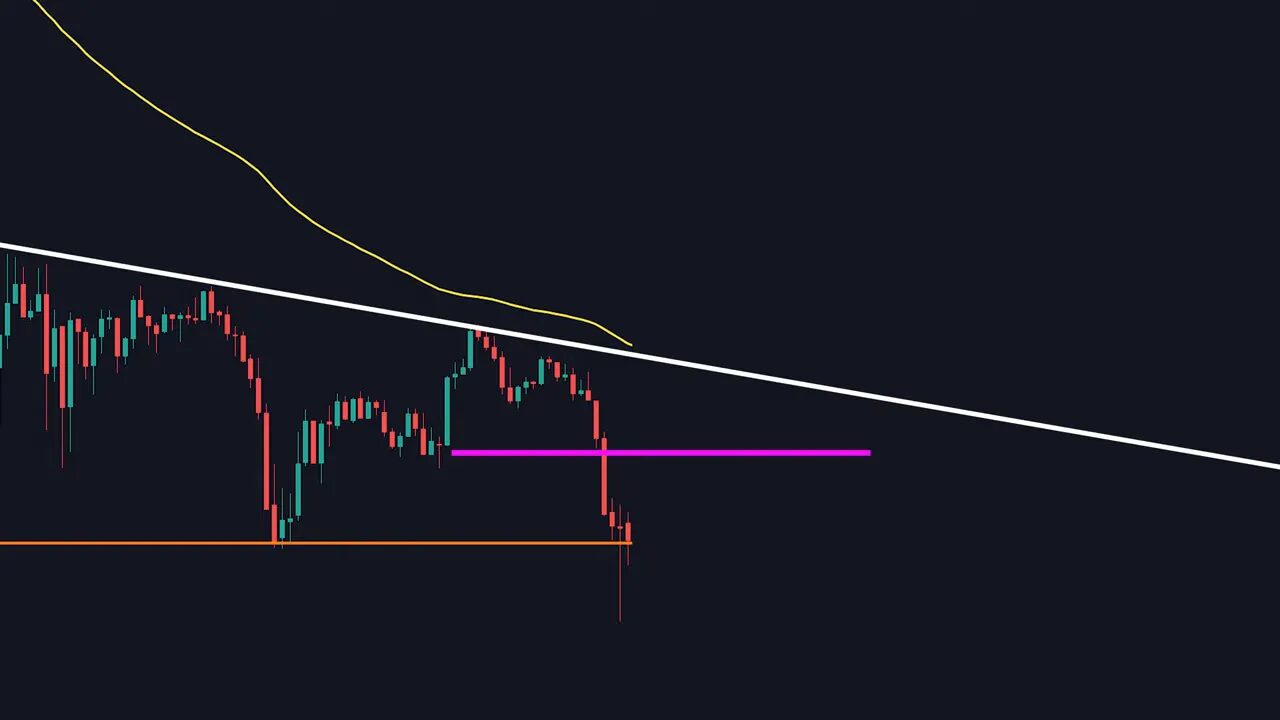
Think in zones, not razor-thin lines
Expecting 100 percent precision is a setup for frustration. Price is noisy and can poke above or below a line without invalidating the level. Those pokes are often false breakouts that reveal weakness or strength. Treat key areas as zones to provide some wiggle room and avoid being repeatedly faked out.
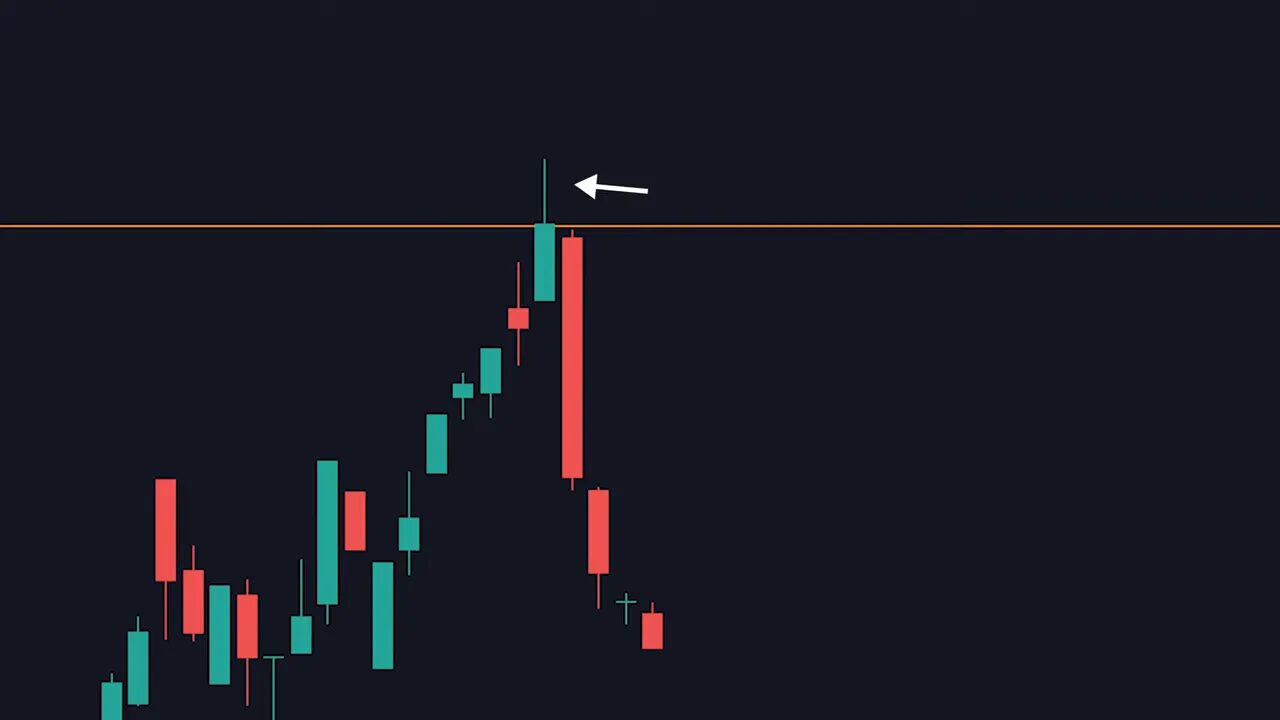
When price briefly breaks a resistance and then falls back, that false breakout gives you an edge: the market showed rejection and is likely to move toward the next support. Zones give you space to evaluate whether the level is genuinely broken or merely tested.
Never enter blindly: wait for confirmation
Drawing a level is only half the job. Entering a trade at the line without confirmation is a common mistake. Instead, wait for signals that the market is actually reversing or continuing.
- Watch for structure breaks: a trendline break or a pivot level that fails.
- Use lower timeframes to confirm direction before committing capital.
- Look for candlestick confirmation such as rejection wicks, engulfing bars, or trendline retests.
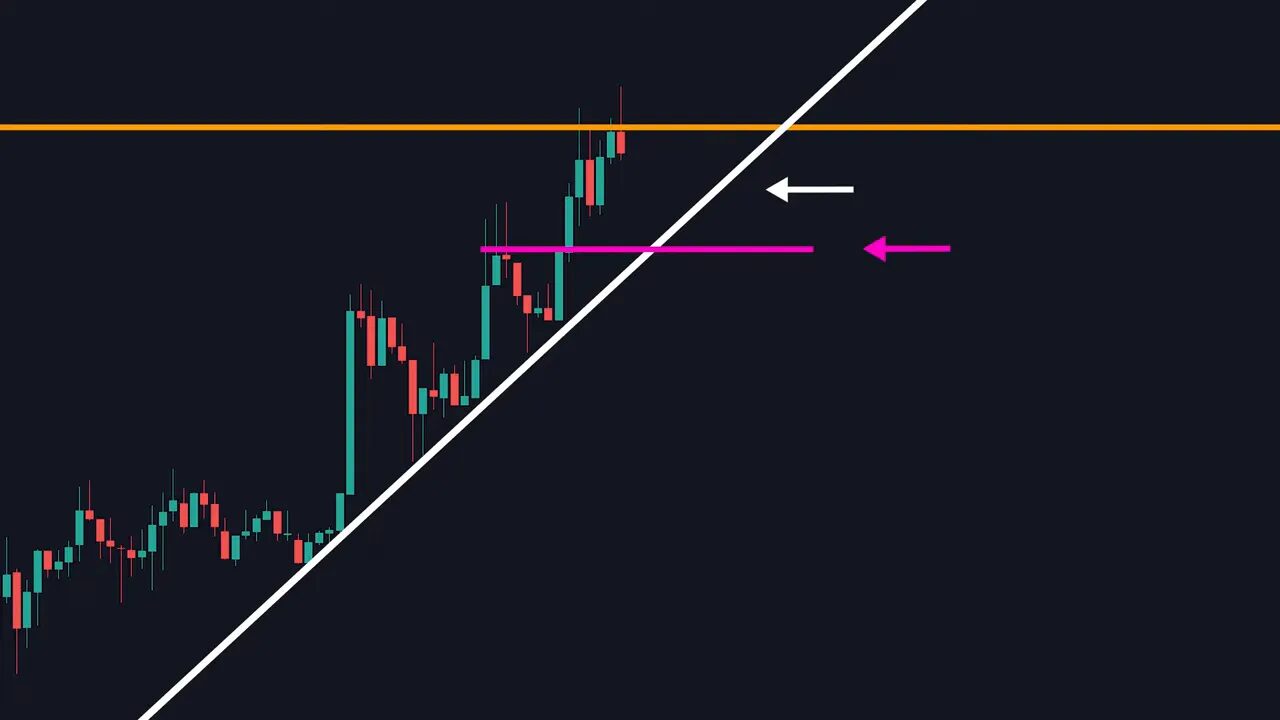
For example, instead of placing a short at a resistance when price is still trending upward, wait until price breaks a short-term uptrend line and a pivot point. That break serves as confirmation that sellers are stepping in and increases your win probability.
Make levels more accurate with confluence clusters
A single support or resistance is useful, but multiple reasons for price to react are far better. That is the idea behind a confluence cluster. Combine support and resistance with pivot points, VWAP, moving averages, or order flow areas to strengthen the setup.
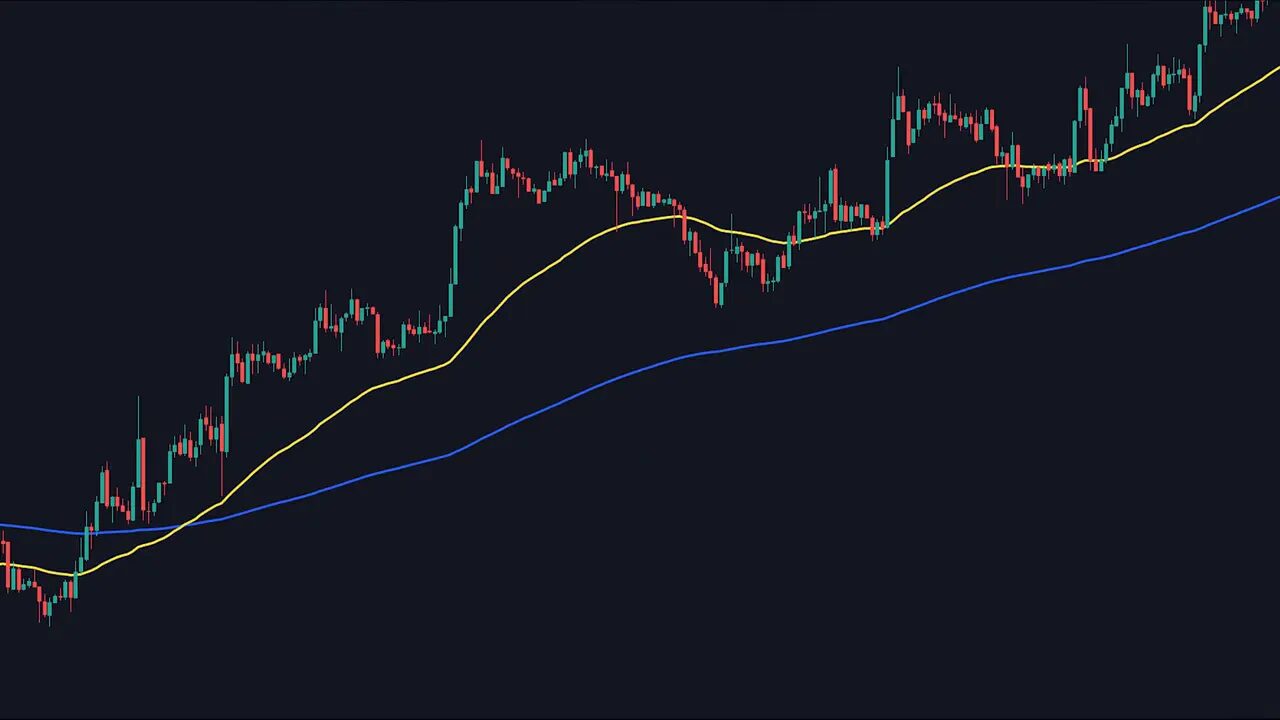
When a moving average, a higher timeframe support zone, and a daily pivot align, the chance that price respects that area increases dramatically. Never rely on support and resistance alone; stack confirmations to tilt the odds in your favor.
For crypto traders, these confluence clusters are especially valuable across different blockchains and trading venues. Real-time alerts from a trusted cryptocurrency trading signals service can save time by highlighting when multiple indicators line up on a coin you follow. Signals work well alongside your own level-drawing practice because they point you to opportunities where confluence is already present.
Automate routine checks with plain-English bots
Repetitive tasks like monitoring pivot crosses, trendline breaks, or RSI conditions are perfect candidates for automation. There are tools that let you build trading rules in plain English without coding. For example:
If Bitcoin crosses above the daily pivot by $10,000 then sell $10,000 when RSI crosses above 70
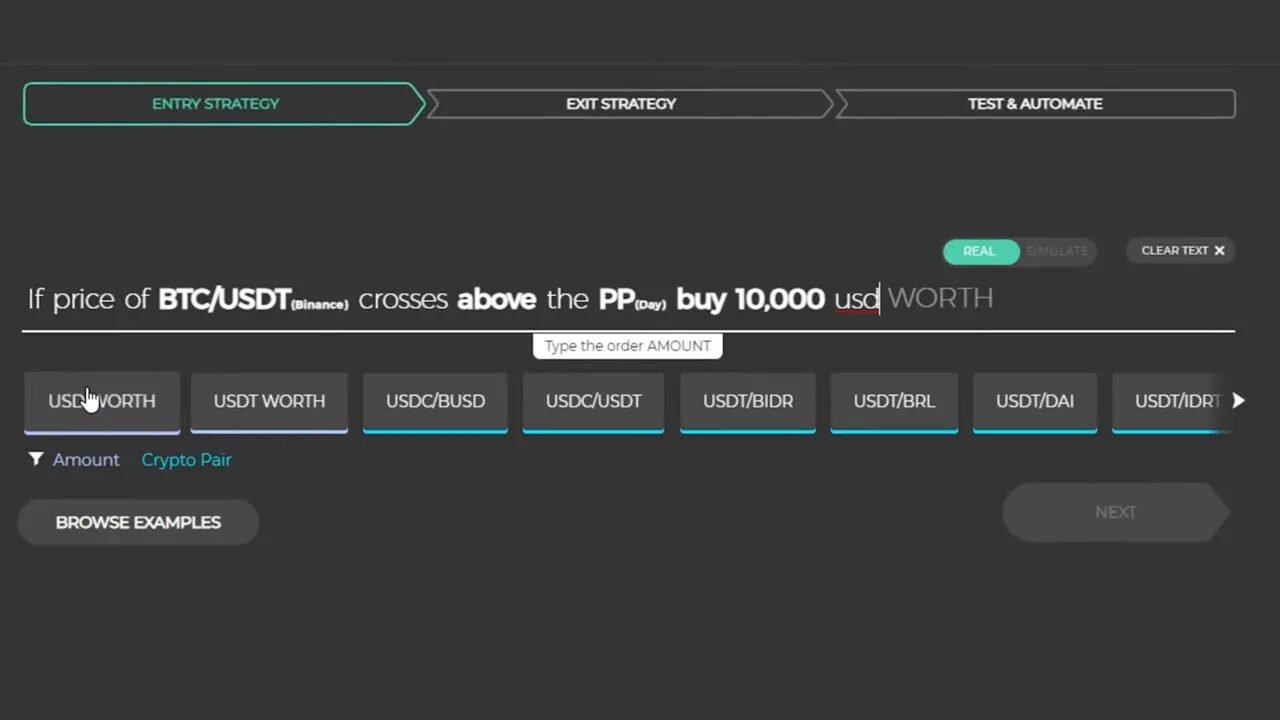
Automation doesn’t replace judgment. Use it to execute rules consistently and to free up mental bandwidth for strategy and risk management. Automation can also integrate with signals to execute or alert on high-confidence crypto setups across exchanges.
Example trade workflow
Here is a concise routine that produced a winning trade:
- Identify major support on the 1-hour timeframe.
- Switch to a lower timeframe to watch price structure and short-term trendlines.
- Wait for a break of the lower timeframe trendline or a pivot failure as confirmation.
- Confirm additional confluences such as VWAP or a moving average near the same zone.
- Enter on confirmation, place a stop beyond the zone, and size risk appropriately.
- Trail or take profit according to the next structural level.
This systematic approach avoids impulse entries and uses the market’s own behavior to confirm trades. Over time, disciplined execution of this workflow can drastically improve win percentage and risk-adjusted returns.
Key takeaways
- Use a top-down approach and draw levels on a higher timeframe.
- Treat support and resistance as zones, not precise lines.
- Update your levels daily—delete ignored lines and add new ones.
- Wait for confirmation before entering trades.
- Stack confluences: pivot points, VWAP, moving averages, and structure.
- Automate routine rules and consider signal services to highlight confluence opportunities, especially in crypto markets.
Frequently Asked Questions
What timeframe should I use to draw support and resistance?
Draw major levels on a higher timeframe than the one you trade. Day traders who use 1-minute or 5-minute charts should pull levels from the 1-hour chart to improve accuracy and reduce false breakouts.
How do I avoid being tricked by false breakouts?
Treat levels as zones, not exact lines. Wait for confirmation such as a trendline break, pivot failure, or confluence with indicators before entering. False breakouts often lead to swift rejections that provide clear trade opportunities if you wait.
What is a confluence cluster and why does it matter?
A confluence cluster is a grouping of reasons for price to react at the same area—examples include a moving average, a pivot point, VWAP, and a higher timeframe support zone aligning. The more reasons price has to respect an area, the higher the probability of a clean reversal or continuation.
Can I automate support and resistance trading?
Yes. Many platforms let you write rules in plain language to enter or exit when specific price conditions occur, such as pivot crosses or RSI thresholds. Automation helps execute rules consistently and can be paired with a signals service to act on high-probability setups.
How do trading signals fit into this method?
Trading signals can quickly surface trades where confluence already exists. They are most useful when combined with your own level-drawing and confirmation checks. Use signals as an extra layer: they point you to opportunities, while your process confirms execution and risk management.
Final thought
Support and resistance are simple in concept but require discipline to use effectively. Draw from the right timeframe, treat levels as zones, wait for confirmation, and stack confluences. Use automation and selective signal services to scale consistent decision-making. Over time, these habits turn basic lines on a chart into a powerful, repeatable edge.
