

Table of Contents
- Why momentum matters more than prediction
- Three possible next moves for any trend
- Step 1 — Spot shrinking moves in the trend
- Step 2 — Confirm with divergence (use RSI)
- Step 3 — Use a trend filter so you trade with the market
- Step 4 — Add pivot points for a second confirmation
- How to know when to enter
- Trade management: stops, partial exits, and rules
- When to get out
- Result: a confirmed, lower-risk reversal trade
- Applying this to crypto markets
- Advanced ways to improve the setup
- Key checklist before taking the trade
- Frequently asked questions
- Final thoughts
Why momentum matters more than prediction
Traders have long chased the holy grail of market prediction: fancy algorithms, endless backtests, and every indicator under the sun. That rarely works long term. Instead, focus on a simpler question that actually matters when you trade: is the trend losing momentum?
Momentum gives you a practical way to decide whether a trend will continue, pause, or reverse. When the market slows down, it leaves visible clues. Spotting those clues early lets you enter higher-probability trades with lower risk.
Three possible next moves for any trend
When you look at a chart, ask yourself which of these three outcomes is most likely next:
- Continue in the same direction.
- Lose steam and start consolidating.
- Reverse into the opposite direction.
The strategy below shows a simple, repeatable way to identify when a downtrend is losing steam and when a real reversal is forming.
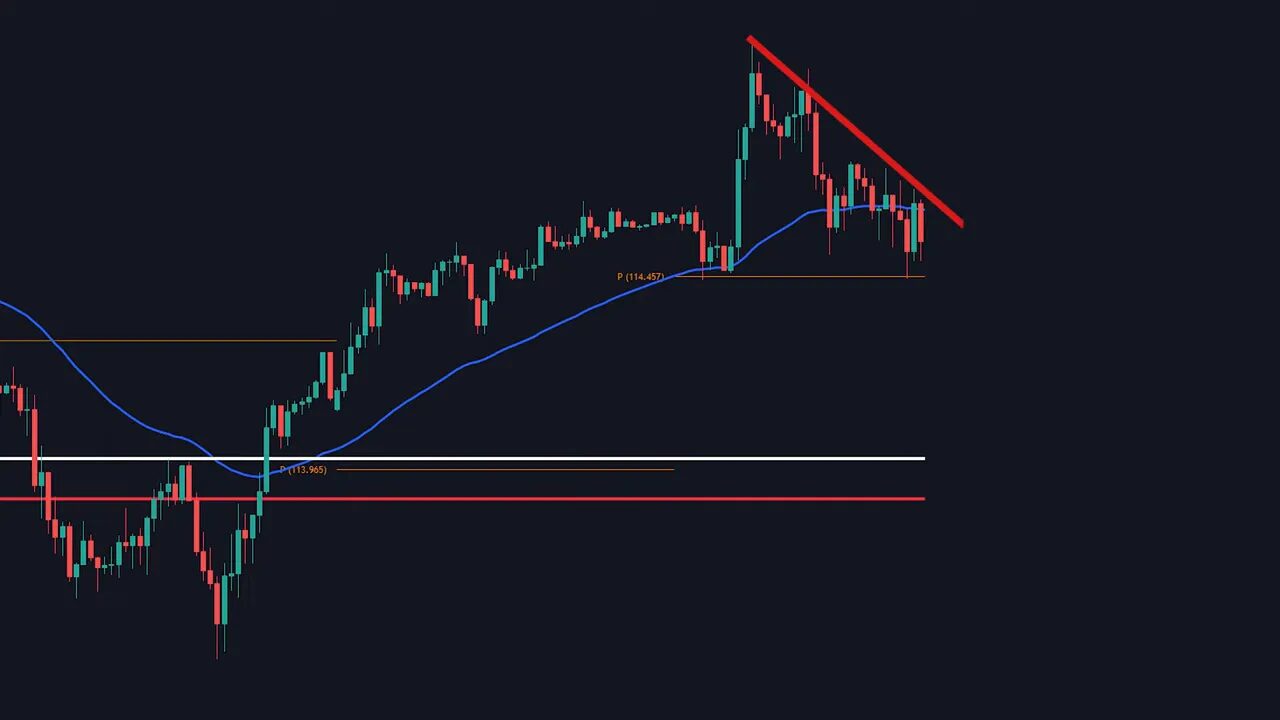
Step 1 — Spot shrinking moves in the trend
A healthy downtrend makes significant drops and clear lower lows. But when those drops start to shrink in size, that is the first red flag the trend might be running out of steam. Measure consecutive drops inside the downtrend. If each drop is smaller than the last, the momentum is fading.
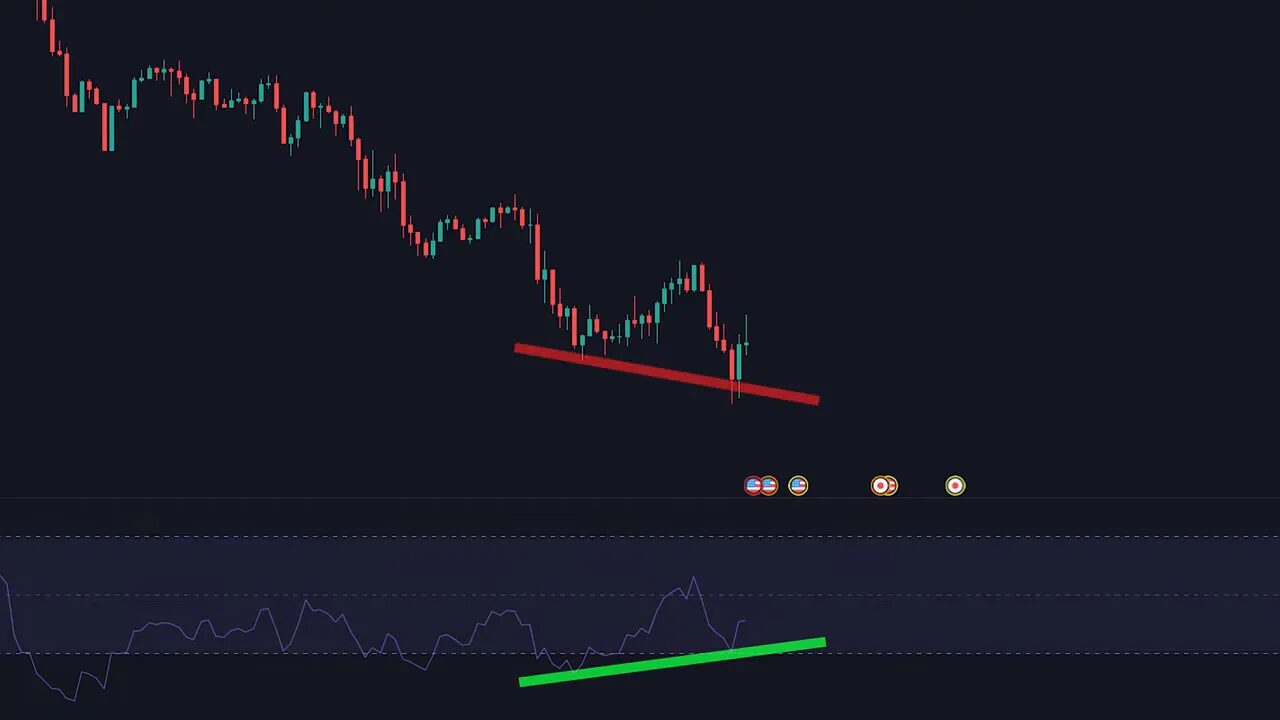
Step 2 — Confirm with divergence (use RSI)
Divergence is a simple concept: price moves one way while a momentum indicator moves the other. It does not guarantee a reversal, but it is one of the clearest early warnings that momentum is shifting.
For this method the go-to momentum indicator is the Relative Strength Index. Add RSI to the chart and compare price lows to RSI lows. If price makes a lower low but RSI makes a higher low, that is bullish divergence and a strong hint the downtrend may be about to reverse.
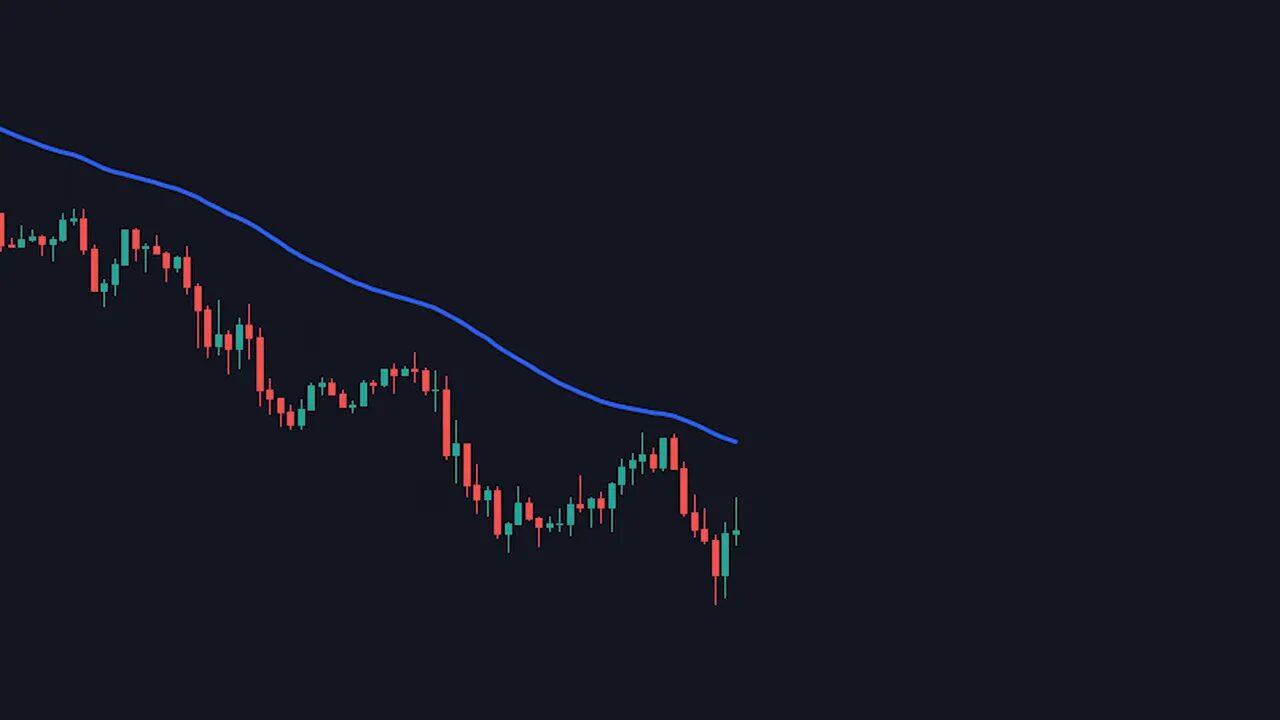
Step 3 — Use a trend filter so you trade with the market
Divergence alone is not enough. Combine it with a simple trend filter to avoid fighting the market. The easiest and most effective filter is the 50-period exponential moving average (50 EMA).
- If price is below the 50 EMA, treat the market as bearish and avoid longs.
- If price is above the 50 EMA, treat the market as bullish and avoid shorts.
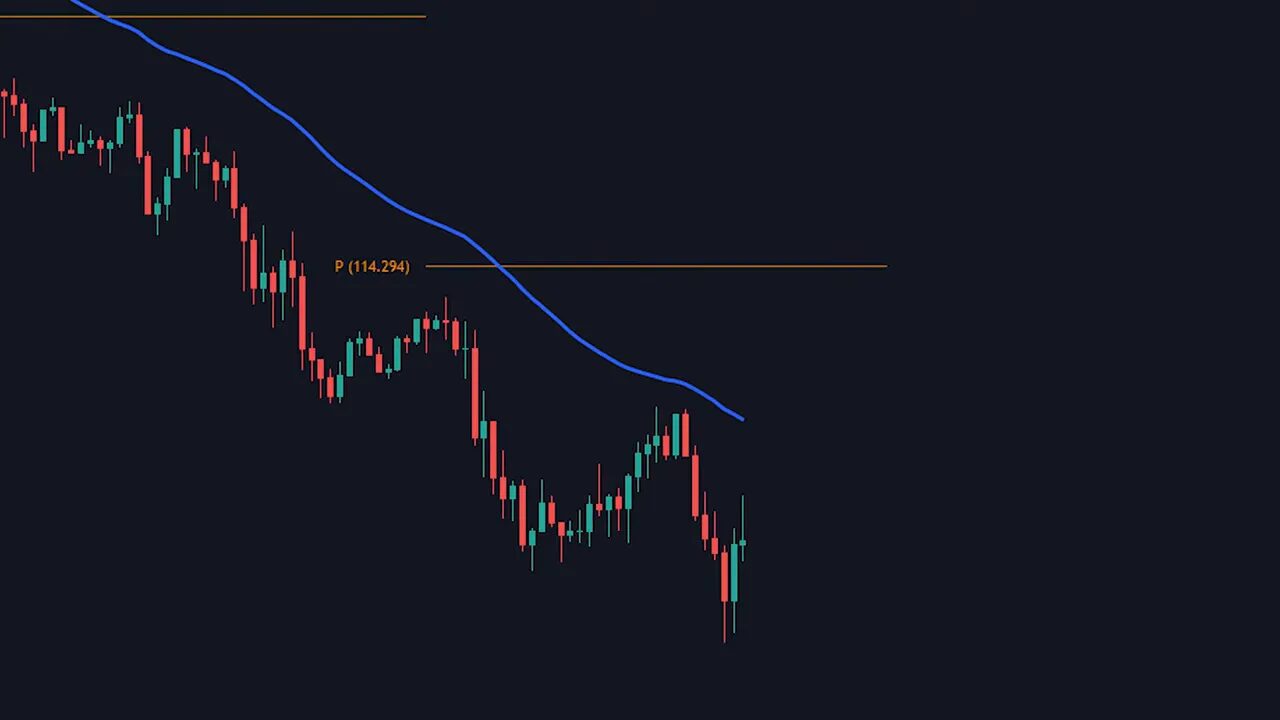
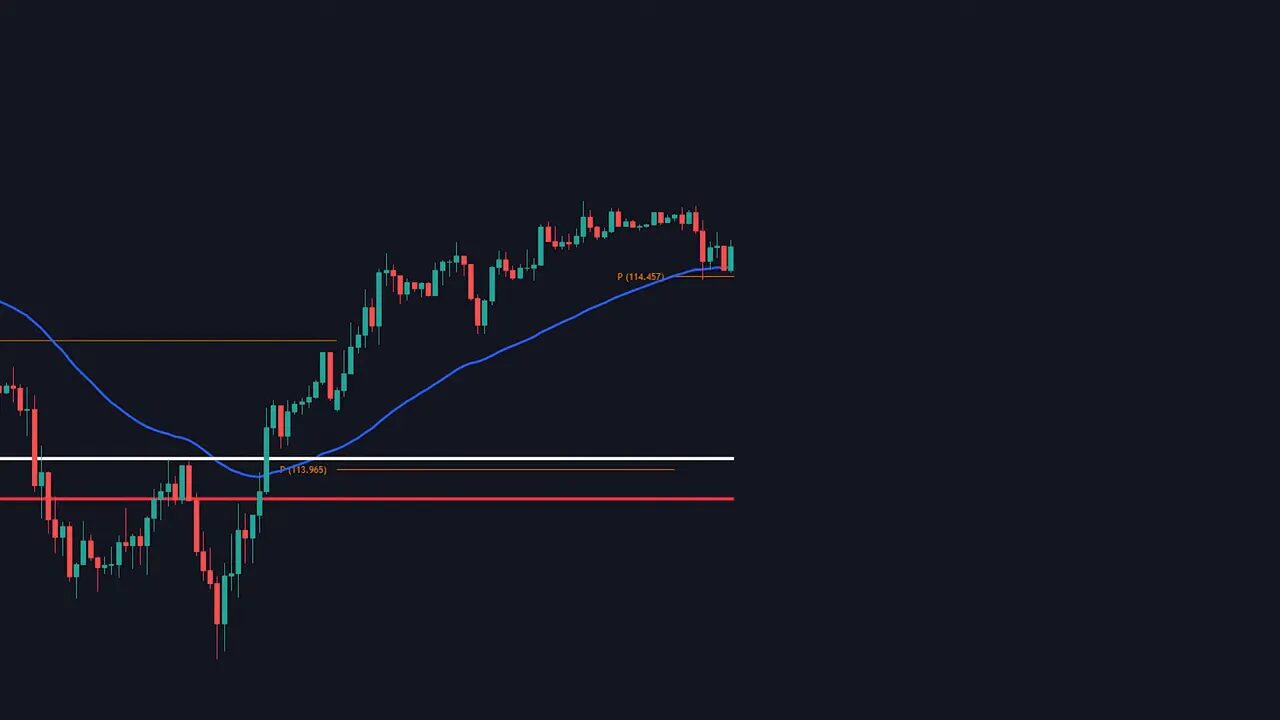
Step 4 — Add pivot points for a second confirmation
Pivot points act like daily directional checkpoints. Use daily pivots and keep only the central pivot line (P). If price is below the pivot, bias is bearish; if above, bullish. When the 50 EMA, a pivot point, and a horizontal support/resistance level cluster together, that confluence becomes a powerful decision zone.
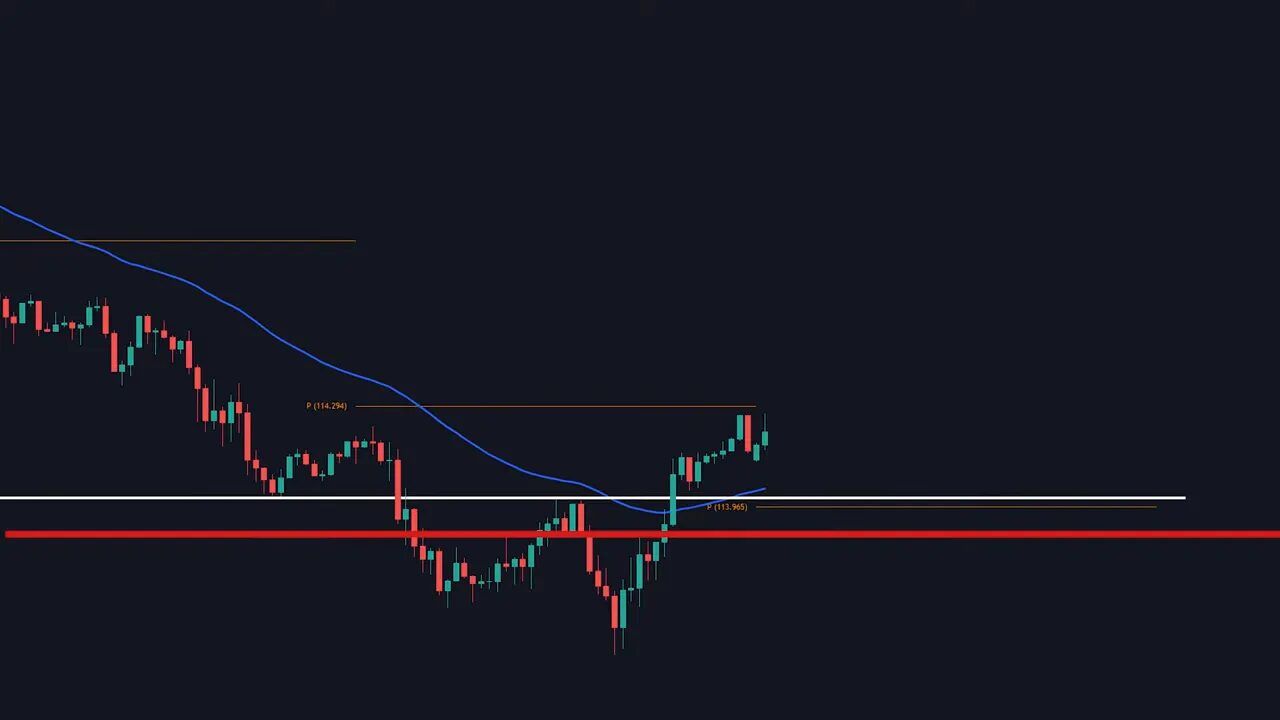
How to know when to enter
Look for price to break above the resistance level and the 50 EMA, and for the daily pivot to move below the price (or be decisively taken). When price has passed these three checkpoints — EMA, pivot, and your drawn resistance — you have a high-probability confirmation of a trend shift to the upside.
Trade management: stops, partial exits, and rules
After entry, place your stop loss under a recent structure low or below the same confluence zone that provided confirmation. If you want a guide on stop placement mechanics, study how to choose stops by tying them to structure instead of arbitrary percentages.
Manage the position as price retraces and tests the pivot or EMA. If those levels hold and price bounces, consider:
- Taking partial profit, for example 25 to 50 percent, to reduce risk.
- Holding the remainder with a trailing stop or by moving the stop to breakeven after a defined swing.
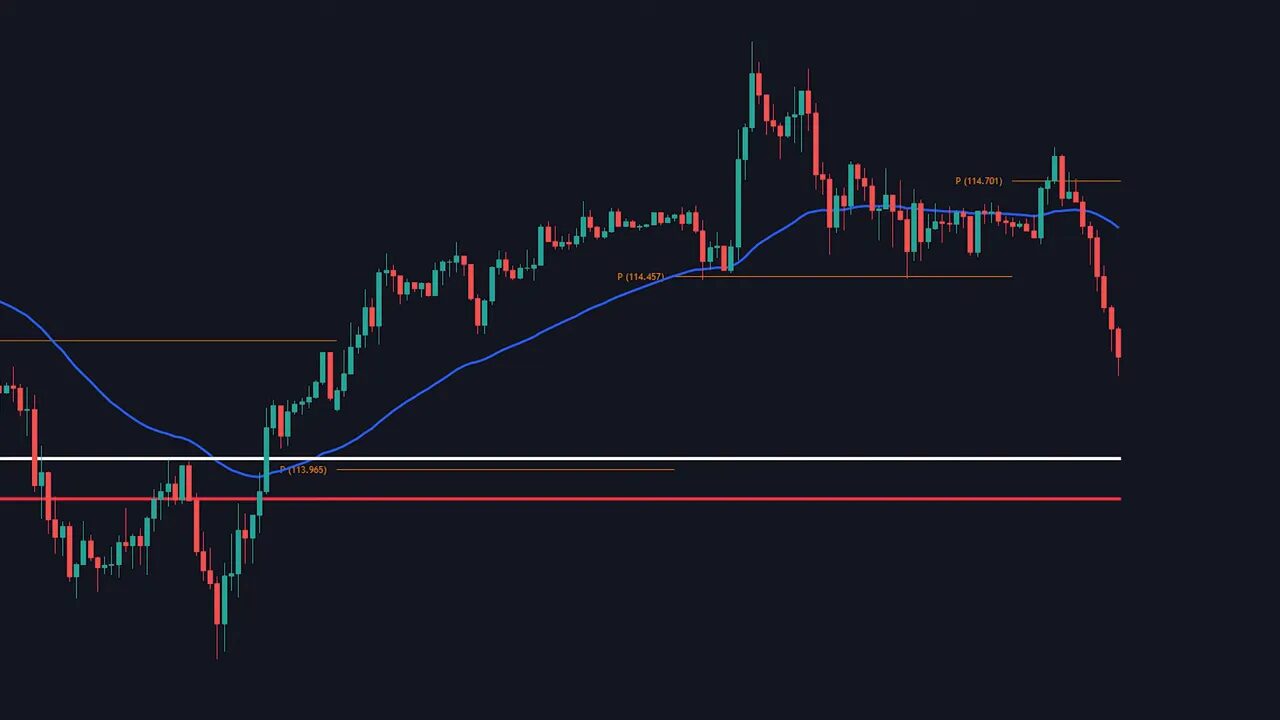
When to get out
Exit or reduce exposure when the trade starts showing signs of weakness: lower highs, price falling below the 50 EMA, multiple tests of the pivot point, or a new pivot forming above price. Those are clear signals the trend may be failing.
Result: a confirmed, lower-risk reversal trade
By combining shrinking drops, RSI divergence, the 50 EMA, and daily pivots, you trade with multiple confirmations instead of chasing a single signal. That approach helps capture strong moves while limiting downside when the market turns against you.
Applying this to crypto markets
The same framework works for crypto instruments, with a few considerations. Crypto can be more volatile and subject to news-driven moves, so watch volume and liquidity around major support and resistance. Daily pivots and a 50 EMA still reveal momentum shifts across tokens and blockchains.
If you trade multiple cryptocurrencies, leveraging a reliable service for timely market-specific insights can be helpful. Cryptocurrency trading signals that highlight momentum divergence or cluster confirmations across different blockchains make spotting reversals faster and more consistent. Use signals as an additional input, not a substitute for your own price action read.
Advanced ways to improve the setup
Once the basic rules are second nature, add other layers selectively:
- Volume — look for divergence between price and volume or confirming volume on the breakout.
- Chart patterns — heads and shoulders, wedges, and flags can add context.
- Level 2 and order flow — for intraday confirmation on entries and exits.
- Backtesting — keep a journal and track setups to quantify edge over time.
For crypto traders monitoring dozens of tokens, receiving curated signals that flag setups across different chains can save time and help you prioritize opportunities that fit this momentum + confirmation framework.
Key checklist before taking the trade
- Consecutive moves inside the trend are shrinking.
- RSI or another momentum indicator shows divergence.
- Price breaks and holds above the 50 EMA.
- Daily pivot moves below the price or acts as support.
- Horizontal resistance is overtaken and turns into support.
- Position size and stop loss respect risk management rules.
Frequently asked questions
What exactly is divergence and why use RSI for it?
Divergence occurs when price moves in one direction while a momentum indicator moves the opposite way. RSI is a popular and reliable momentum indicator for spotting divergence because it highlights changes in buying and selling pressure. A lower low in price with a higher low in RSI suggests weakening selling pressure.
Can divergence fail and how to protect against false signals?
Divergence can fail. That is why confirmation is crucial. Require a breakout above the 50 EMA, a pivot confirmation, and a break of nearby resistance. Use stops placed under logical structure points and keep trade size small enough to survive occasional failures.
Why use the 50 EMA instead of a simple moving average?
The exponential moving average reacts faster to recent price action because it weights recent candles more heavily. That responsiveness helps you detect early trend shifts without being too noisy. The 50 period meshes well with daily pivots for swing-style timeframes.
How do pivot points work with this strategy?
Daily pivot points provide a short-term reference for market bias. If price is above the daily pivot, bulls have the edge that day; if below, bears do. Using the central pivot line as a checkpoint gives an easy confirmation when combined with EMA and support or resistance.
Is this approach suitable for crypto trading?
Yes. The same principles apply, though crypto tends to be more volatile. Combine the momentum and confirmation checks with volume and liquidity analysis. Subscription-based cryptocurrency trading signals can help locate setups that match these criteria across many tokens and chains, saving time and improving consistency.
What timeframes does this work best on?
The method is flexible. It works well on daily charts for swing trades and on shorter intraday timeframes if you adjust the EMA and pivot settings accordingly. Always test the setup on the timeframe you intend to trade.
Final thoughts
Trading is less about predicting the future and more about recognizing when the market is changing how it behaves. Shrinking moves, momentum divergence, and clustered confirmations like the 50 EMA and daily pivots form a simple but powerful system for catching reversals with controlled risk.
Add volume, pattern recognition, and selective use of cryptocurrency trading signals to scale the idea across markets and tokens. The goal is consistent, repeatable decisions that keep risk small and let winners run.
