

Table of Contents
- Outline
- What this indicator claims to do — and why it caught my attention
- How it works: pattern matching with correlated length
- Setup: the three indicators and exact settings
- The rules: How to enter a long or short trade
- Common pitfall: when the projection hits the stop before the target
- Why this approach works better than using the projection alone
- Practical tips, risk management, and extra tools
- Final notes on testing and implementation
- FAQ
Outline
- What the indicator claims to do
- How it actually works (correlated length and pattern matching)
- Setup: the exact indicators and settings
- The trading rules for longs and shorts
- Common pitfalls and how to avoid them
- Practical tips, risk management, and extra tools
- FAQ
What this indicator claims to do — and why it caught my attention
There are loads of fancy indicators out there, but few make a bold claim: predict the next move of price with a projection line. I tried it out and, to my surprise, the projection matched price movement more than once. That got me curious enough to build a rules-based strategy around it. The result is simple, repeatable, and surprisingly robust when combined with a few supportive indicators.
How it works: pattern matching with correlated length
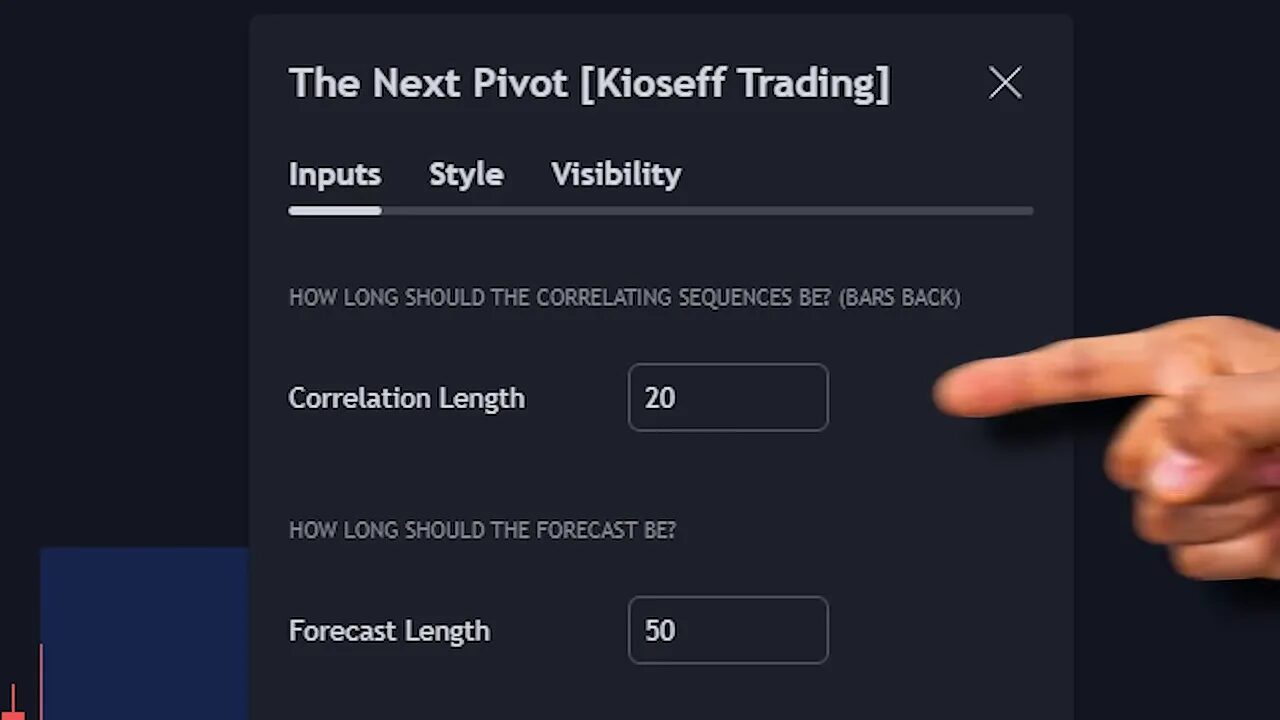
The indicator scans chart history looking for past price segments that closely resemble the current pattern. The key setting is correlated length, which controls how many candles the indicator compares when searching for matches. For example, a correlated length of 20 tells the indicator to compare the last 20 candles to every 20-candle segment in the history and project the most similar continuation.
This is not mystical forecasting. It is pattern recognition: what repeated itself historically may repeat again. That makes the projection useful, but not infallible. That is why the projection should be one input among several, not the sole decision maker.
Setup: the three indicators and exact settings
To increase the odds, pair the projection with trend confirmation and volume confirmation. Here are the exact elements I use:
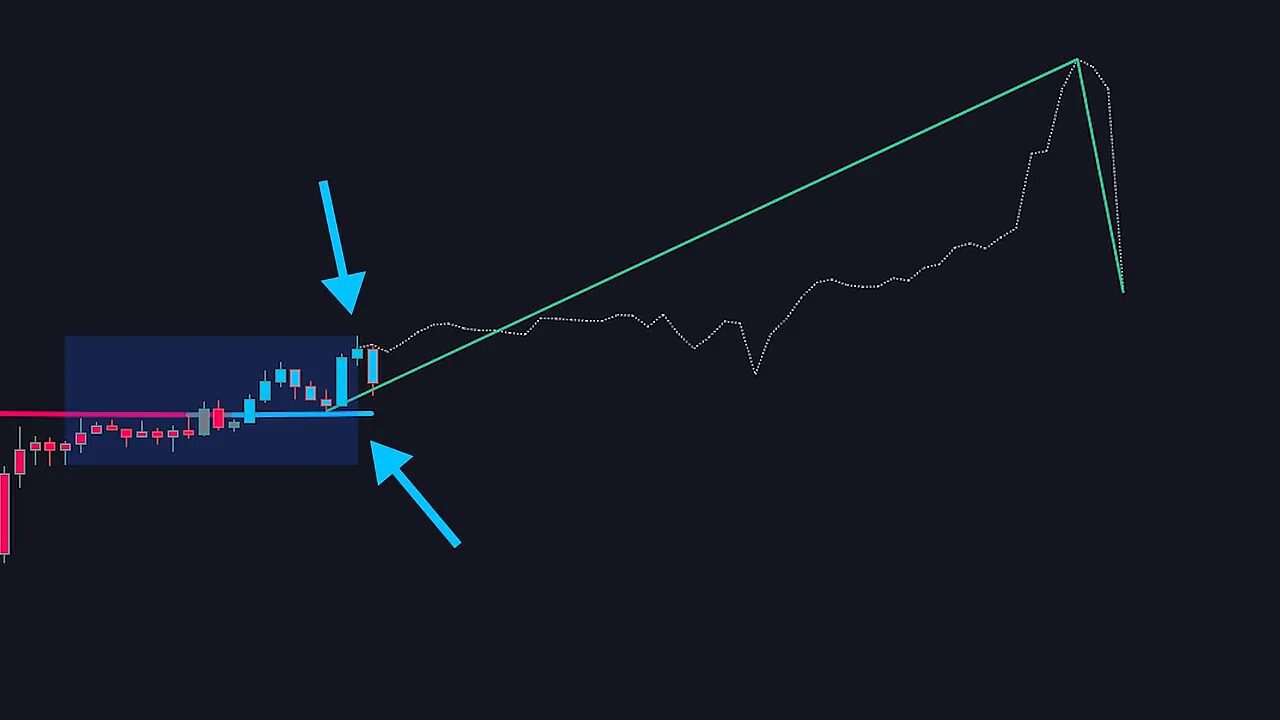
- Next Pivot (the projection indicator) — this adds two projection lines: a white line for the projected exact price action and a green line for the general projected trend.
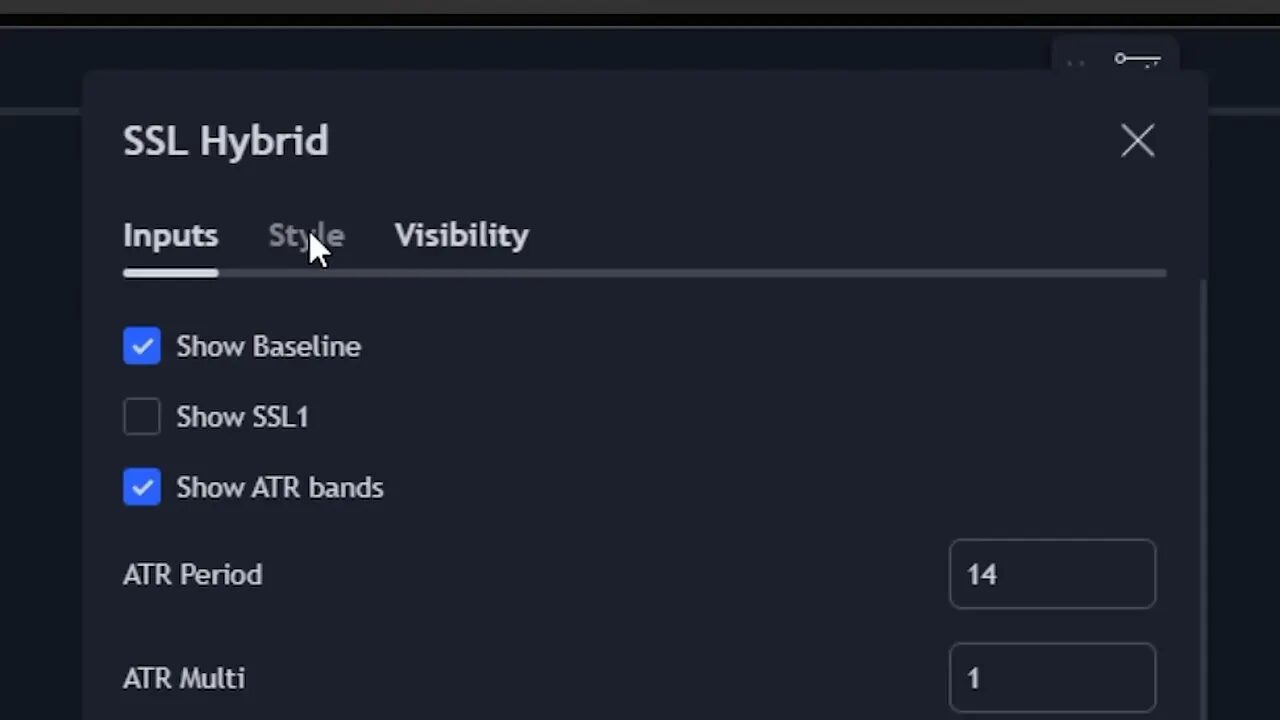
- SSL Hybrid — set the SSL One baseline length to 200 and change the baseline type to McGinley. In the styles tab, show only the MA color and bar color for a cleaner read.
- Volume Oscillator (TradingView built-in) — use it to confirm whether momentum supports the projected move. I adjust the colors so the lines stand out on the chart.
The rules: How to enter a long or short trade
Turn the projection into a strategy by adding simple confirmation rules. The rules keep you out of false positives and make risk management straightforward.
Long trade rules
- The projection (white line) must be sloping up.
- The bars and SSL baseline (MA) must both be blue, signaling trend alignment.
- The volume oscillator must be above zero, showing positive volume momentum.
- Set stop loss below the recent swing low and take profit at a recent swing high.
Short trade rules
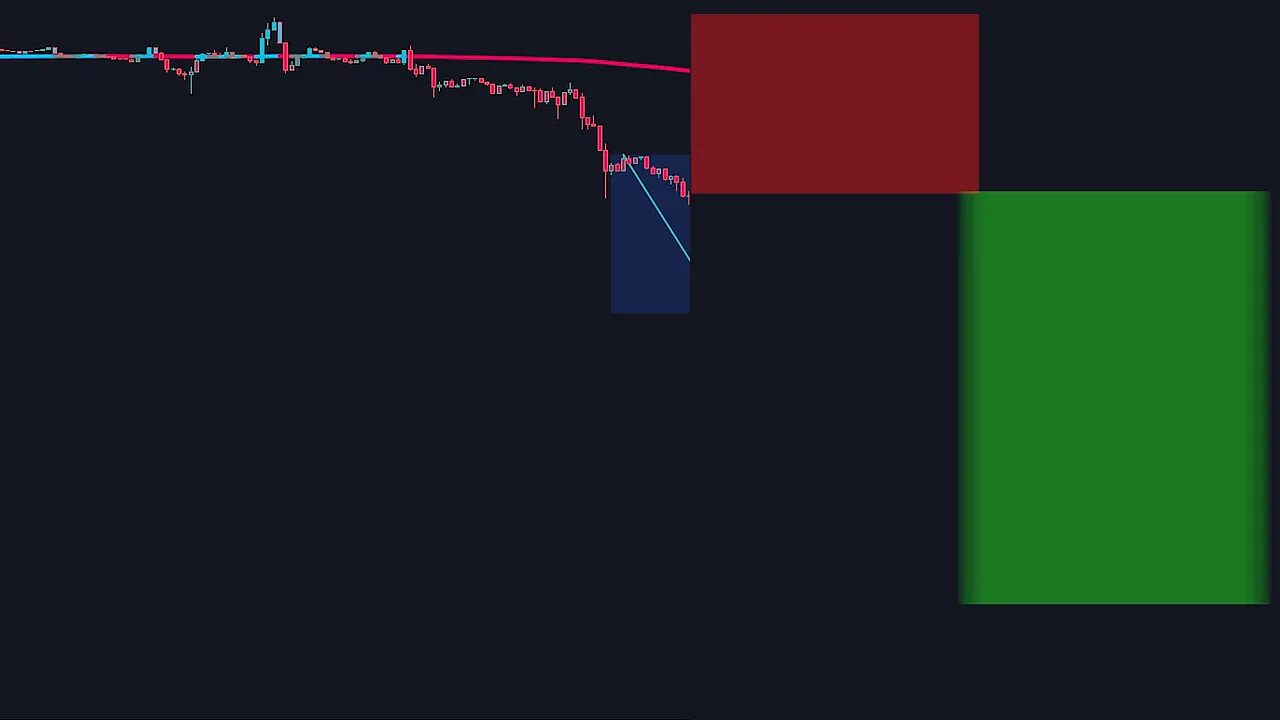
- The projection must be sloping down.
- The bars and SSL baseline must both be red, confirming downside bias.
- The volume oscillator must still be above zero to confirm directional conviction.
- Set stop loss above the recent swing high and take profit at a recent swing low.
Common pitfall: when the projection hits the stop before the target
Even if all confirmations line up, the projection can still show a path that hits your stop loss before your take profit. That is a clear sign to skip the trade. Always visually check the projected path. If the projection suggests the move will go through your stop first, do not enter.
Why this approach works better than using the projection alone
Pattern matching is powerful but not perfect. Adding a trend filter and volume confirmation raises probability by aligning three dimensions:
- Projection for the likely path
- Trend (SSL hybrid McGinley 200) for context
- Volume for conviction
When all three agree, you are trading with history, trend, and momentum — not just a single line.
Practical tips, risk management, and extra tools
Keep your risk per trade small. I place stops at logical swing points and size positions so a stop hit is affordable. Use a demo or small real account to build confidence before scaling up.
If you trade signals.com/blog/crypto-signals-101-everything-you-need-to-know” target=”_blank”>crypto across multiple blockchains, signals that scan pairs and timeframes can save time and point you to the best opportunities. Integrating curated services like crypto spot trading signals helps identify which coins and timeframes are showing alignment between projection, trend, and volume — which is especially useful when markets move fast and scanning manually becomes impractical.
Some traders also prefer brokers or platforms optimized for low latency and tight spreads. Faster execution and lower commissions can make a measurable difference when trading intraday setups derived from projection lines.
Final notes on testing and implementation
Backtest the strategy on different symbols and timeframes before trading live. The indicator’s pattern matching can behave differently on stocks, forex, and crypto. Test correlated length values and the SS L baseline configuration to find what best fits your preferred timeframe.
Keep a trade journal. Record setups, why you entered or skipped a trade, and outcomes. Over time you will learn which market conditions the projection favors and which it does not.
FAQ
Is the projection guaranteed to be correct?
No. The projection is a probabilistic pattern-match, not a certainty. It finds past segments that resemble the present and projects the most similar continuation. Use it with trend and volume confirmation and proper risk management.
What is correlated length and how do I choose it?
Correlated length is the number of candles the indicator uses to compare current price action against historical segments. Shorter lengths capture short-term patterns; longer lengths look for broader structure. Test different values on your preferred timeframe to see which produces the most reliable projections.
Can I use this method on cryptocurrencies?
Yes. It works across markets, but crypto’s higher volatility and 24/7 trading mean you should adjust stops, position size, and correlated length accordingly. Using crypto spot trading signals can help filter the best coin pairs and timeframes where the projection and confirmations line up.
What timeframes work best?
The method is adaptable. Intraday traders may prefer shorter correlated lengths on 5m or 15m charts. Swing traders might use longer lengths on 1h or 4h. Always backtest on your chosen timeframe before trading live.
How should I size positions and manage risk?
Risk no more than a small percentage of your account on each trade. Place stop losses at logical swing points and size position based on distance to stop. If the projection hits your stop in its path to the target, skip the trade.
