

An anonymous macro trader known only as “No Limit” has been making waves by predicting a string of brutal market moves with uncanny precision. From calling the October peak to flagging the $60,000 local bottom, his recent public calls have tracked events that actually played out. Now he says the next stop for Bitcoin could be in the $45,000 to $50,000 range. This article breaks down his method, the data he leans on, the political risks that could accelerate a drop, and the counterarguments from large institutions and market makers.
Table of Contents
- Who is “No Limit” and why does his call matter?
- The framework behind the $45,000 target
- Why he thinks the market will fall: insider selling and capital flight
- The political wildcard: the Clarity Act and the fight over yields
- Counterarguments: why some smart money is staying put
- Technical support levels and the buy-the-dip case
- Putting it together: probability, timing, and risk management
- Practical rules to apply if you’re deciding what to do
- How does the time-based cycle model produce a $45,000 target?
- Is heavy insider selling proof that a market crash is coming?
- Could a failed or restrictive Clarity Act actually push Bitcoin to $45K?
- If Goldman Sachs and market makers still hold crypto, doesn’t that contradict the $45K thesis?
- Final takeaways
Who is “No Limit” and why does his call matter?
“No Limit” is anonymous. No full name, no face, no website—just an X handle and a trail of public posts. He claims decades of macro experience and a long trading track record, and while those claims are not independently verifiable, his recent public calls are.
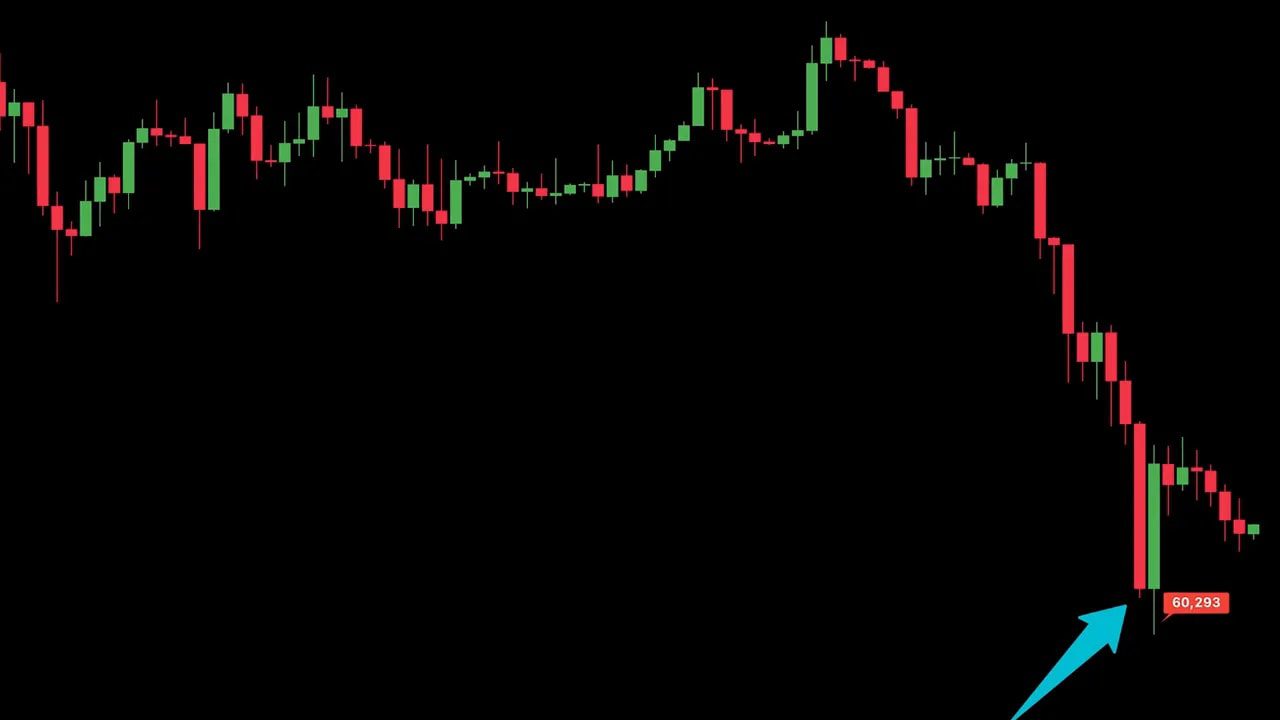
Over the past several months he publicly predicted major moves: an October top for Bitcoin, a sub-$60,000 decline within a specific time window, a local bottom around $80,000, a successful Zcash short, a warning on silver instability and an early exit from the market before a broad crash. Those calls coincided with real market moves, which is why his next prediction — $45,000 — has drawn such attention.
The framework behind the $45,000 target
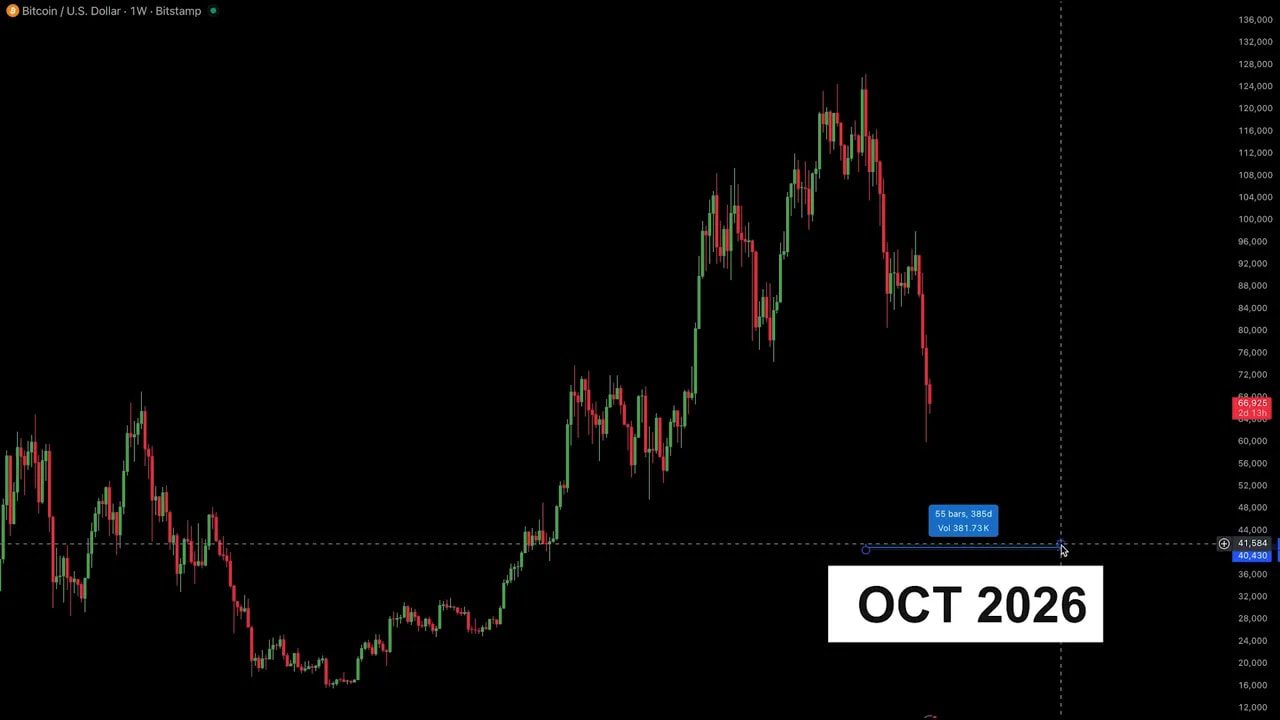
The target is not a random price plucked out of thin air. It’s the result of a time-based cycle model paired with key on-chain and macro indicators. Instead of only watching price levels (the vertical axis), this method tracks time after each Bitcoin halving and historical patterns in how long it takes the market to move from an all-time high to a cycle low.
The empirical observation: after every halving, the distance from the cycle high to the cycle low has tended to fall between roughly 363 and 406 days. Example cycles:
- 2012 cycle: ~406 days from ATH to bottom
- 2016 cycle: ~363 days
- 2020 cycle: ~376 days
Averaging these gives about 382 days. The most recent cycle high occurred in early October 2025, so applying the historical average points to a cycle bottom in late October 2026. That puts the broader thesis in line with a classic four-year cycle: the market often needs time to unwind liquidity, clear miner pressure, and allow weak hands to capitulate before a sustained recovery.
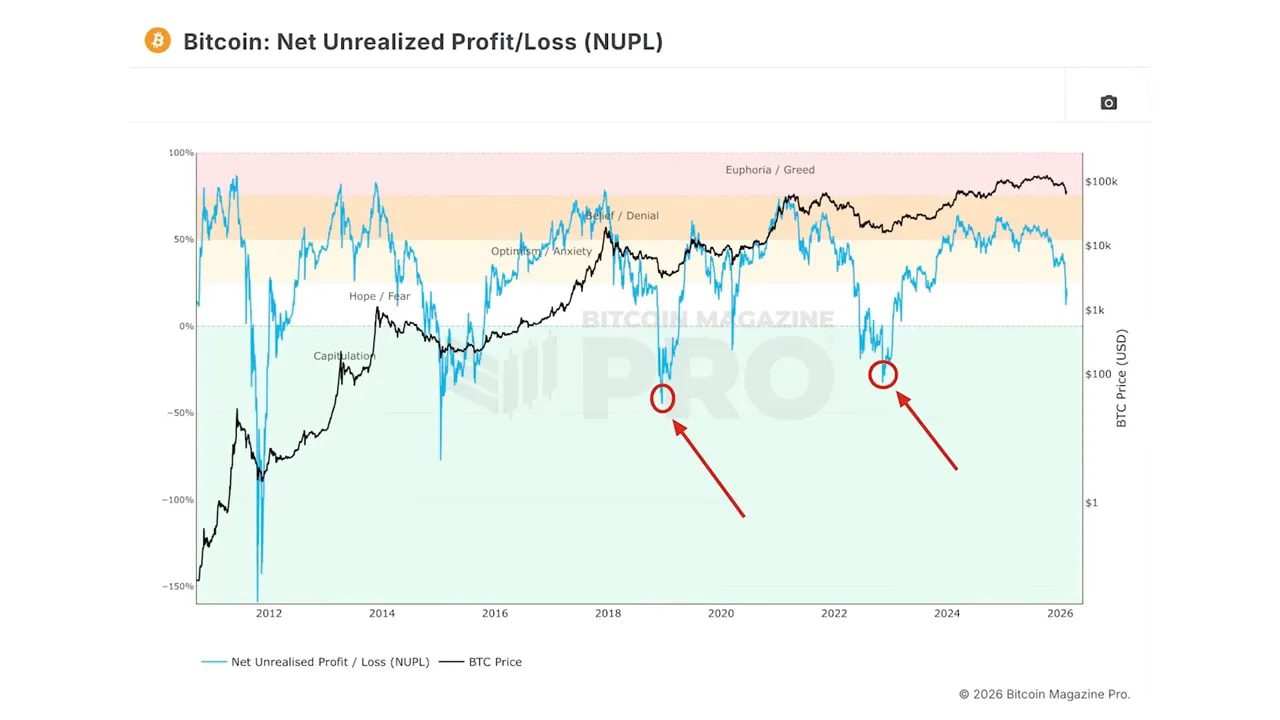
NUPL and “generational bottom” signals
A second pillar of the case is the Net Unrealized Profit/Loss indicator (NUPL). Historically, deep blue zones on this metric have coincided with generational buying opportunities (for example in 2018 and 2022). According to the timing model, we have not yet entered that blue zone in this cycle, implying more downside is possible before the market reaches a capitulation-style low.
Why he thinks the market will fall: insider selling and capital flight
The most worrying part of the thesis is not the charting math but the behavioral and macro signals. “No Limit” argues that the smart money is not buying this dip — they are exiting. The clearest evidence presented is extreme insider selling in public equities.
The insider buy-sell ratio (as tracked on public platforms) sits around 0.24, meaning roughly one insider purchase for every four insider sales. That’s the most lopsided ratio in about five years. And it is concentrated among top tech insiders: large block sales from founders and executives have totaled into the billions in recent months.
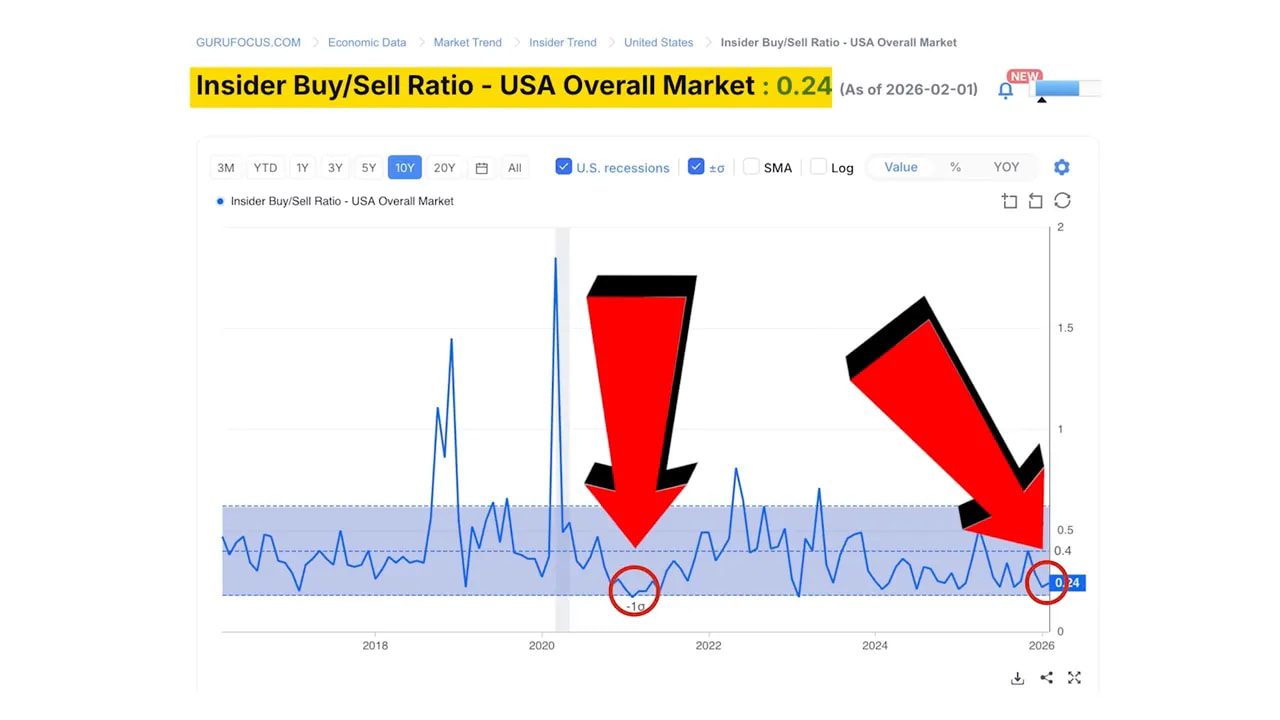
Many of these sales are executed under pre-planned formulas like 10b5-1 plans, but the timing parallels previous extremes that preceded large equity drawdowns. Late 2021 saw similar insider activity and a subsequent 25% drop in the S&P. Looking further back, extreme insider selling accompanied major drawdowns in other cycles.
Private companies racing to IPO
Another element amplifying his concern is the wave of mega private companies planning public listings this year — firms with combined private-market valuations approaching multiple trillions. The argument is straightforward: companies rarely IPO en masse because they desperately need capital; they IPO when they believe they are near a valuation peak and want to monetize private gains.
Add the enormous AI infrastructure build-out — hundreds of billions of dollars in capex so far — and the mismatch between that spend and realized revenue. If growth expectations need to justify massive prior investment, there is room for a valuation reassessment at the top, and that reassessment can spill over into risk assets, including crypto.

The political wildcard: the Clarity Act and the fight over yields
Market structure and regulation are potential catalysts that could push price lower quickly. The “Clarity Act” — proposed market-structure legislation intended to clarify crypto rules — has become politically contentious behind closed doors. Two White House meetings in early February brought together crypto firms on one side and major banks on the other, and apparently neither side came away satisfied.
According to the account, banks presented a proposal that would effectively ban yields on stablecoins — a direct attempt to neutralize competition to deposit products. That would hit a major component of crypto liquidity and business models. Public rhetoric from senior officials further strained negotiations, and there is now uncertainty about whether the bill will pass, or pass with punitive yield restrictions.

Timing matters: if regulatory outcomes remain uncertain or tilt against crypto — and if market structure changes reduce yield opportunities — low liquidity markets are especially vulnerable to sharp moves as participants scramble to reprice exposures.
Counterarguments: why some smart money is staying put
The bearish case is coherent, but it is only half the story. Large institutions and market makers present a different take.
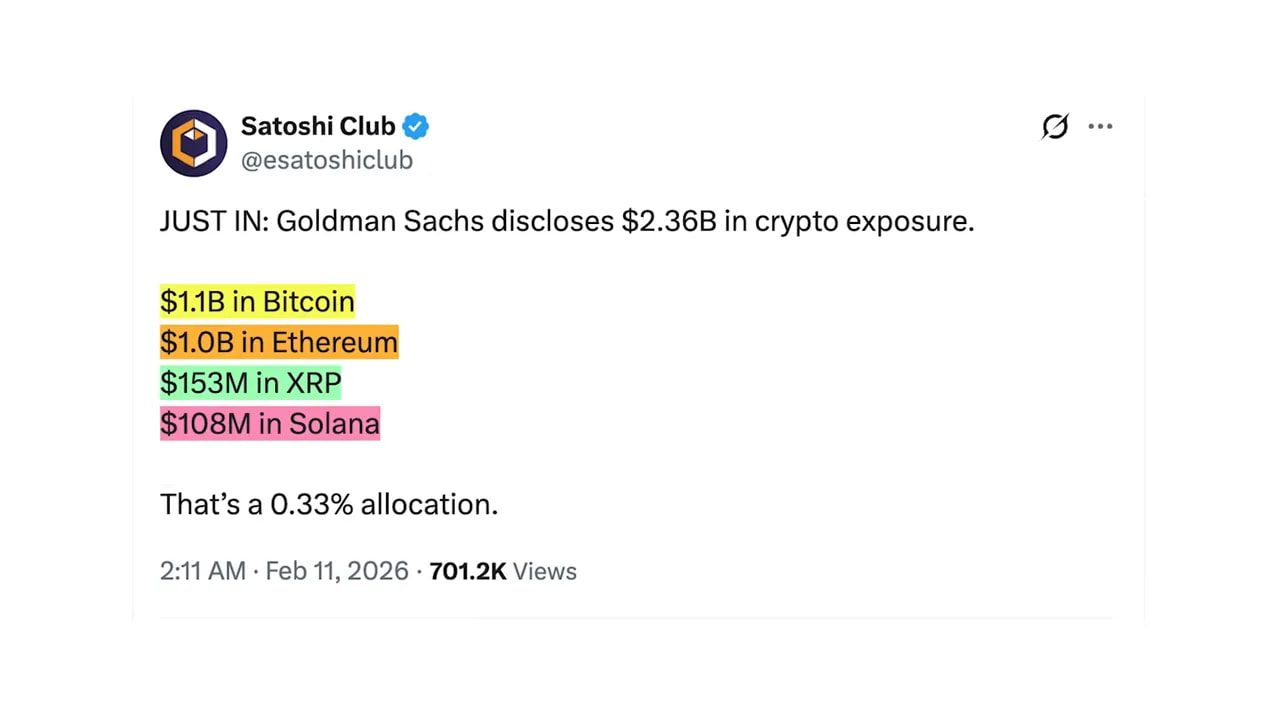
Goldman Sachs disclosed crypto holdings in the low billions, including a sizable Bitcoin position. They trimmed but did not exit. That suggests at least some major institutions view the current environment as dislocated but not terminal. Market makers like Wintermute argue the recent sell-off is macro driven and not a structural collapse of crypto markets; they expect liquidity to return and a recovery in the latter half of the year.
And the ETF flows tell a nuanced story. While headlines focused on outflows at certain points, there were meaningful net inflows in early February — especially on the day prices brushed $60,000. Long-term holders and large wallets (the ones controlling tens of millions of dollars in Bitcoin) have been active buyers during the dip. Put simply: where public-market insiders are selling equities, there are whales and institutional pockets quietly accumulating crypto exposure.
Technical support levels and the buy-the-dip case
Several long-term technical reference points are frequently cited by market participants.
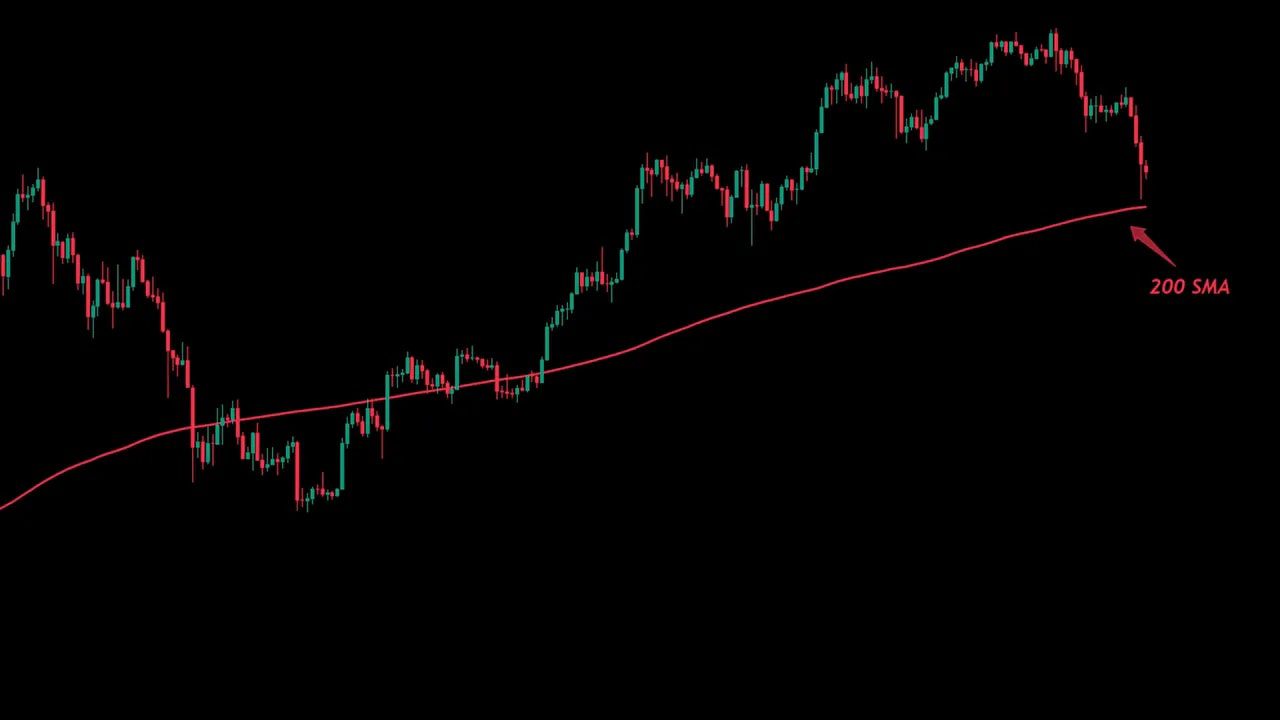
- 200-week moving average — currently around the high $50,000s. This moving average has historically acted as support during multi-year cycles.
- CVDD and realized price gap patterns — cycles often briefly dip below a CVDD-type blue line, then build support between that and the realized price. These patterns repeat across cycles.
Those technicals help explain why $60,000 was a psychologically and technically meaningful level. They also shape the buy-the-dip argument: if a $45,000 dip aligns with historical cycle lows, it can also represent a generational opportunity for long-horizon buyers who scale in and manage risk.
Putting it together: probability, timing, and risk management
There are three core inputs to weigh:
- Timing model — historical halving-to-bottom windows favor a later 2026 low, and that timeline implies more time for downward mean reversion if current patterns hold.
- Behavioral and macro signals — extreme insider selling and private company IPO behavior can presage equity stress that spills into crypto.
- Political and regulatory risk — market-structure bills and bans on stablecoin yields could materially reduce liquidity and alter business models quickly.
On the other side, institutional accumulation, market-maker analysis, and ETF inflows create a plausible path for a recovery if liquidity conditions improve and regulatory outcomes are not overly punitive.
What this means for different types of participants
- Long-term holders — a $45,000 dip would be a buying opportunity to dollar-cost average into a multiyear view.
- Short-term traders — the low-liquidity environment increases volatility and execution risk. Tight risk controls and position sizing are essential.
- Institutional allocators — the divergence between public insider selling and private crypto accumulation argues for careful macro hedging and scenario planning rather than blind conviction either way.
Practical rules to apply if you’re deciding what to do
- Don’t follow a single guru blindly. Past hits do not guarantee future accuracy. Treat signals as inputs, not verdicts.
- Scale in. If you believe in crypto’s long-term story, plan purchases across price bands instead of a single lump sum.
- Diversify risk. Keep allocation sizes that won’t necessitate forced liquidation in a drawdown. Consider mixing spot, dollar-cost averaging, and options for defined downside risk.
- Monitor liquidity and regulatory headlines. Low liquidity amplifies market moves; regulatory decisions (especially on stablecoin yields) can be immediate triggers.
- Use stop-losses and hedges. If you trade actively, prefer clear stop rules or hedges to protect capital in a fast-moving market.
How does the time-based cycle model produce a $45,000 target?
The model uses historical days-from-ATH-to-cycle-bottom after Bitcoin halving events. The average window across prior cycles is roughly 382 days. Combined with on-chain indicators (like NUPL) and historical price patterns that show how deep markets typically drop during capitulation phases, the range of $45,000 to $50,000 is derived as the plausible realized-price support zone consistent with prior cycles.
Is heavy insider selling proof that a market crash is coming?
No single metric is proof. Insider selling is a concerning signal because executives have more information about company prospects. However, many sales are pre-planned (10b5-1). Insider selling should be viewed alongside other indicators — liquidity, macro conditions, valuations, and on-chain flows — to assess probability rather than certainty.
Could a failed or restrictive Clarity Act actually push Bitcoin to $45K?
Yes, regulatory outcomes that sharply reduce stablecoin yields or otherwise remove key liquidity plumbing could create rapid fear, uncertainty and doubt. In a low-liquidity environment, that uncertainty can compress prices quickly as participants rush to de-risk. Timing and severity would depend on the final language and market response.
If Goldman Sachs and market makers still hold crypto, doesn’t that contradict the $45K thesis?
Not necessarily. Institutional holdings indicate conviction over certain time horizons and strategies. Institutions may hold through volatility for long-term exposure, hedging, or client demand. Their positions do counterbalance the sell narrative but do not eliminate downside risk from systemic catalysts or liquidity shocks.
Final takeaways
The $45,000 call is not an empty prediction — it is the product of a time-based cycle model, on-chain indicators, behavioral signals from equity insiders, and a vivid regulatory risk scenario. Each of those inputs is plausible on its own; together they make a compelling bearish case that cannot be dismissed.
Equally valid are the counters: institutional accumulation, ETF inflows during dips, market-maker analysis that views the move as macro-driven and temporary, and historically significant technical support like the 200-week moving average. That tension is the market you are watching.
For anyone with exposure to crypto, the practical response is simple: treat predictions as data, not gospel. Plan allocations, manage risk, and be ready to act objectively if markets offer a generational buying zone — or to protect capital if liquidity spirals and regulatory outcomes worsen. Both scenarios are plausible; positioning and discipline are what separate outcomes.
Take care of your risk, and keep the long view in mind even while you manage the short-term noise.
