

The RSI Scalping Strategy presented here is built for quick decisions on lower timeframes. It combines the RSI with a few trend and signal filters, a clear stop loss rule, and a four-step take profit plan that scales out of positions. The goal is simplicity with discipline: precise entries, strict risk control, and a repeatable exit routine.
Table of Contents
- What you need
- Indicator settings (exact)
- Entry rules — the checklist
- Risk management and the four-step take profit plan
- Live trade flow (how this looks in practice)
- Backtesting and performance notes
- Practical tips
- How strict must I be with the indicator settings?
What you need
This setup uses four indicators available on most charting platforms:
- RSI (Relative Strength Index) with a moving average overlay
- BJ Superscript (signal dots/labels)
- Chandelier Exit for buy and sell signals
- 200-period EMA to define trend direction
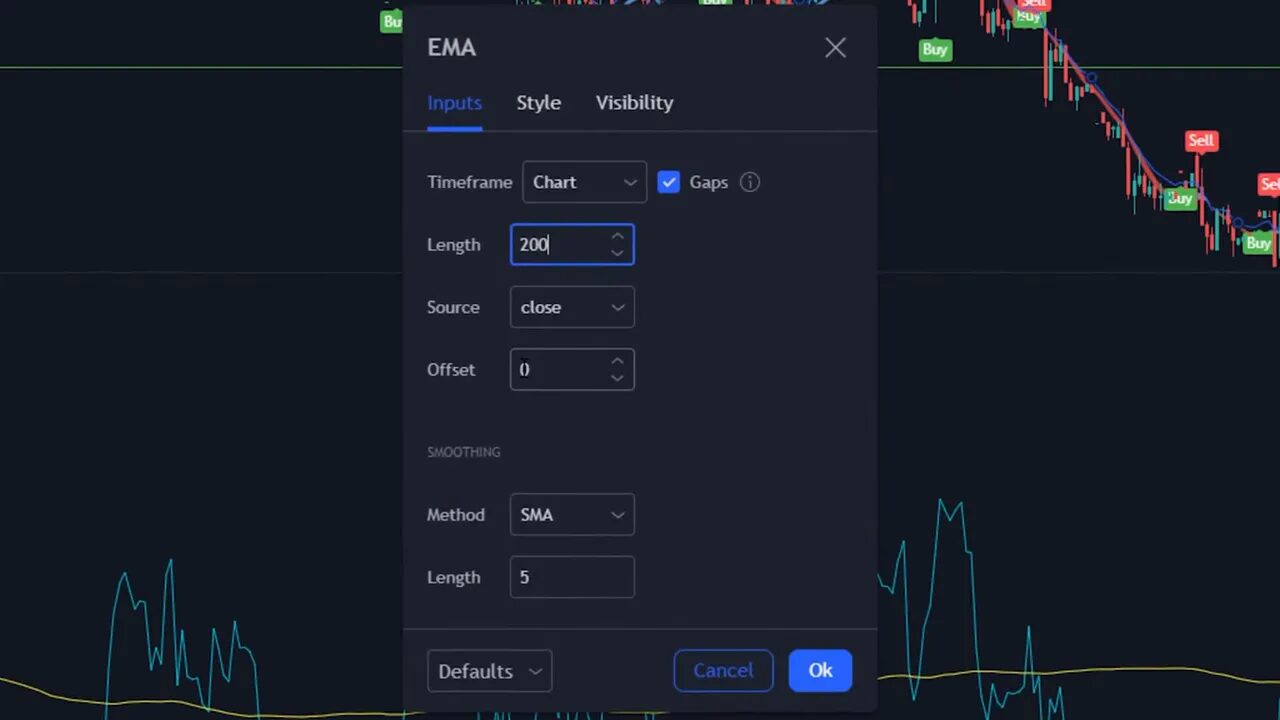
Indicator settings (exact)
To reproduce the strategy exactly, change these settings before trading.
- Chandelier Exit: ATR period = 1, ATR multiplier = 2.3. Hide the default buy/sell label boxes and set label positions for clarity.
- BJ Superscript: change the value parameter from 5 to 6. Turn off all style boxes and raise opacity of the lines slightly so signals are visible but not noisy.
- RSI: length = 25. Add an SMA of the RSI with MA type = SMA and MA length = 150. Adjust colors to distinguish the RSI line and its SMA.
- EMA: use a 200-period exponential moving average on price. Color it so it stands out on the chart.
Entry rules — the checklist
Only enter when every item in this checklist is true. This keeps the system clean and avoids random entries.
- Chandelier Exit issues a buy signal.
- BJ Superscript shows a blue (buy) signal.
- The RSI line crosses above its SMA line (RSI 25 crossing above RSI SMA 150).
- Price is above the 200 EMA, confirming an uptrend.
When all four conditions are met, enter the trade and place the stop loss at the most recent swing low. For shorts, invert the rules: sell signal from Chandelier, red BJ Superscript, RSI crossing below its SMA, and price below the 200 EMA. Place the stop loss at the recent swing high.
Risk management and the four-step take profit plan
The RSI Scalping Strategy emphasizes partial scaling out to capture multiple levels of profit while protecting capital.
- Divide the position into four equal parts at entry.
- Take profits sequentially at risk-to-reward ratios of 1:1, 1.5:1, 2:1, and 3:1.
- After each target is hit, sell one quarter of the position and move the next target outward to the next R:R level.
- Stop loss remains at the original swing low (or can be trailed once certain targets are hit depending on risk tolerance).

Example with a $1,000 position: sell $250 at 1:1, another $250 at 1.5:1, another $250 at 2:1, and the final $250 at 3:1. This method locks in gains while allowing a portion of the trade to capture bigger moves.

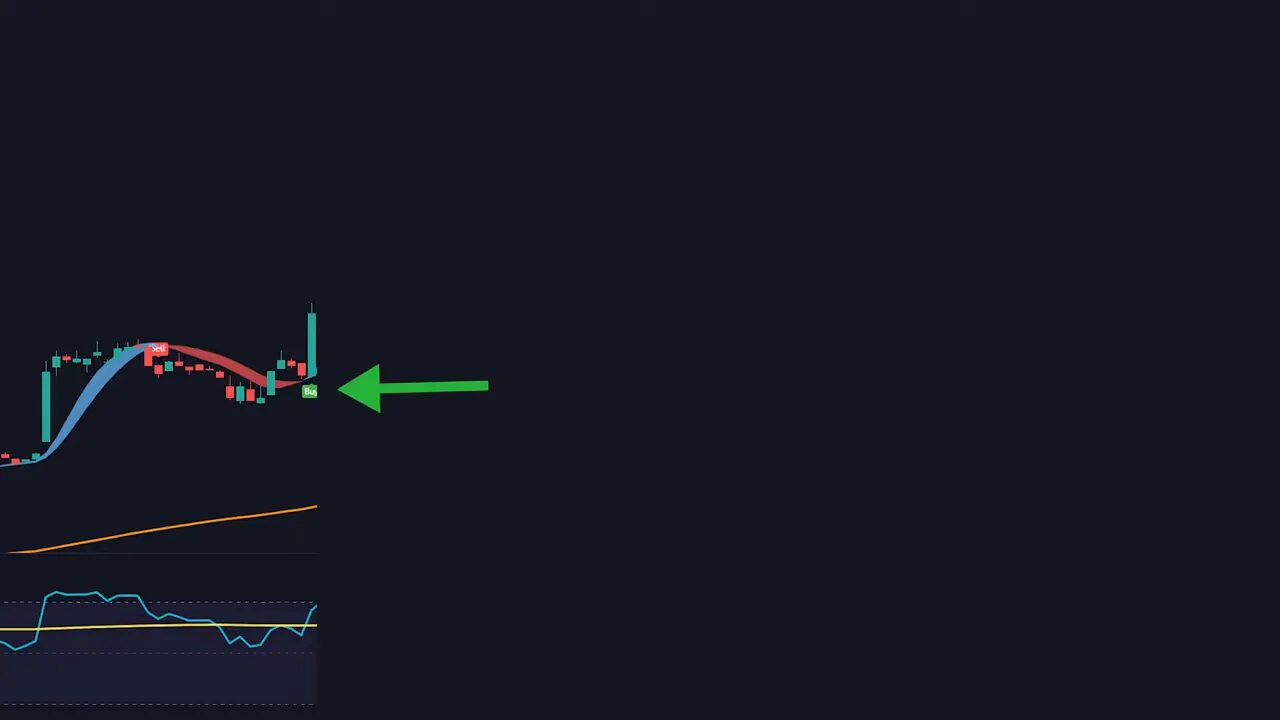
Live trade flow (how this looks in practice)
Step 1: Confirm the buy checklist. Step 2: Enter and set stop at the recent swing low. Step 3: Place the first take profit at 1:1 and wait. If price hits it, sell 25% and move the next target to 1.5:1. Repeat until all four targets are reached or the stop loss is hit.
This approach reduces emotional decisions because the exit plan is predefined and mechanical. It also improves the chance of exiting with a net profit even if later targets fail, because earlier partial exits have already locked in gains.
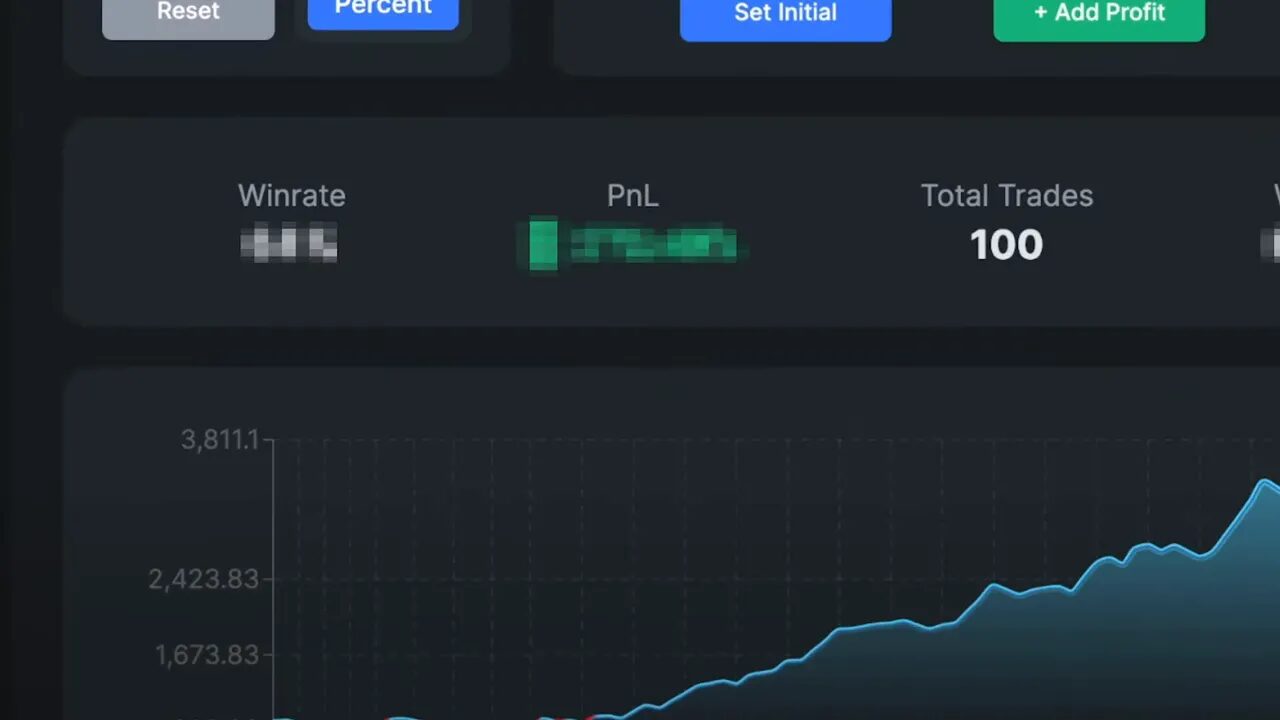
Backtesting and performance notes
Testing a strategy repeatedly on real market data reveals behavior patterns and edge. Backtests should record timeframe, win rate, number of wins and losses, and net profit. Running the RSI Scalping Strategy over 100 trades can show whether the edge holds in the chosen market and timeframe. If testing manually or using a plain-English automation tool, ensure the exact indicator parameters and rules are implemented consistently.
Practical tips
- Timeframe choice matters. Scalping works best on lower timeframes but requires quick execution and discipline.
- Slippage and fees will affect real results. Include them in any backtest or trade simulation.
- Record everything in a trading journal: entry, stop, targets, and outcome for each of the 100 tests to learn patterns.
- Adaptation is fine. If a parameter consistently underperforms, consider small, methodical adjustments and retest.
How strict must I be with the indicator settings?
Use the exact settings to reproduce the strategy’s tested behavior. Small tweaks may be valid, but any change should be retested over a significant sample before using real capital.
Can this RSI Scalping Strategy be automated without coding?
It is possible to automate using platforms that accept plain-English rules. These services let you type the entry and exit logic and run backtests or live automation without writing code.
What position sizing should I use?
Position sizing depends on your risk per trade and account size. A common approach is risking a fixed percentage of the account on the stop loss. Always size positions so that a single stop loss does not threaten account risk limits.
How do I handle losing streaks?
Expect losing streaks. Follow the rules, reduce size if a strategy underperforms beyond expected variance, and review the journal to identify any execution errors or market regime changes.
