

The goal of this RSI Scalping Strategy is to provide a clear, rule-based approach for trading short-term moves while keeping risk management front and center. The setup uses four indicators, a strict entry checklist, and a layered take-profit system that lets you lock in gains as momentum runs. This method is designed for lower timeframes and scalping, but the core ideas apply wherever you prefer to trade intraday.
Table of Contents
- What you need and how to set it up
- Entry rules — the checklist
- Risk management and the four-step take-profit plan
- Live example: how a trade unfolds
- Backtesting and performance tracking
- Practical notes and tips
- FAQ
What you need and how to set it up
This strategy runs on TradingView and relies on four indicators:
- RSI (Relative Strength Index) with a custom smoothing
- BJ superscript indicator for trend/signals
- Chandelier Exit to generate buy and sell signals
- 200-period Exponential Moving Average (EMA) to define trend direction
Indicator settings (exact)
- Chandelier Exit: style show only buy and sell labels; ATR period = 1; ATR multiplier = 2.3
- BJ superscript: uncheck visual boxes; set input value to 6; increase line opacity slightly
- RSI: length = 25; add a moving average to the RSI with MA type = SMA and MA length = 150; hide other lower panel visuals for clarity
- EMA: set length = 200 (use a contrasting color such as orange)
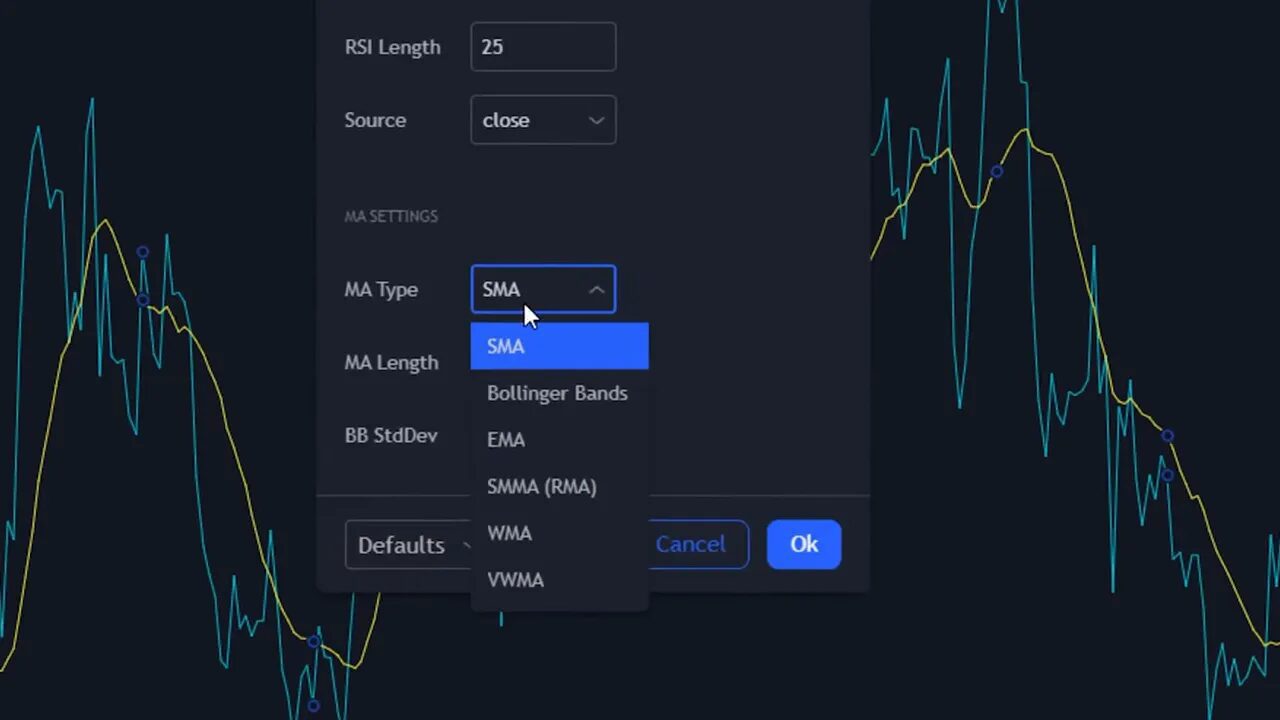
These adjustments tighten signals and make the RSI behavior easier to read on fast charts. The combination of a longer RSI MA and the 200 EMA helps filter noise so trades align with higher-probability momentum.

Entry rules — the checklist
Trades are only taken when every condition below is met. This stacked checklist reduces guesswork and enforces discipline.
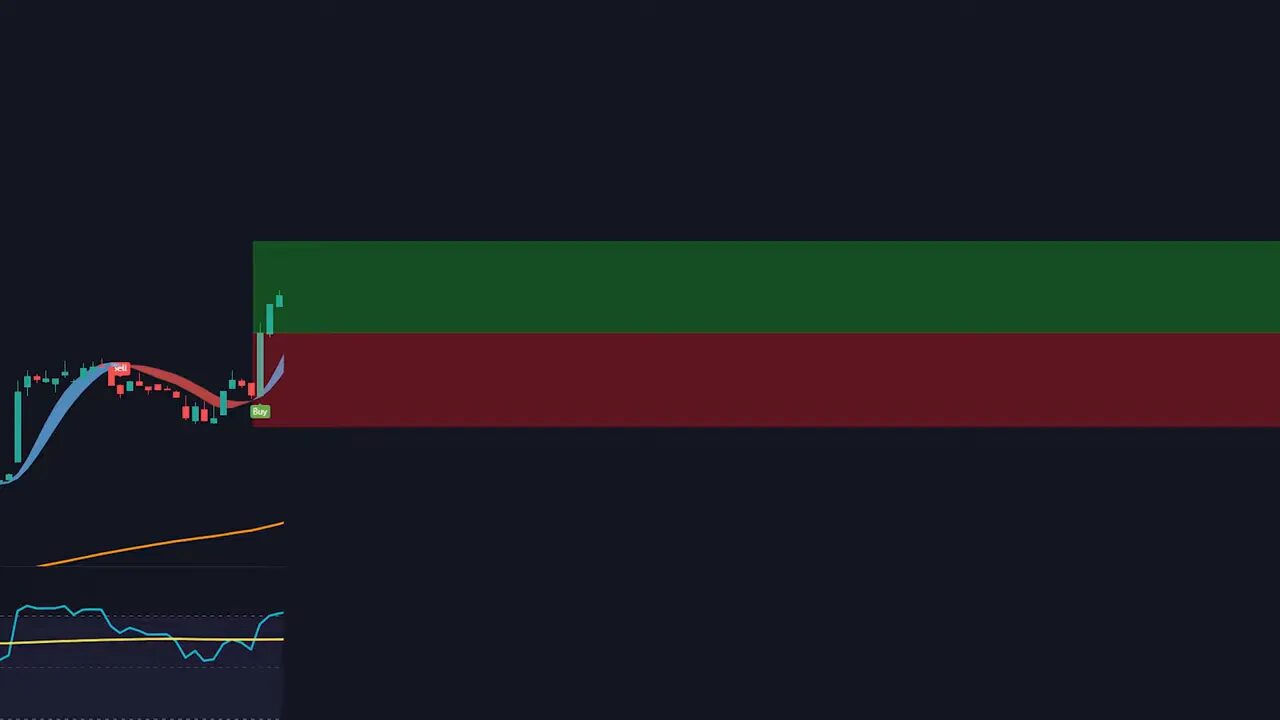
- Chandelier Exit shows a buy signal (visual label)
- BJ superscript is showing the bullish color (blue)
- RSI line (fast) crosses above its SMA (the RSI moving average)
- Price is above the 200 EMA (ensures trend is up)
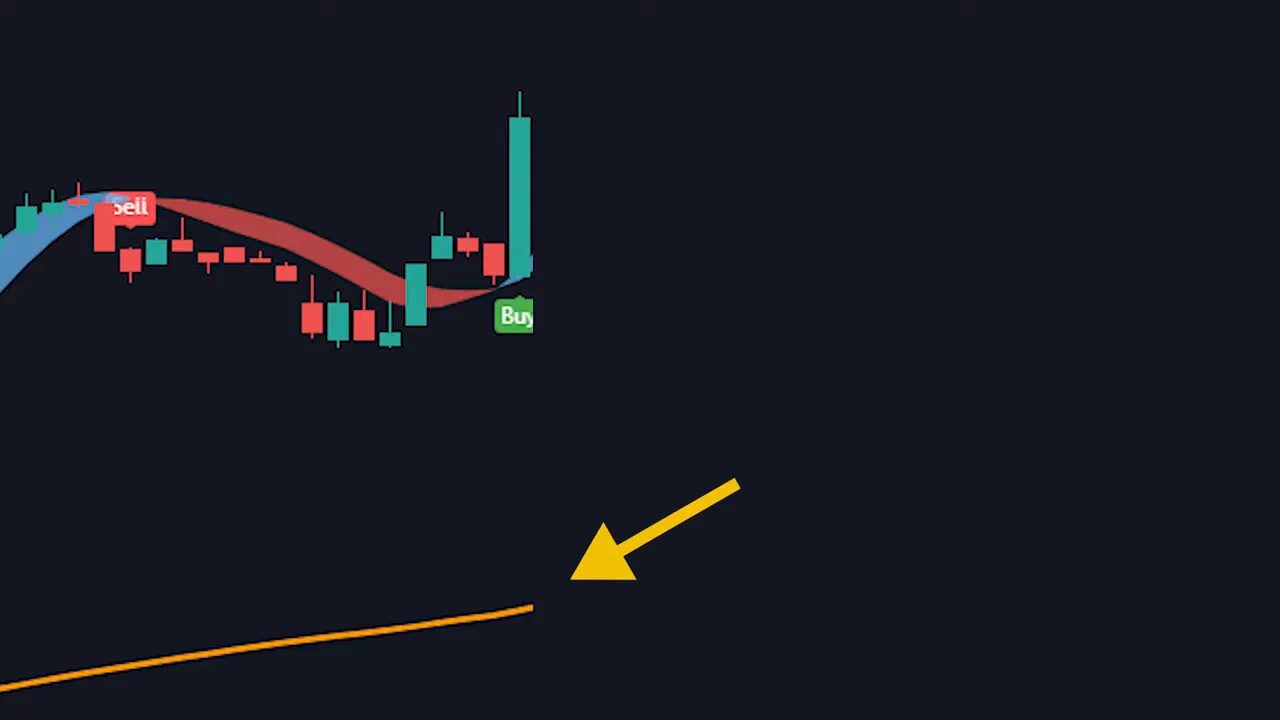
When all four conditions line up, enter long. Place the stop loss at the most recent swing low. For shorts, reverse the rules: chandelier sell signal, red superscript, RSI crossing below its SMA, and price below the 200 EMA. Place the stop at the recent swing high.
Risk management and the four-step take-profit plan
A reliable exit plan matters as much as the entry. This approach uses four staggered take-profit targets and reduces risk as the trade moves in your favor.
- Divide your position into four equal parts.
- Set take-profit targets at 1:1, 1.5:1, 2:1, and 3:1 risk to reward.
- At each target hit, sell one quarter of the original position and move the next target accordingly.
- Keep the initial stop loss at the swing low until the structure allows tightening it.
This method locks profits incrementally while letting the largest portion ride for the biggest potential move. It is especially useful on volatile crypto pairs where momentum can produce chunky runs after a clean entry.
When reviewing market opportunities and trade set ups across blockchains, having a reliable pulse on momentum helps. A subtle but effective way to complement this strategy is to follow curated crypto signal feeds that highlight setups meeting these criteria across multiple tokens. A targeted crypto signal can surface potential trades that already match the checklist so you can evaluate them faster and act when conditions align.
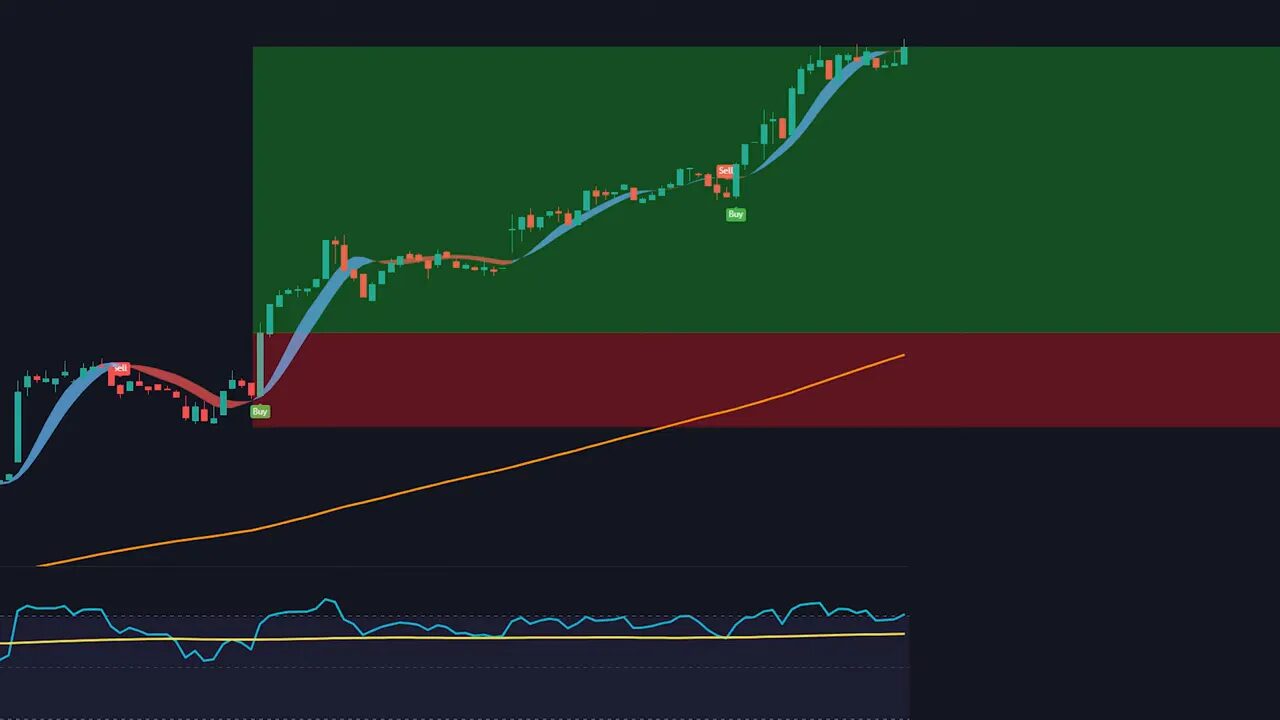
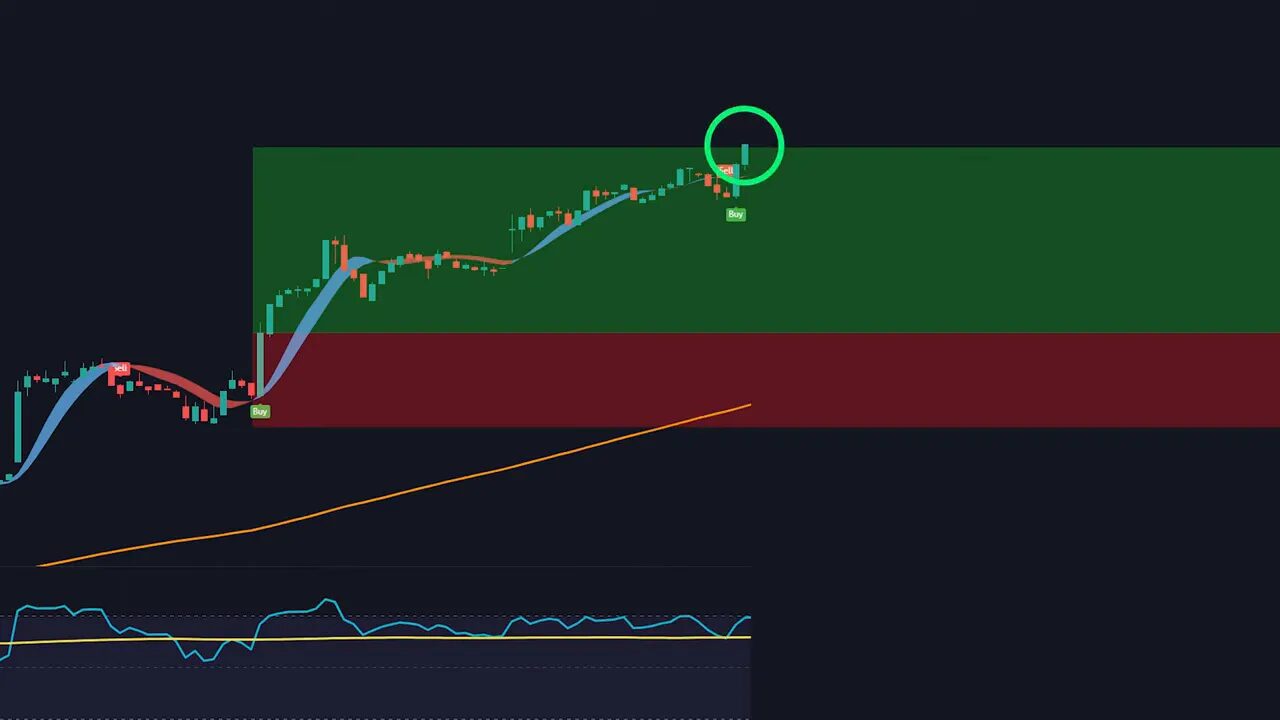
Live example: how a trade unfolds
Imagine the setup appears and you enter at point A with a stop at the swing low. Price hits the 1:1 target; you sell 25 percent. It then runs to 1.5:1; sell another 25 percent. When it reaches 2:1, sell a third tranche. If it ultimately makes 3:1, you exit the final piece with a clean, scaled profit. The staging of exits smooths equity curve volatility and improves psychological management of winners and losers.
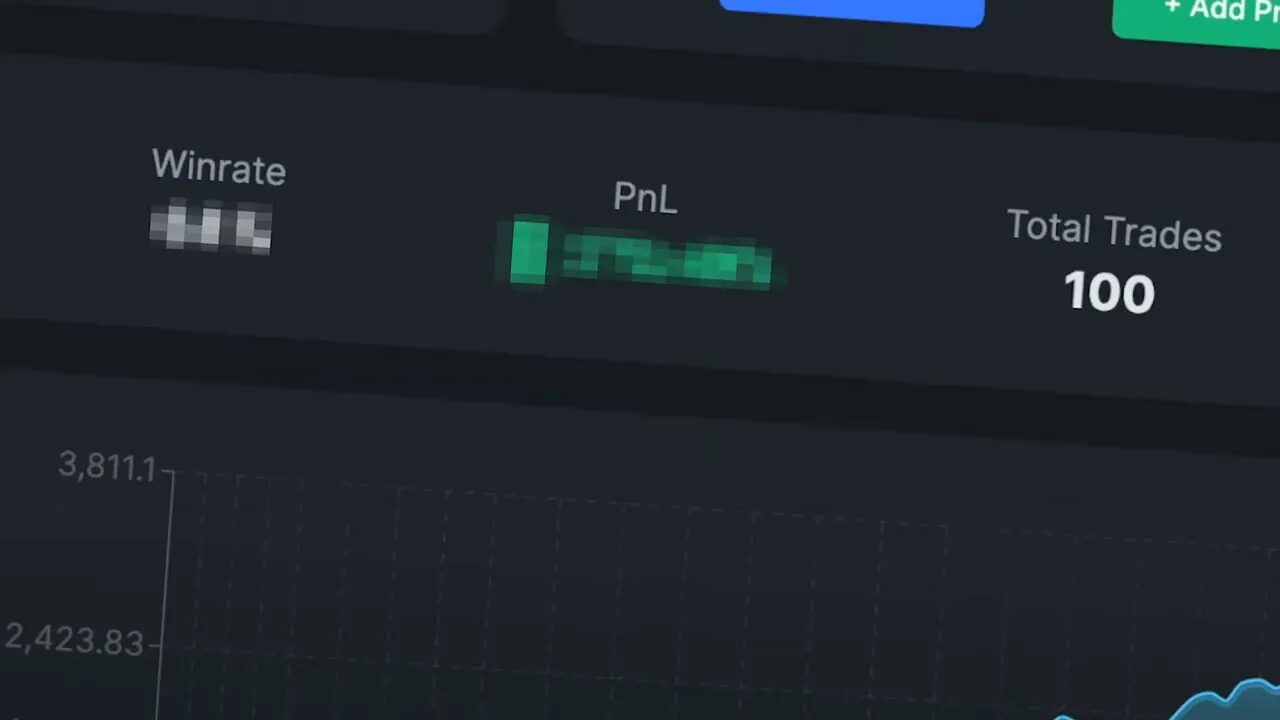
Backtesting and performance tracking
Testing rules repeatedly is the only way to know how a strategy behaves across different market regimes. Running a 100-trade backtest on real market data provides insights such as win rate, average return, and drawdown behavior. Keep a trading journal with timestamps, entries, exits, and rationale. That data drives improvements and tells you if the approach fits your style and account size.
Practical notes and tips
- Timeframe: works best on lower timeframes for scalping, but test on your preferred charts first.
- Slippage and fees: account for exchange fees and slippage when sizing positions and setting targets.
- Trade size: size positions so a full loss equals a small percentage of capital—never risk more than you can comfortably lose.
- Automation: if you want to automate rules without coding, consider plain-English backtesting tools that convert instructions into executable trades.
FAQ
What timeframe is best for this RSI Scalping Strategy?
Lower timeframes are recommended for scalping, but you should backtest on the specific timeframe you plan to trade because execution costs and noise differ between 1-minute, 5-minute, and 15-minute charts.
Which indicator settings are most important?
The most important settings are the RSI length = 25 with an SMA of 150, chandelier ATR period = 1 with multiplier 2.3, BJ superscript set to 6, and a 200 EMA for trend. Those values tune noise reduction and trend alignment.
How should I place my stop loss?
Place the stop loss at the recent swing low for longs or the recent swing high for shorts. Adjust only when price structure clearly invalidates the original risk.
Is the four-step take-profit better than a single target?
Layered targets help lock in gains, reduce emotional pressure, and let you capture larger moves while still securing partial profits early. It often produces a smoother result compared with a single hard target.
How can I find setups quickly across many tokens?
Use scanners or curated crypto signal services that filter for the criteria you use. Signals can surface candidates that already meet the checklist so you can evaluate them efficiently across chains and pairs.
