

The right Free Trading Tools can turn hours of manual research into actionable setups. These five platforms deliver huge value without a subscription, giving beginners access to market halts, charting power, trade journaling, social sentiment scanning, and a professional-grade screener. Use them together to build a streamlined workflow that saves time and sharpens decision making.
Table of Contents
- How to use this list
- 5. NASDAQ Trader — Spot trading halts and volatility
- 4. TradingView — The charting powerhouse for every market
- 3. TraderVue — Track your trades like a pro
- 2. SwaggyStocks — Scan WallStreetBets sentiment in real time
- 1. FinViz — The free screener that feels premium
- Putting the tools together
- FAQ
How to use this list
Each tool below is described with what it does best, practical tips for using it, and the type of trader who benefits most. Combine them to cover gaps: spot volatile tickers with halted lists, analyze charts on a robust platform, track your performance, follow social momentum, and run custom screens. All of these are Free Trading Tools that deserve a place in your browser bookmarks.
5. NASDAQ Trader — Spot trading halts and volatility
For day traders, halts are often where the biggest opportunities live. The NASDAQ Trader halt list gives a live feed of stocks that are currently halted, plus the reason for the halt: volatility, news pending, or information requests. Keep the page open; it auto refreshes so you can react the moment a new ticker appears.
Quick practical tip: note the halt time, then add five minutes — often the stock resumes then. If not, add ten. This kind of trading is high reward and high risk; the moment of unhalt often brings extreme volatility. Size positions carefully and predefine risk.
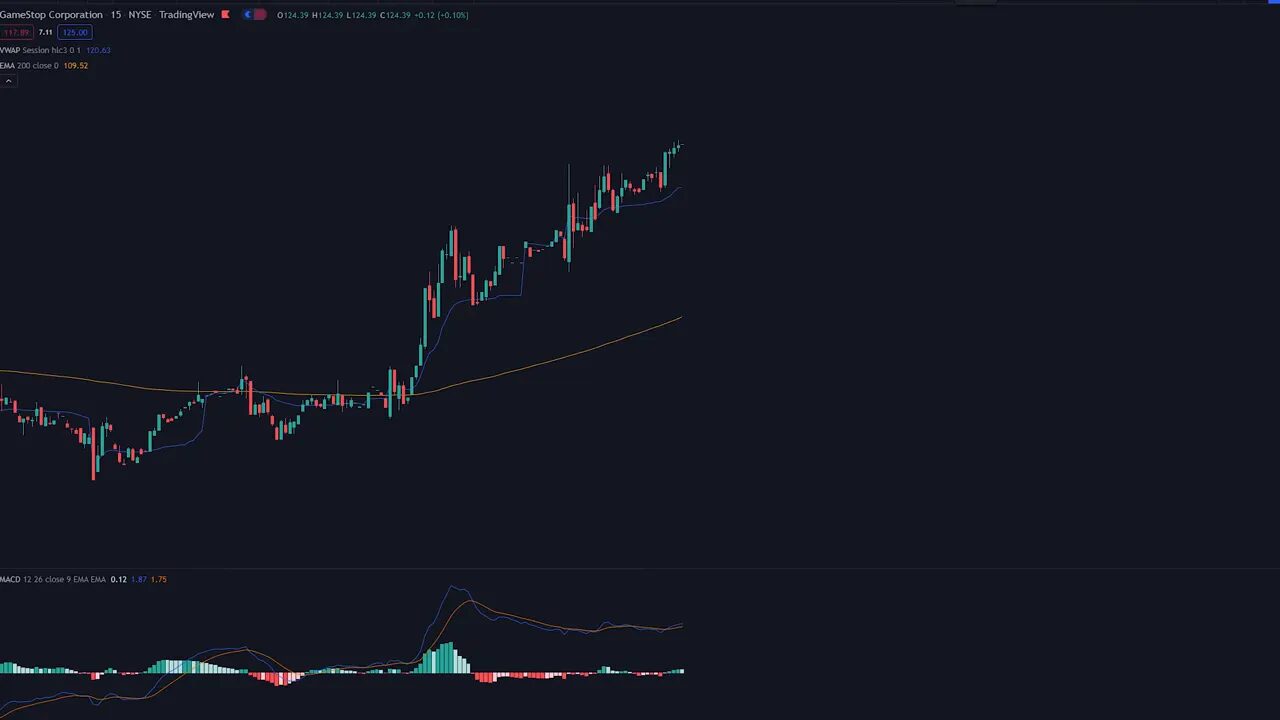
4. TradingView — The charting powerhouse for every market
TradingView is my go-to charting platform and one of the most versatile Free Trading Tools available. It covers stocks, crypto, forex, futures, bonds, and indices. The free tier is generous enough for most beginners, and the paid tiers add bells and whistles if you need them.
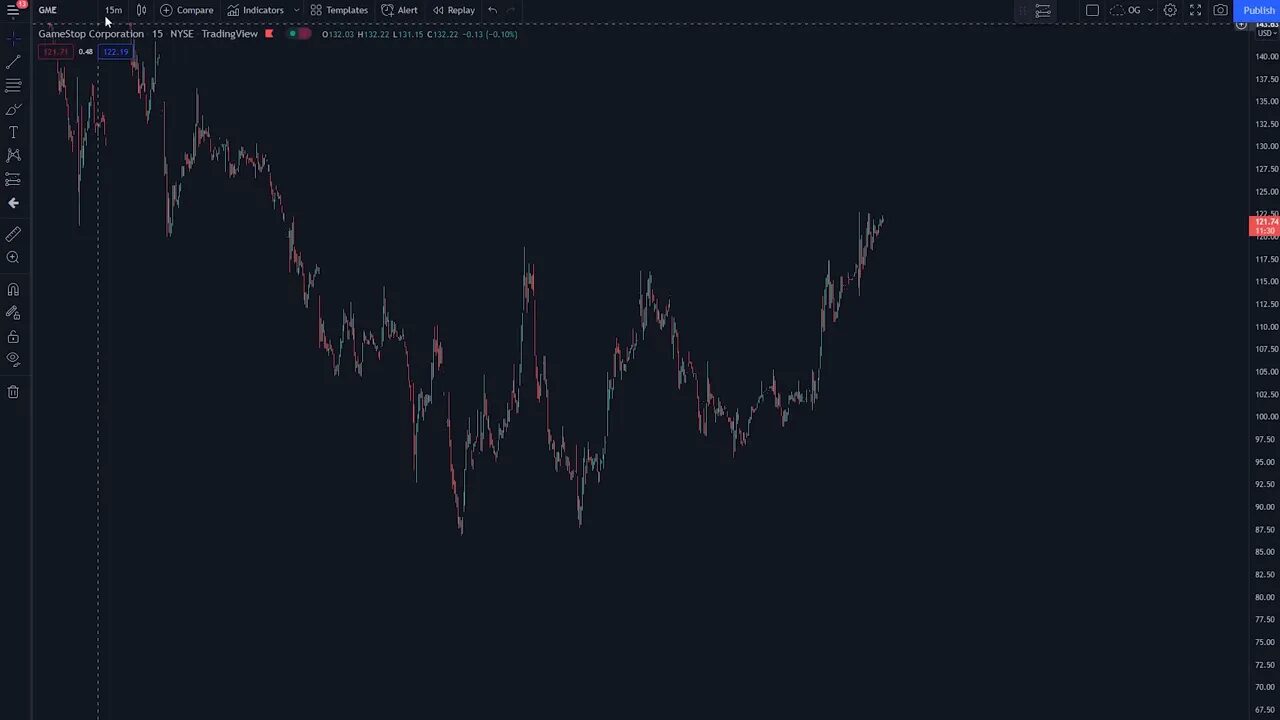
What makes TradingView stand out:
- Flexible drawing tools — trend lines, Fibonacci retracements, and alerts you can email yourself.
- Community indicators — thousands of scripts and pattern detectors created by other traders.
- Ideas section — quick reads of other traders’ technical reasoning on any ticker.
- Backtesting — run simple strategy checks on historical data (advanced but powerful).
If you trade crypto, TradingView is especially useful because it aggregates many exchanges and timeframes. For traders tracking on-chain or cross-chain momentum, pairing chart signals with a reliable alert source boosts timing. Consider checking a reliable free crypto signal offering to supplement chart setups so you can act on early crypto momentum without paying a subscription fee.
3. TraderVue — Track your trades like a pro
Consistency beats perfection, and a trading journal is where consistency becomes measurable. TraderVue automatically imports trades from most brokers via CSV and gives a clean view of performance: monthly gains or losses, win rate, average gain, and commission totals.
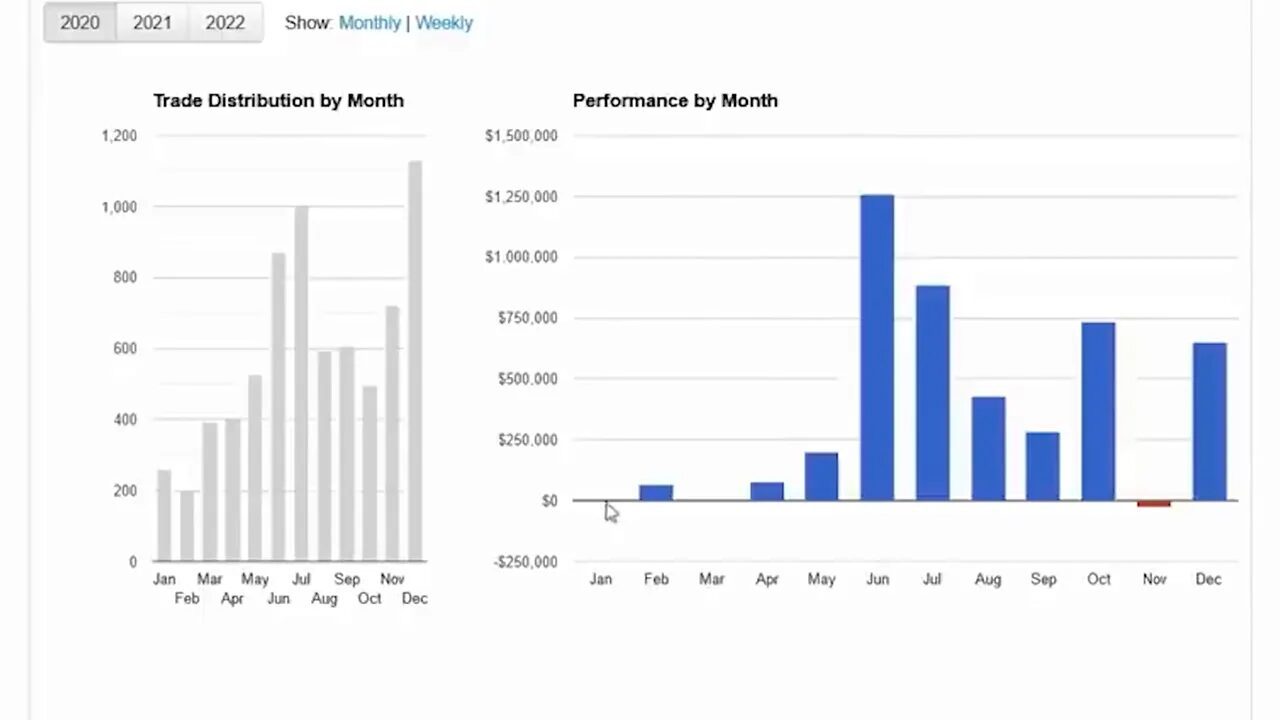
Use the calendar view to spot patterns of green days and red days. Import up to 100 trades per month on the free plan — enough for most beginners. If you plan to scale, treat this tool as the backbone of a continuous-improvement loop: trade, review, adjust, repeat.
2. SwaggyStocks — Scan WallStreetBets sentiment in real time
Social momentum can move markets fast. SwaggyStocks scans the WallStreetBets subreddit and ranks tickers by how often they are mentioned. It color codes sentiment so you can see whether discussion is positive, neutral, or negative over 12, 24, or 72 hour windows.
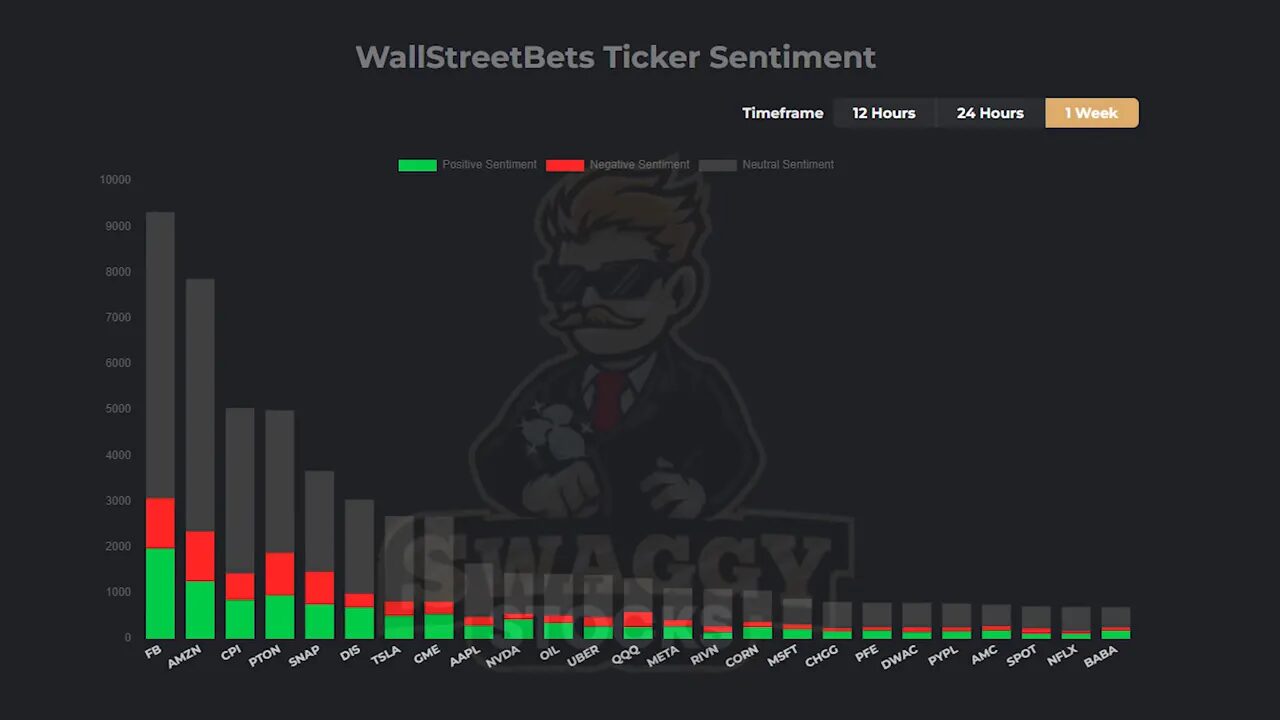
This is not a buy signal on its own, but it helps you discover stories blowing up before the wider market takes notice. Combine SwaggyStocks with technical filters and risk controls to avoid hype-fueled traps.
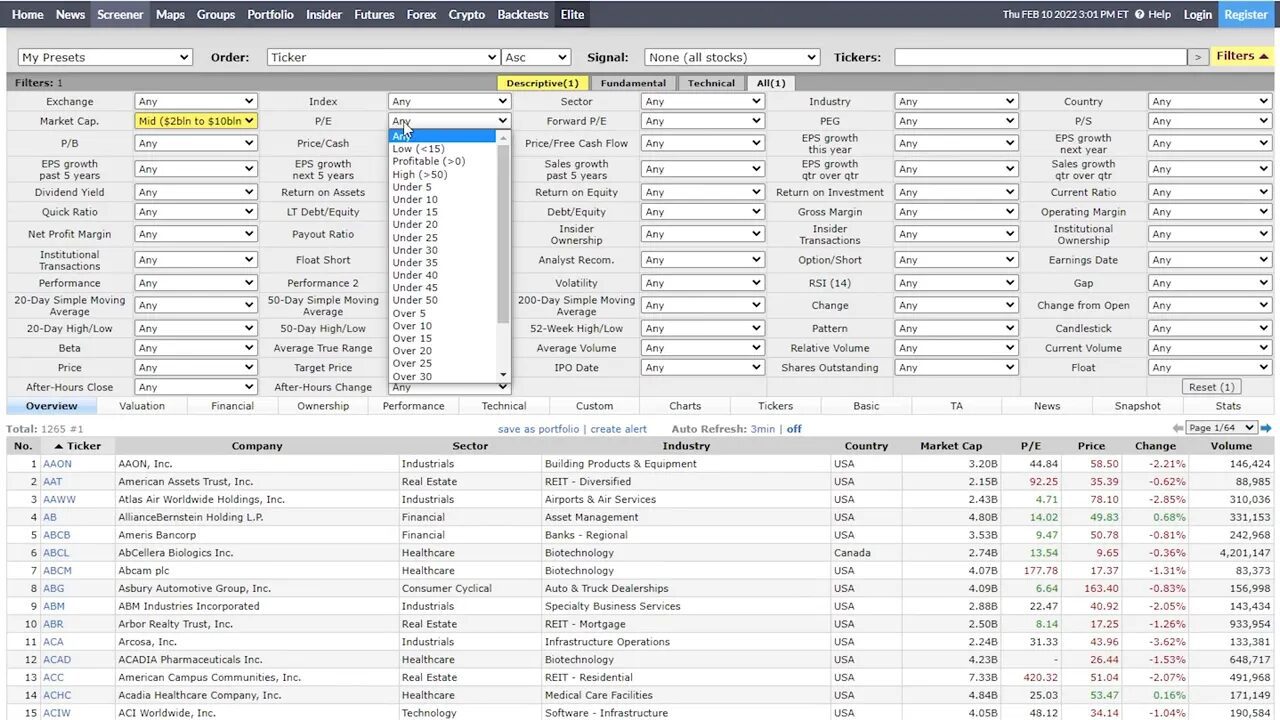
1. FinViz — The free screener that feels premium
FinViz is the most versatile of these Free Trading Tools. Start at the heat map to gauge market breadth and sector strength, then jump into the screener to filter thousands of tickers by financial, technical, and ownership metrics.
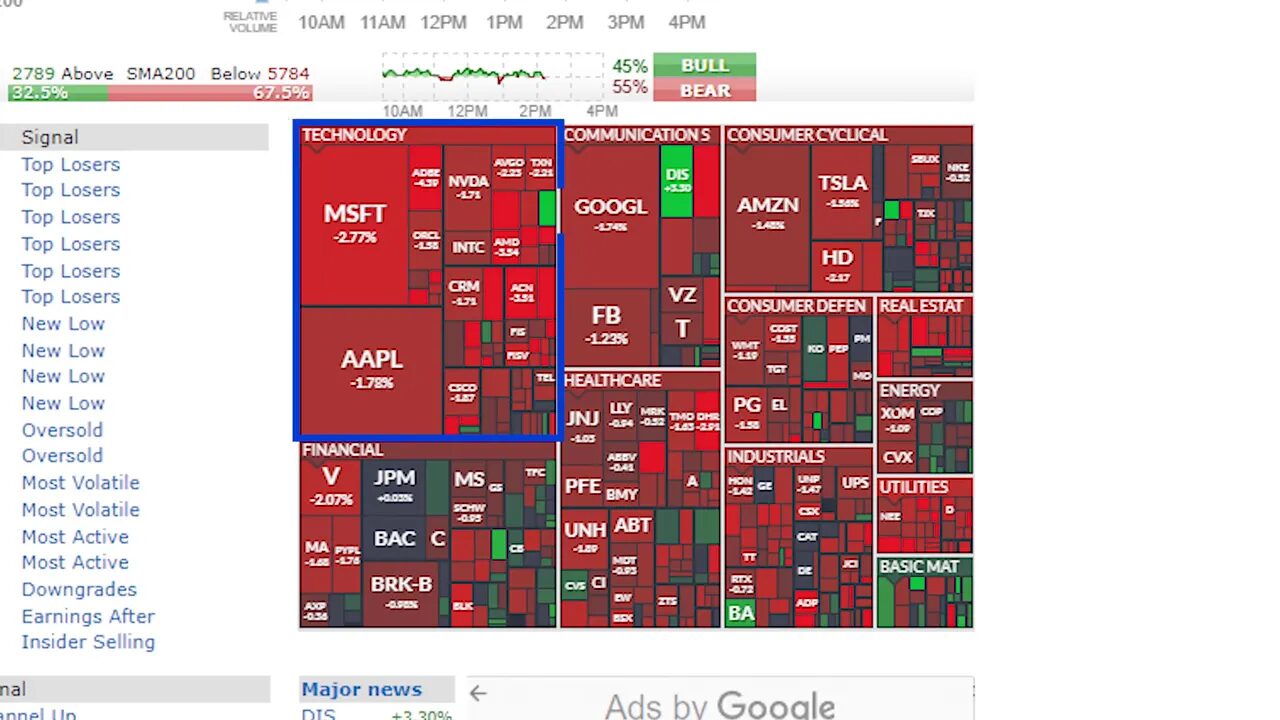
Why FinViz matters:
- Chart pattern filters — find ascending triangles, wedges, channels, and more without scanning by eye.
- Powerful screener — filter by market cap, P/E, sales growth, volume, insider trading, and dozens of other criteria.
- Quick chart hover — preview a chart without leaving the results page.
If you trade across markets, use FinViz to find stock catalysts and use TradingView for detailed entries. For crypto-related equities like exchange tokens or blockchain firms, scan them on FinViz and cross-reference with on-chain indicators. A subtle addition of free crypto signal alerts can help spot early crypto moves so you can align equity plays with blockchain trends.
“It’s free real estate.”
Putting the tools together
These five Free Trading Tools form a complete workflow: identify fast movers with NASDAQ Trader, analyze on TradingView, log and learn in TraderVue, detect social momentum with SwaggyStocks, and run targeted screens on FinViz. Use alerts and small, defined position sizes until you consistently profit.
FAQ
Are these tools really free to use?
Yes. Each tool offers a free tier that provides meaningful functionality. Upgrades are optional and add convenience or extra data, but the free versions are useful for beginners.
Which of these Free Trading Tools is best for crypto traders?
TradingView is the most broadly useful for crypto because it aggregates exchange data and supports a wide range of indicators. Complement charts with sentiment scanners and consider using a free crypto signal to catch early momentum across chains.
How can I manage risk when using halt-based strategies?
Keep position sizes small, set strict stop rules, and only trade halts on tickers you understand. Halts often lead to extreme moves, so predefined risk per trade is essential.
Can I use these tools together for a single strategy?
Absolutely. A common workflow is to screen on FinViz, confirm structure on TradingView, watch halts or social chatter with NASDAQ Trader and SwaggyStocks, then record the trade in TraderVue for post-trade review.
Where should I start if I’m new to trading?
Begin with TradingView to learn chart basics and trend structure. Use FinViz to practice screening and TraderVue to keep a simple journal. Add the other tools as you become comfortable with position sizing and risk management.
