

Table of Contents
- Overview: a simple, repeatable 5-step day trading plan
- Why this works
- Quick visual: marking liquidity zones
- Step-by-step: the 5 steps
- Live trade walkthrough
- Checklist before you press trade
- Risk management and practical tips
- FAQ
- Final notes
Overview: a simple, repeatable 5-step day trading plan
I used a focused, rules-based approach and turned a clear setup into consistent wins over a two month stretch. The strategy is built around identifying liquidity zones, trading only during the early market window, and using a tight, sniper-style entry on the one minute chart. The core elements are simple: define liquidity, wait for a break, drop to a smaller time frame, confirm a market structure shift and a fair value gap, then enter with a well-defined stop loss and take profit.
Why this works
This approach combines three proven concepts: liquidity pools, market structure shifts, and fairness gaps created by fast directional moves. By restricting trades to a specific time window and using a precise entry technique, the setup improves risk reward and reduces random, low-probability entries. It is designed for active day traders using a five minute chart to spot the move and a one minute chart to execute the entry.
Quick visual: marking liquidity zones
Start by marking the swing low and swing high that form the liquidity zone. This zone will be the area price looks to probe or break into.
Step-by-step: the 5 steps
-
Step 1 — Mark the liquidity zones
On the five minute chart, draw levels at the chart’s recent high and low to define the liquidity zone. These levels represent where stop orders and resting liquidity commonly collect. Treat them as the boundaries for the next steps.
-
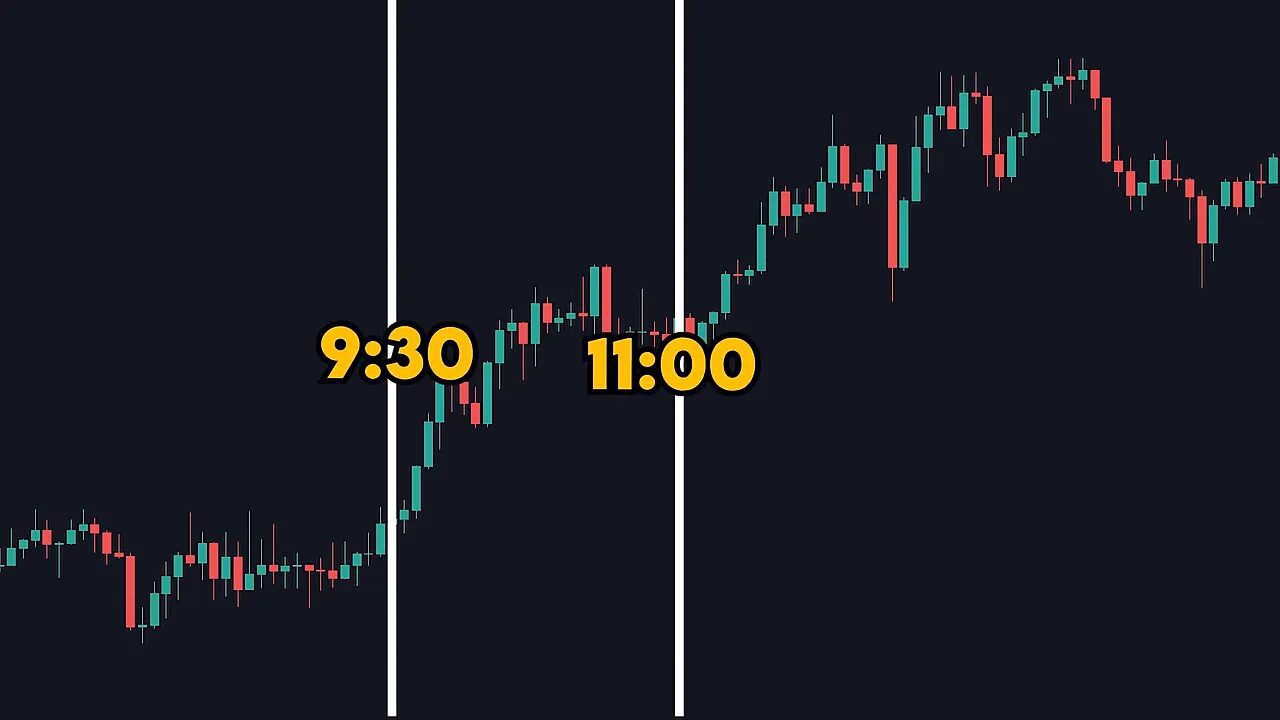
Step 2 — Only trade between market open and 11:00 ET
Place two vertical markers from 9:30 to 11:00 Eastern. This early session is where the strategy is valid. If the set conditions form outside this window, skip the trade. The restriction reduces noise and focuses on the highest-probability period for the pattern.
-
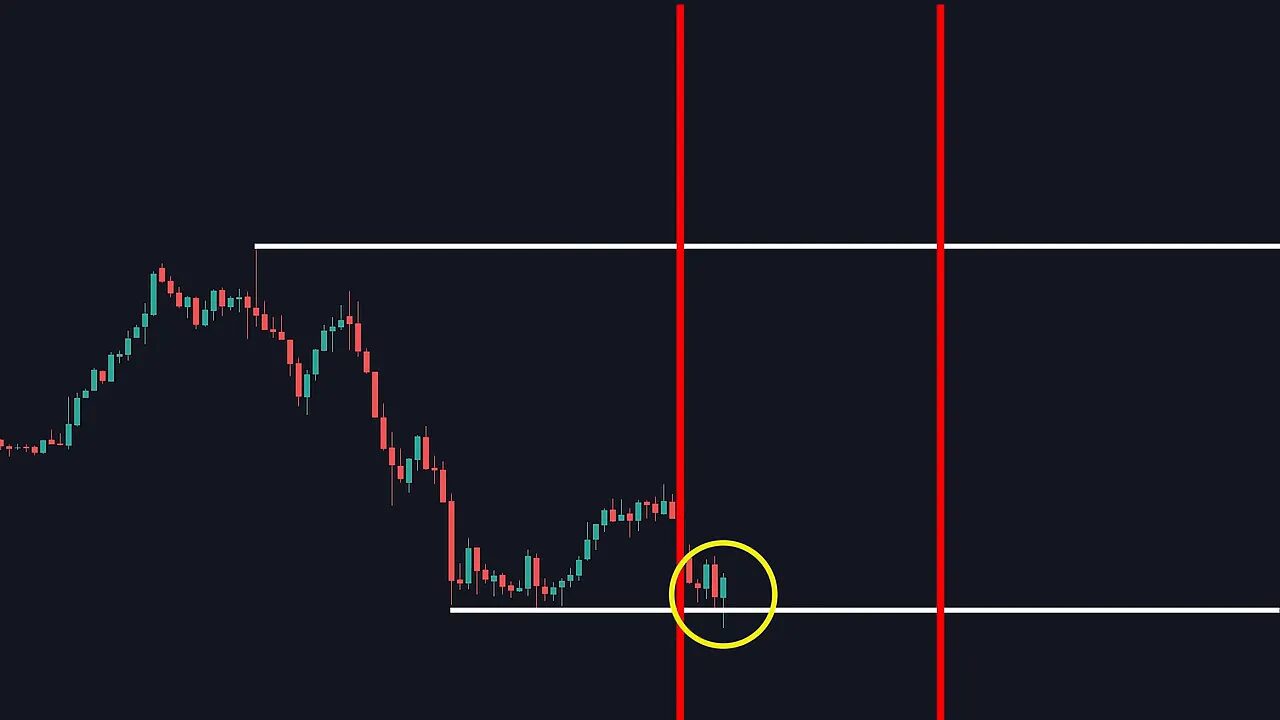
Step 3 — Wait for a liquidity break
Price must break one of the marked liquidity zones. A break lower signals a long opportunity; a break higher signals a short. Do not chase partial probes; wait for a clear break before proceeding.
-
Step 4 — Drop to one minute and confirm market structure
After the break, switch to the one minute chart to find a sniper entry. Identify the pivot point: the previous swing (for example the previous lower high). Only consider an entry when price breaks that pivot, indicating a market structure shift.
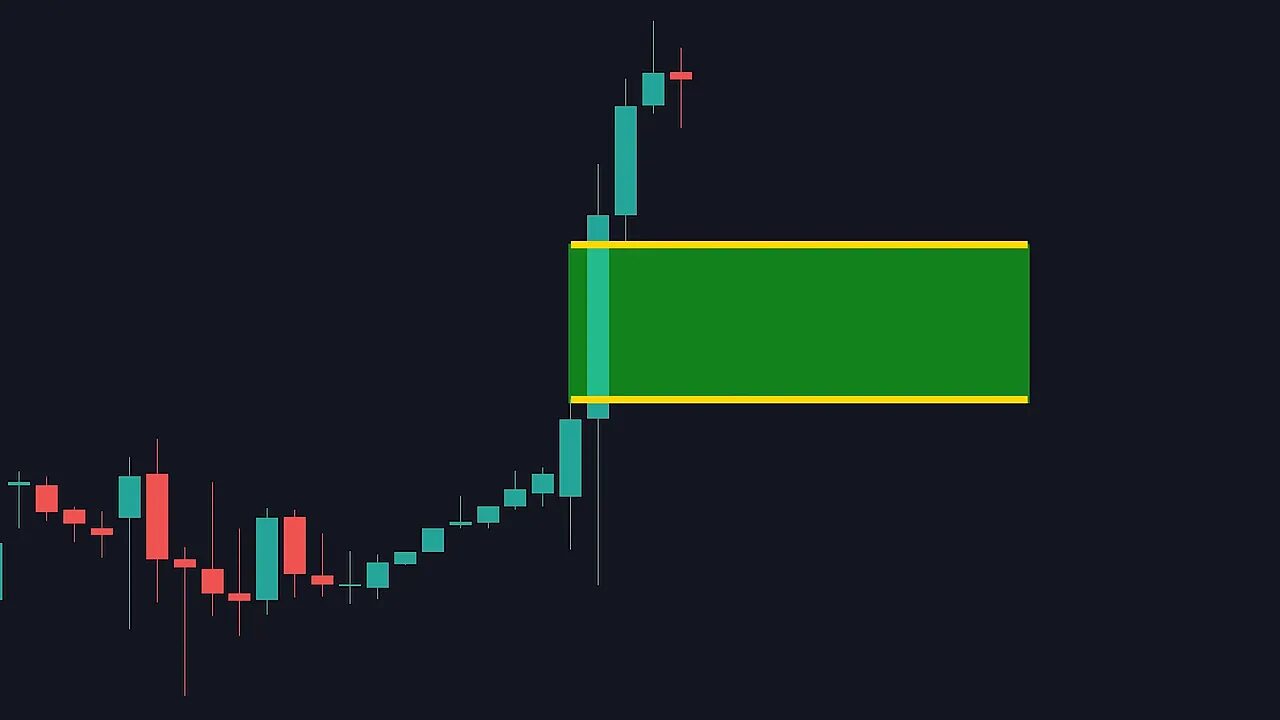
Also require a fair value gap — a fast candle that creates a gap between the candle before and the candle after. Mark the top of the first candle and the bottom of the second candle to define the gap. If no fair value gap is created, do not enter.
-
Step 5 — Place your entry, stop loss, and take profit
Set a limit buy or sell order inside the fair value gap. Two common placements:
- Middle of the fair value gap for a better risk reward
- Top (for longs) or bottom (for shorts) of the gap for higher probability of fill
Place the stop loss just below the low of the fair value gap candle. For a more conservative stop, place it below the low of the entire move. Set take profit at the opposite liquidity level you marked in Step 1.
Live trade walkthrough
Here is how the rules come together in a real trade:
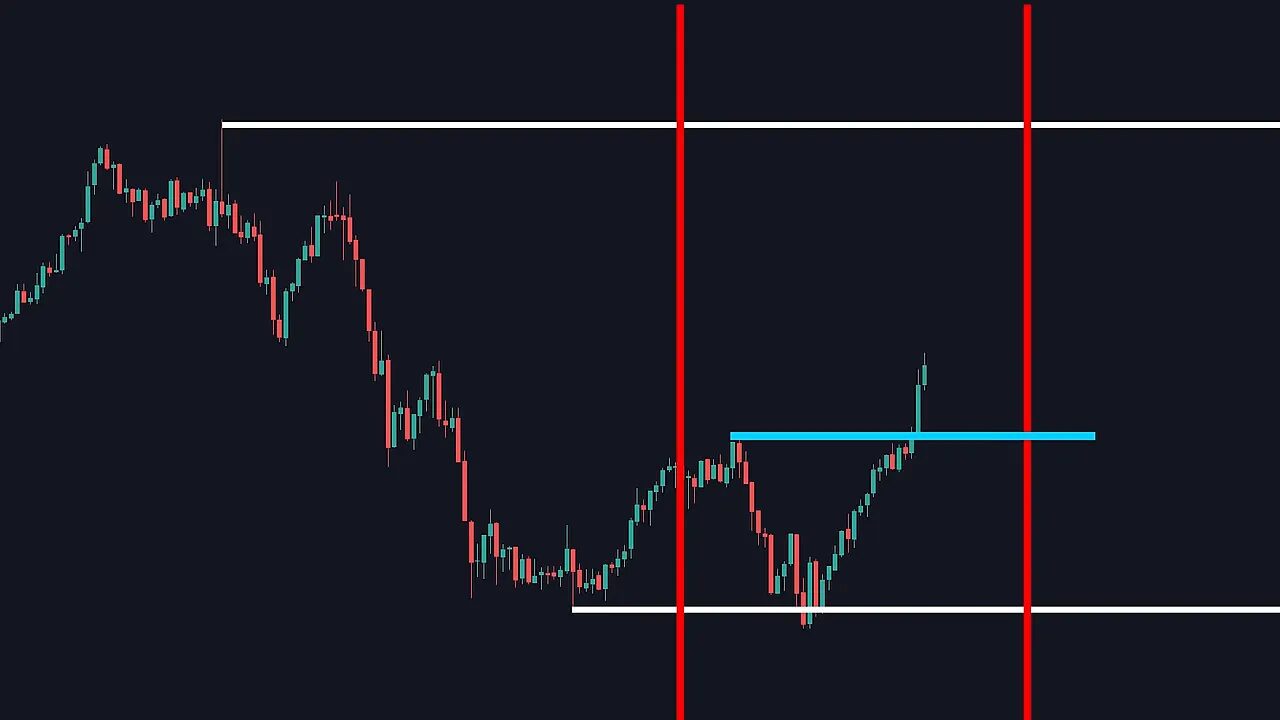
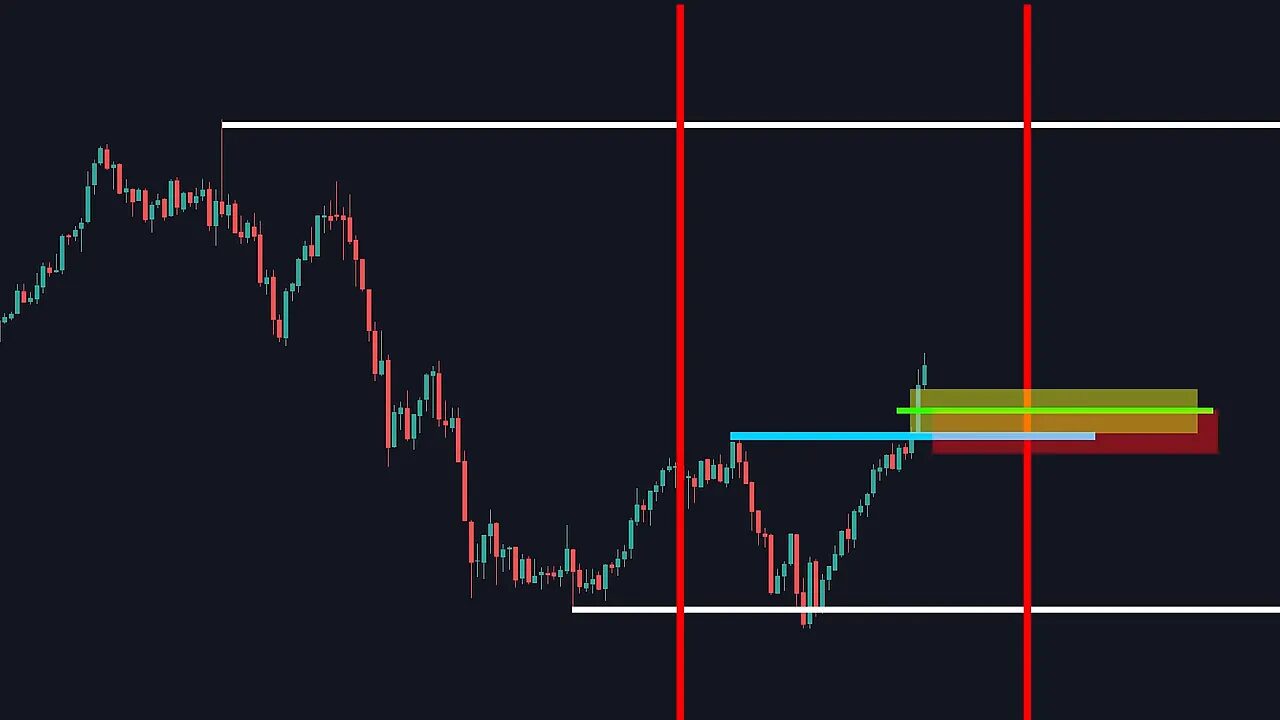
- Five minute chart shows a defined liquidity zone and the session markers are in place.
- Price breaks the lower liquidity zone, signaling a long setup.
- Switch to one minute. Price breaks the pivot (previous lower high) confirming a market structure shift.
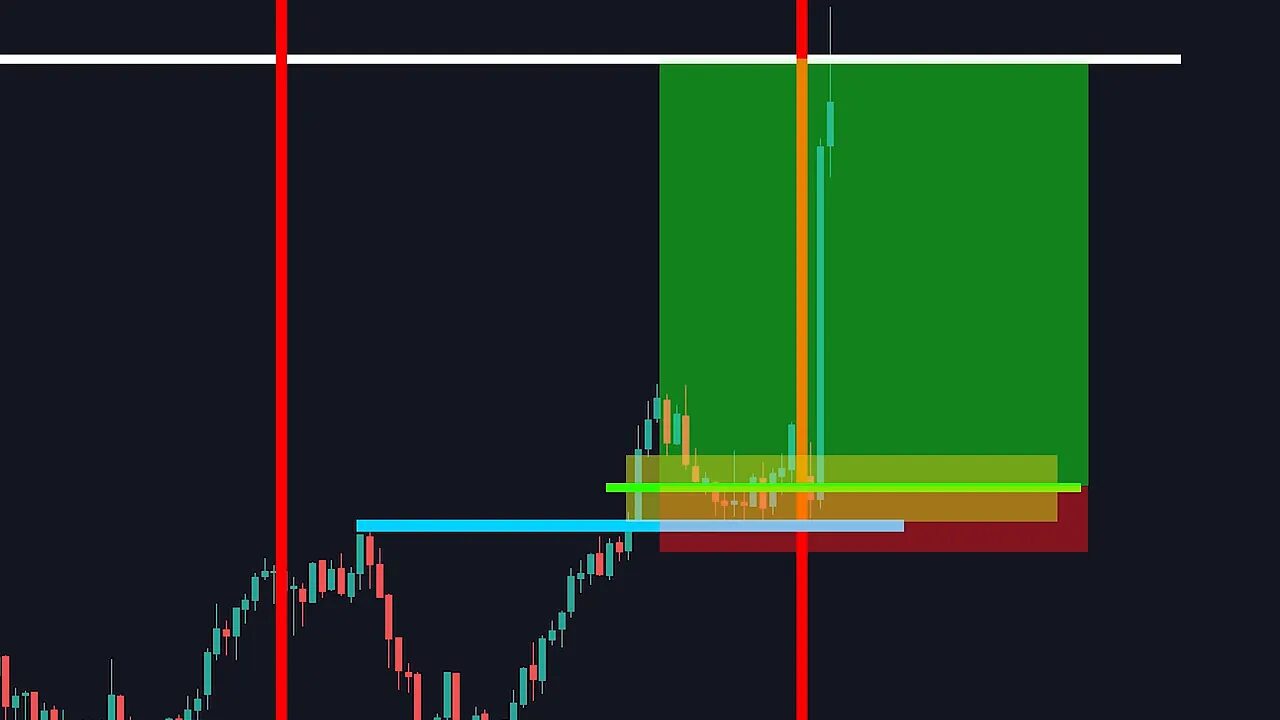
- A fast bullish candle creates a fair value gap. A limit order is placed in the middle of the gap and the stop is set below the gap candle.
- Price comes back, fills the limit, consolidates briefly, and then rallies up to the take profit at the marked high. Trade closed for a clean win.
Checklist before you press trade
- Are liquidity zones clearly marked on the five minute chart?
- Is it between 9:30 and 11:00 ET?
- Has price broken a liquidity zone decisively?
- On the one minute chart, has the pivot been broken showing a structure shift?
- Is there a fair value gap to use for a limit order?
- Is the stop loss placement and take profit set with an acceptable risk reward?
Risk management and practical tips
Position sizing is critical. Use a risk-per-trade that matches your account and mental comfort. Tight stops improve risk reward but can increase the chance of being stopped out. If nervous, use the slightly wider stop below the entire move at the cost of a worse risk reward ratio.
Use TradingView or similar charting software to draw zones and set vertical session markers. The one minute chart is necessary for the sniper entries. Keep a trading journal to track which entries and variations work best for the instruments you trade.
FAQ
What timeframe should I use for spotting the setup and for entries?
Spot the setup on the five minute chart and switch to the one minute chart to execute the entry. The five minute timeframe shows the overall liquidity zones and breaks. The one minute gives a precise sniper entry that improves risk reward.
What exactly is a fair value gap and how do I mark it?
A fair value gap is a fast directional move where a large candle creates a gap between the candle before and the candle after. Mark the top of the first candle and the bottom of the second candle to define the gap area. That gap is where price often returns to and offers a high-probability entry zone.
When am I allowed to enter a trade?
Only enter if all conditions are met: the trade occurs between 9:30 and 11:00 ET, price breaks a marked liquidity zone, the pivot on the one minute chart is broken indicating a structure shift, and a fair value gap exists for placing a limit order.
Where should I place my stop loss and take profit?
Place the stop loss just below the low of the fair value gap candle for a tighter stop or below the low of the entire move for more room. Take profit should be placed at the opposite high or low liquidity level you marked earlier, giving you a defined exit and clear risk reward.
Can this strategy be used on stocks, forex, and crypto?
The principles translate across markets since liquidity, structure, and gaps exist in all liquid instruments. Adjust for instrument volatility, session times, and spread. Forex and crypto may trade 24/7, so keep the same session discipline (an equivalent high-probability time window) for best results.
Final notes
This five-step method is deliberately rule-driven to reduce emotion and increase consistency. It relies on a short, concentrated trading window and a precise entry technique. Backtest the rules on your instruments, start small, and track every trade. The combination of defined liquidity zones, a strict time window, pivot confirmation, and fair value gap entries gives a clean blueprint for repeatable day trading.
