

In this video analysis I walk through my ENA Price Prediction using custom indicators, price structure, and on-chain flow. The goal: identify the most likely path for ENA over the coming weeks, highlight key resistance/support zones, and provide a practical trade plan with cautionary signals to watch.
Table of Contents
- Weekly outlook — a global double bottom forming
- Key resistance: watch the $0.87–$0.93 block (cap-and-handle risk)
- Deviation and range logic — sweeps, traps and the expected top deviation
- Supply dynamics: whale wallets and distribution pressure
- Daily timeframe & indicators — bullish but with correction signals
- Money flow and short-term risk
- Trade plan — zones for buying, fixing profit, and risk management
- Conclusion
- FAQ — ENA Price Prediction
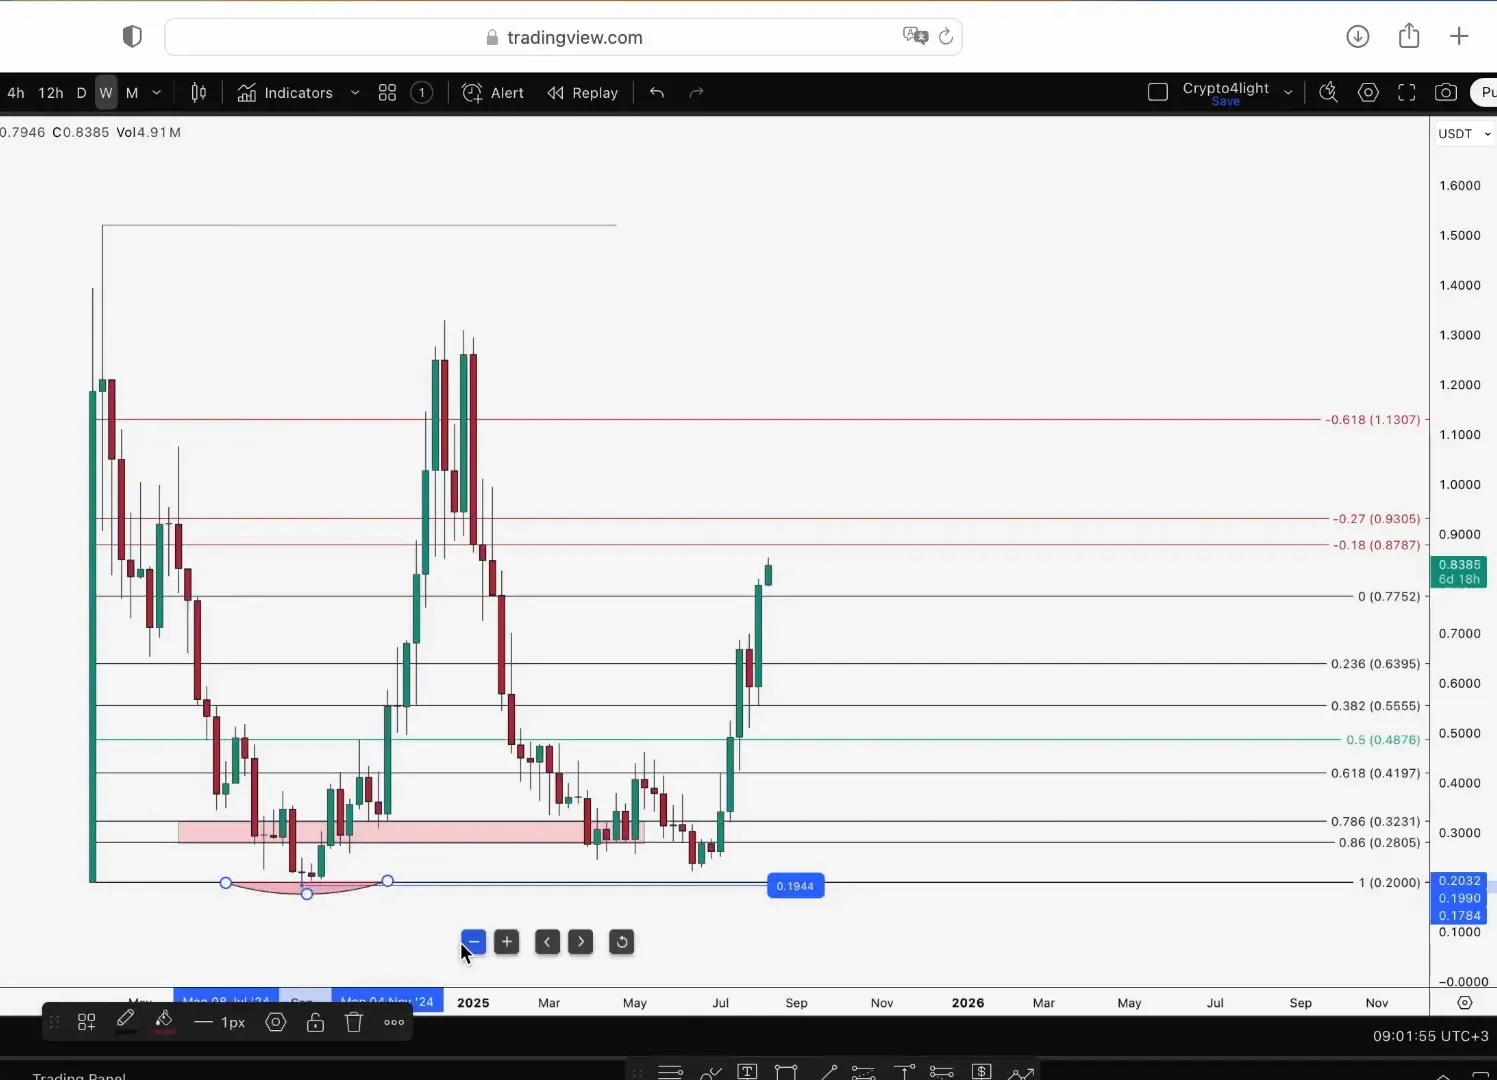
Weekly outlook — a global double bottom forming
Zooming out to the weekly timeframe, ENA looks like it’s forming a global weekly double bottom. This is the core of my ENA Price Prediction: the size of this double bottom points toward a large upside target — roughly in the $2.00–$2.50 area if the pattern completes.
The line chart corroborates this structure: even with different chart types the same bottoming shape is visible, which strengthens the bullish case. That said, timing remains uncertain — structures can take time to play out.
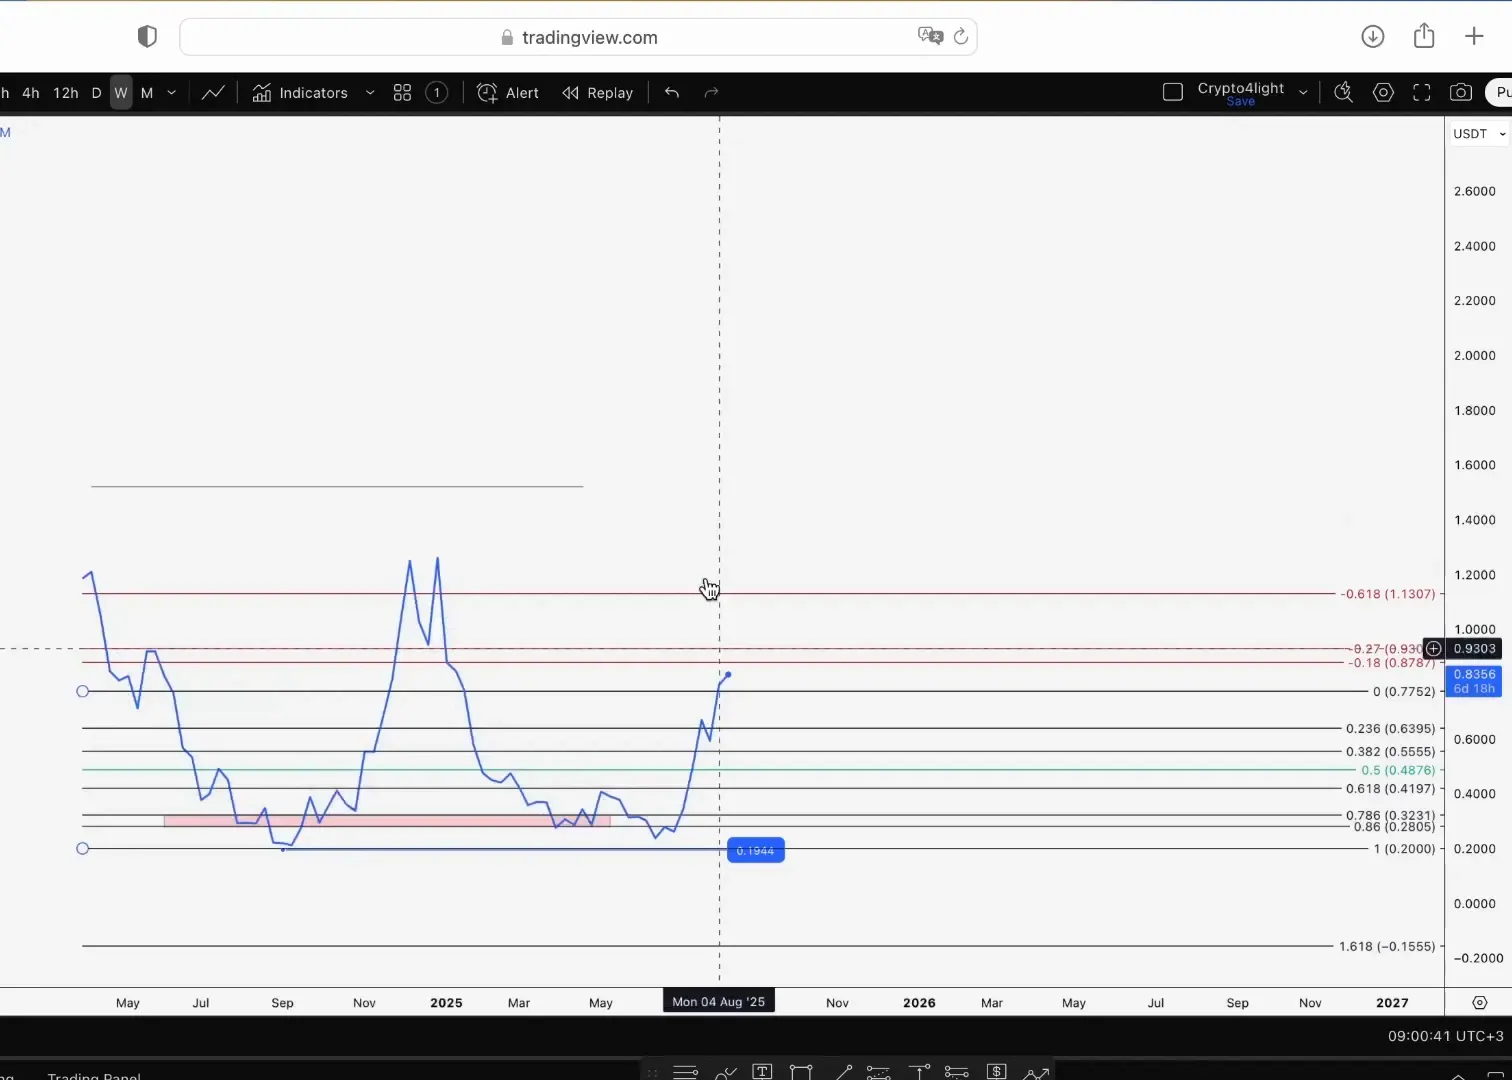
Key resistance: watch the $0.87–$0.93 block (cap-and-handle risk)
One immediate risk to the bullish scenario is rejection in the $0.87–$0.93 zone. If ENA is rejected there, a cap-and-handle formation through September becomes likely. In that scenario we could see consolidation or a pullback before the next leg up.
Alternatively, if ENA receives a strong pump above $1.00, many traders will open longs and a rapid correction could follow after that squeeze. In short: break above $1.00 could trigger momentum — but also increase the risk of a sharp short-term retracement.
Deviation and range logic — sweeps, traps and the expected top deviation
I use a deviation-and-sweep framework: earlier we saw what I identified as a deviation at the bottom. Historical behavior suggests a corresponding deviation at the top may follow. Based on the range, a top deviation (a sweep above the local range top) is expected before a larger distribution phase.
That projected deviation zone is one of the places I’m watching for a possible distribution phase or profit-taking before continuation to higher highs.
Supply dynamics: whale wallets and distribution pressure
ENA’s capitalization is significant and not all tokens are in surplus supply. Large holders control a big portion of emission, which means distribution will be gradual — they can’t simply dump into the market without causing big price drops. This explains why price respect to major levels has been orderly so far.
Because whales must distribute over time, we should expect phases of sideways movement and controlled selling rather than immediate, violent dumps — though local sell-offs can still happen.
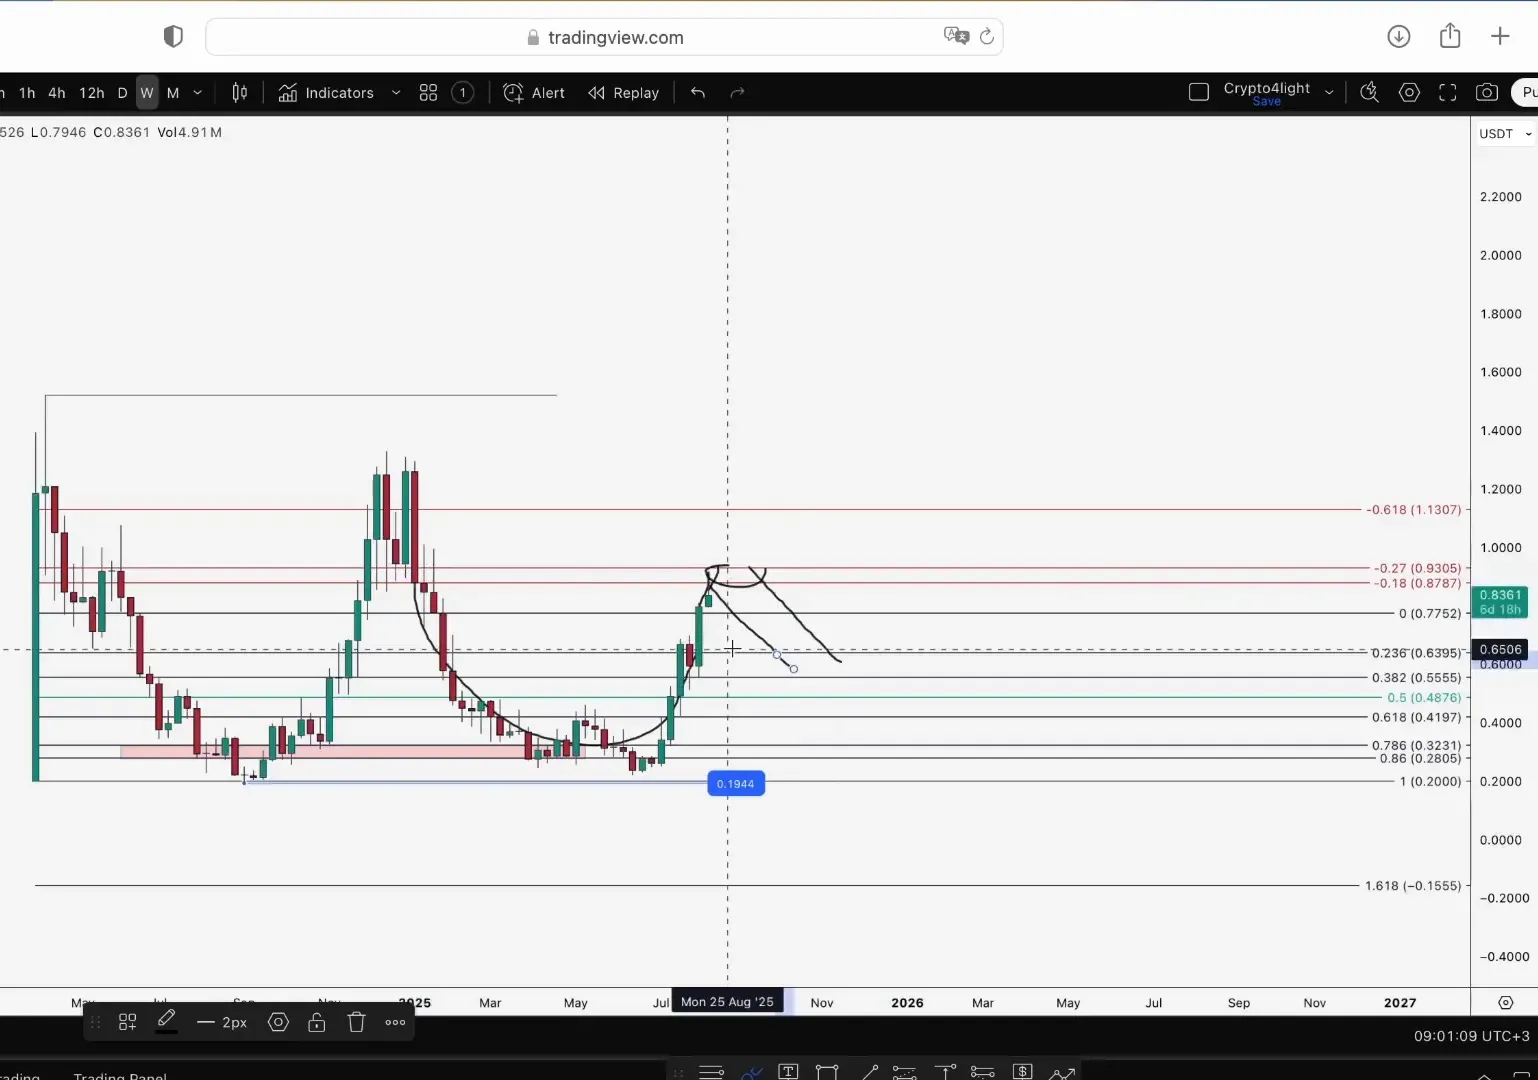
Daily timeframe & indicators — bullish but with correction signals
On the daily, indicators look bullish overall — we’ve formed what I described as a “warranty” after a top and subsequent reaction. That structure suggests a potential cup-and-handle formation that could include a new local high, then a pullback toward ~ $0.63–$0.65 in a corrective case.
Important: the daily market-mode indicator is currently in overhype territory. The last time this setup warned of a correction, ENA dumped ~26%. If the next correction follows that pattern, we could revisit the $0.63–$0.65 area. So while the ENA Price Prediction remains bullish, be prepared for local corrections.
Money flow and short-term risk
Recent money-flow data showed several weeks of outflow prior to the current top. We have just begun a one-week inflow, but historically that can reverse and produce another outflow from the peak. This is a meaningful short-term risk for local targets and swing trades.
Because money flow can flip quickly at local highs, I emphasize readiness for local sell-offs even in a broader bullish trend.
Trade plan — zones for buying, fixing profit, and risk management
Based on the price action and indicators, here are practical steps for traders considering ENA:
- Accumulation zone: The major accumulation was earlier on the weekly. If you bought there, partial profit-taking in the distribution zone is reasonable.
- Swing-fixation zone: If you’re in the balance/accumulation zone (approx. $0.28–$0.32 historically), consider holding. If you bought higher, fixing some profit around nearby resistance is prudent.
- Buy triggers: Break and hold above $1.00 shows momentum, but be cautious of a fast correction after the pump.
- Stop and invalidation: A sweep below the weekly low would invalidate the bullish double-bottom thesis — treat such a sweep as a stop-loss event.
- Targets: The medium-term ENA Price Prediction target is the $2.00–$2.50 range if the double bottom and continuation hold.
Always use position sizing and set stops. If you decide to buy now, be prepared for a correction and consider buying in tranches rather than all at once.
Conclusion
The ENA Price Prediction from this setup is bullish: a global weekly double bottom suggests strong upside potential toward the $2.00–$2.50 area. However, there are clear short-term risks — the $0.87–$0.93 resistance zone could trigger a cap-and-handle, daily indicators show overhype (historically preceding a ~26% correction), and money flow could flip back to outflow.
In short: the longer-term structure favors an eventual push to higher highs, but trade with discipline — fix profits in the distribution zone, watch the $0.87–$0.93 block, and respect invalidation levels on the weekly chart.
FAQ — ENA Price Prediction
Q: What is the primary bullish thesis for ENA?
A: The primary bullish thesis is a global weekly double bottom. If it completes, it points toward a medium-term target in the $2.00–$2.50 range.
Q: What immediate resistance should I watch?
A: The critical resistance block is around $0.87–$0.93. Rejection there increases the chance of a cap-and-handle/consolidation in September.
Q: Could ENA correct significantly from here?
A: Yes. Daily indicators are in overhype territory and past crypto signals have led to ~26% corrections. A corrective retrace to roughly $0.63–$0.65 is possible in that scenario.
Q: How do whales and supply dynamics affect the outlook?
A: Large wallets control a notable portion of supply. They will likely distribute gradually, which leads to organized moves and sideways periods rather than instant collapse — but it also means sellers can press pressure at distribution zones.
Keep these levels and signals on your radar as you trade. If you follow the structure above, you’ll have a clearer plan for the ENA Price Prediction while managing risk.
