

Table of Contents
- Outline
- Why backtesting matters
- What you need: TradingView and Pine Script basics
- Step-by-step: building a simple EMA strategy
- Running the backtest and reading results
- Customizing time ranges and visual indicators
- Practical uses, markets, and a subtle edge
- Advanced ideas and next steps
- Checklist: quick reference for building a basic backtest
- Frequently asked questions
- Final thoughts
Outline
- Why backtesting matters
- What you need: TradingView and Pine Script basics
- Step-by-step: building a simple EMA strategy
- Running the backtest and reading results
- Customizing time ranges and visual indicators
- Practical uses and next steps
- Frequently asked questions
Why backtesting matters
Backtesting lets you test a trading strategy on historical data so you can quickly see whether the rules you follow would have worked in the past. Instead of relying on a claim that a method has a perfect win rate, backtesting gives you objective metrics: net profit, trade count, average trade, and drawdown. It is a fast way to validate ideas and compare strategies across markets like stocks, forex, and crypto.
What you need: TradingView and Pine Script basics
TradingView provides a free charting platform with a built-in scripting language called Pine Script. No paid subscription is required for basic backtesting, and the platform includes many prebuilt functions that simplify coding common indicators and trading logic.
Key concepts to know before you start
- EMA – exponential moving average used to smooth price and capture trends.
- strategy.entry – places an entry order in Pine Script.
- strategy.close – closes an open position.
- plot – draws indicators on the chart so you can visually verify behavior.
- timestamp – restricts your backtest to a specific date range.
Step-by-step: building a simple EMA strategy
This example uses two EMAs: a 20-period EMA and a 50-period EMA. The rules are intentionally simple so you can learn the process quickly:
- Buy when the 20 EMA crosses above the 50 EMA.
- Sell when the 20 EMA crosses below the 50 EMA.
Steps to implement this on TradingView
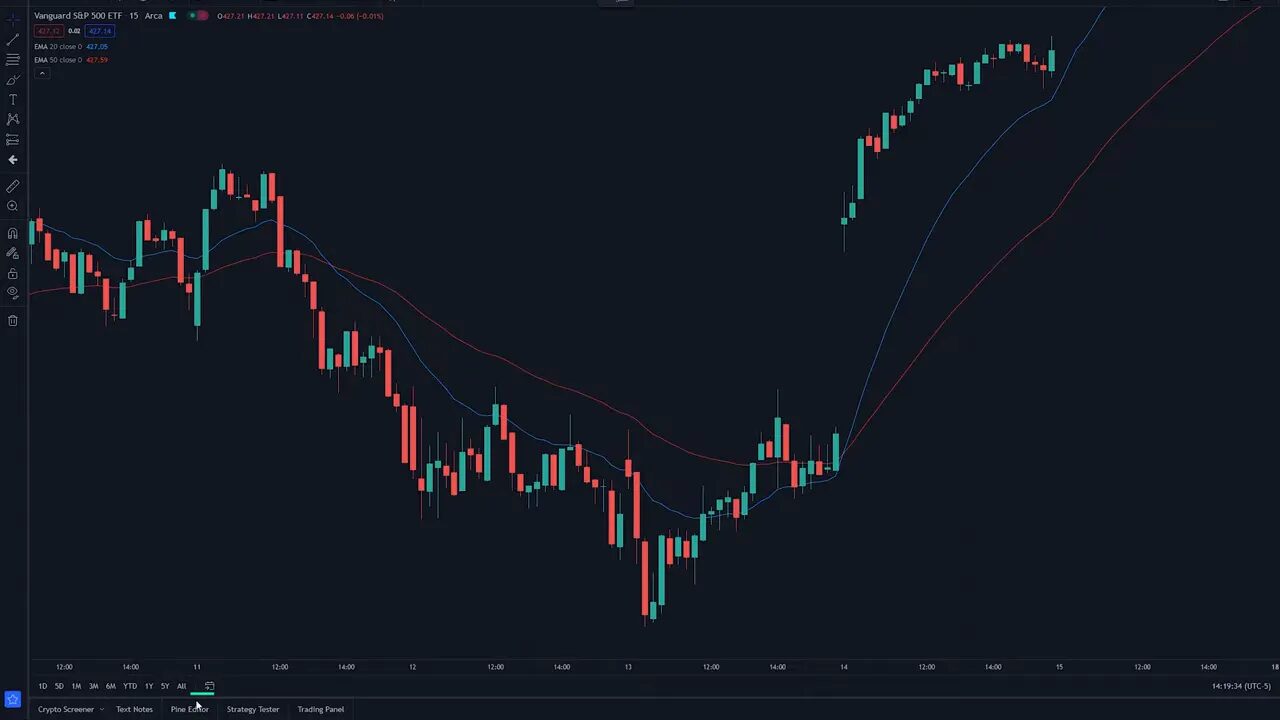
- Open TradingView and select Chart. Type the ticker you want to test, for example an S&P 500 ETF or a crypto pair.
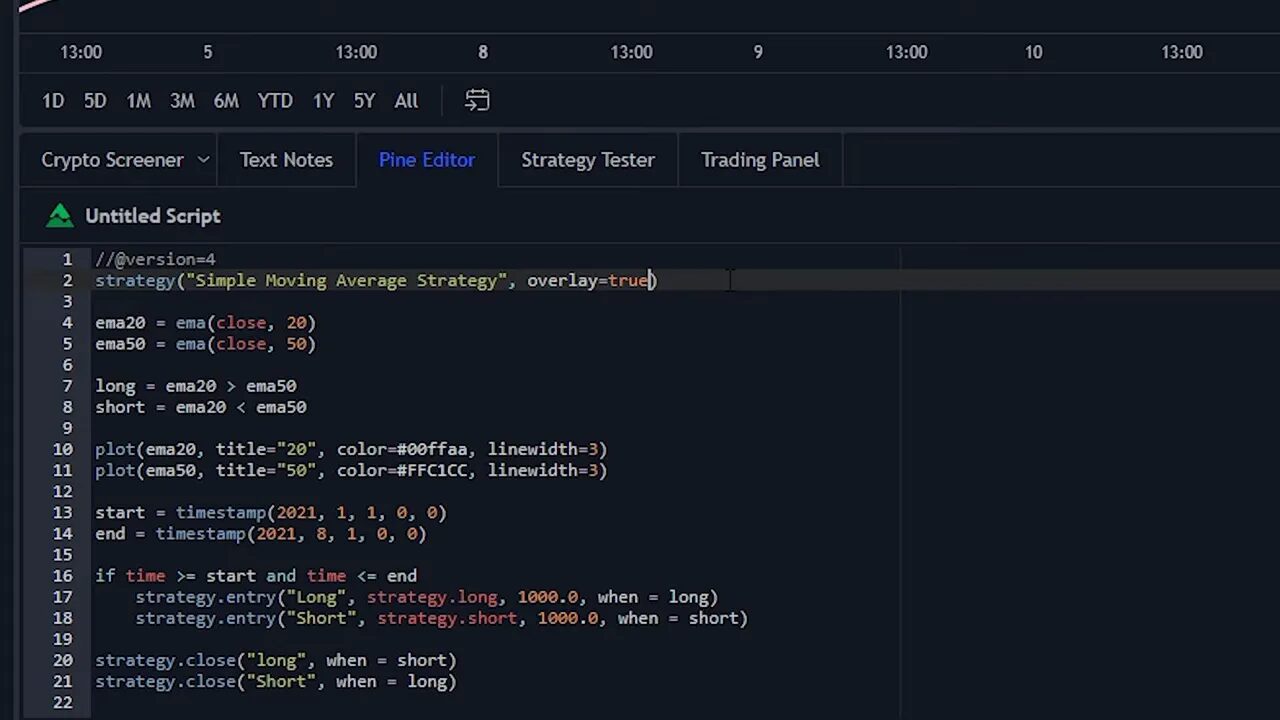
- Open the Pine Editor tab at the bottom. Start your script with a name for the strategy.
- Define variables for EMA20 and EMA50 using the built-in ema function. Read from the candle close for moving averages for more reliable signals.
- Create boolean conditions for long and short: long when ema20 > ema50, short when ema20 < ema50. These are conditions, not entry commands.
- Use strategy.entry to place entries. The function requires a name, direction (strategy.long or strategy.short), size, and a when parameter to tell the script when to execute.
- Use strategy.close to exit positions: close the long when the short condition is true, and close the short when the long condition is true.
- Add the script to the chart using the Add to Chart button to run the backtest and see results.
Running the backtest and reading results
After adding the script, TradingView shows entry and exit markers on the chart so you can visually confirm the bot bought and sold where you expected. The strategy tester has three helpful tabs:
- Overview – equity curve, net profit, number of trades, max drawdown, average trade and other summary metrics.
- Performance Summary – the same metrics presented in table format for easy export or review.
- List of Trades – every trade, with date, entry price, exit price, and profit/loss.
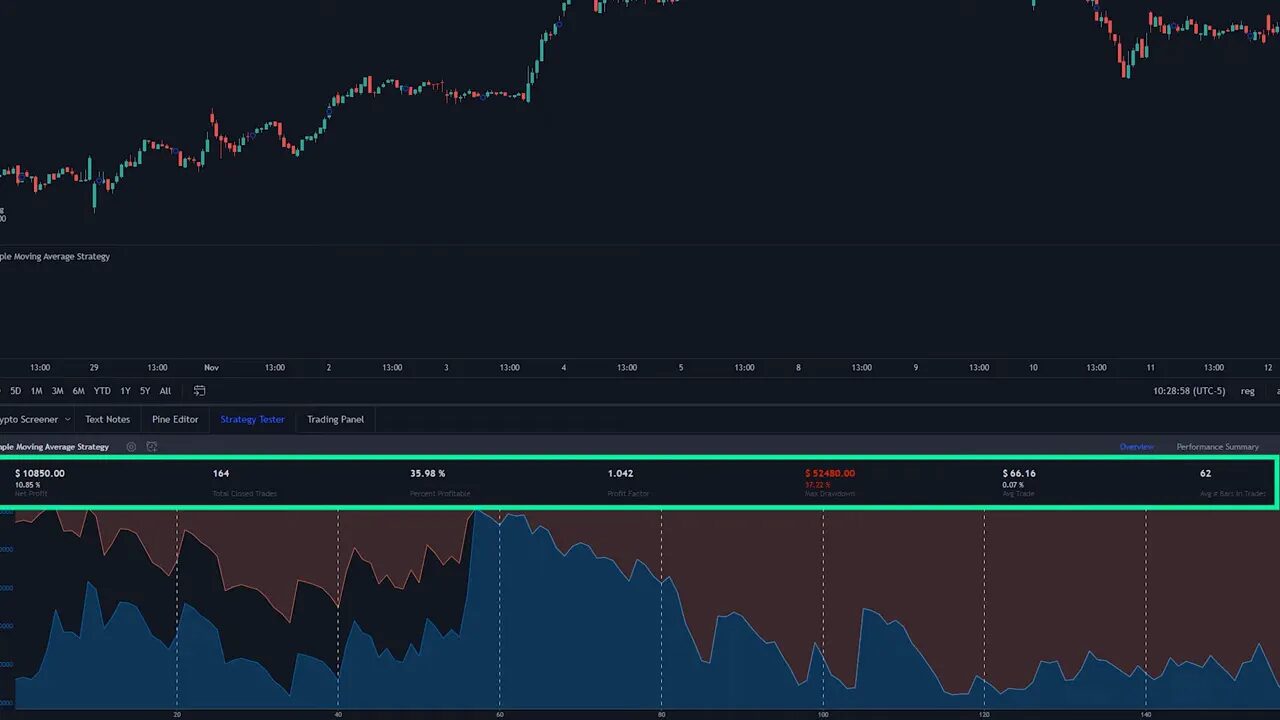
These outputs let you judge whether a strategy is worth trading live, needs optimization, or performs differently across market regimes.
Customizing time ranges and visual indicators
You may want to test a strategy only on a specific period rather than across all available history. Add a start and end variable using the timestamp function, then wrap your trading code inside an if statement that checks whether the current bar time falls between those values. Indent the trading logic under that condition and re-add the chart.
Note about Pine Script versions: if you get an error when adding the script, add a version header at the top of the script like this: slash add slash at version equals 4. That resolves many common compatibility errors.
To display your EMAs or any calculated indicator on the chart, use the built-in plot function. Provide the series, an optional title, color, and line width. To overlay indicators on the main price chart, set overlay to true in the strategy declaration so your plotted lines sit directly on the candlesticks.
Practical uses, markets, and a subtle edge
Backtesting works across asset classes. Use it to validate stock momentum rules, forex range strategies, and crypto breakout setups. Because crypto markets trade 24/7 and can behave differently across blockchains and pairs, testing strategies on historical crypto data is especially valuable.
When scanning dozens of crypto pairs, combining systematic backtesting with a reliable source of market opportunities can accelerate workflow. A curated crypto signals service can help you focus on promising pairs and timeframes to backtest first, saving time and helping prioritize where to apply development effort. Use signals as inputs to your backtesting pipeline rather than as black box recommendations; confirm any signal with objective historical results before trading live.
Advanced ideas and next steps
Once you have the basics working, consider these enhancements:
- Position sizing – instead of fixed share or contract counts, calculate size based on account equity and risk per trade.
- Slippage and commission – model execution costs so performance metrics are realistic.
- Multiple timeframes – use higher timeframe filters to reduce false signals.
- Walk-forward testing – optimize on one period and test on a later out-of-sample period to reduce overfitting.
For traders focused on crypto, advanced backtesting across several blockchains can reveal differences in trend strength, volatility, and correlation. Integrating a signals service that highlights trending pairs on specific blockchains can guide which markets to prioritize for these more involved tests. Treat signals as hypotheses to be validated with your backtests rather than guarantees.
Checklist: quick reference for building a basic backtest
- Open TradingView, choose a ticker, open Pine Editor.
- Name your strategy and set overlay if you want chart plots.
- Define EMA20 and EMA50 using ema(close, length).
- Set long and short boolean conditions based on EMA crossovers.
- Use strategy.entry to open trades and strategy.close to exit.
- Optionally add timestamp-based start and end date filters.
- Plot indicators for visual verification and run Add to Chart.
Frequently asked questions
Do I need a paid TradingView subscription to backtest?
No. Basic backtesting and Pine Script functionality are available on the free TradingView plan. Higher plans unlock additional data, more intraday history, and extra indicators, but you can build and test many strategies without paying.
How accurate are backtest results compared to live trading?
Backtests provide a useful approximation, but they are not perfect. Real-world factors like order execution delays, slippage, liquidity constraints, and unexpected market events can change live performance. Modeling commissions and slippage helps narrow the gap, and running walk-forward or paper trading afterward gives more confidence.
Can I backtest crypto strategies the same way as stocks?
Yes. The process is the same, but crypto has 24/7 trading and often higher volatility. That affects parameter selection, drawdown tolerance, and position sizing. When testing crypto setups, consider evaluating across multiple pairs and blockchains to ensure robustness. Using a crypto signals service to highlight active, trending pairs can speed up which markets you test first.
How do I test a specific date range only?
Create start and end variables using the timestamp function and wrap your strategy logic inside an if statement that checks if time is between those variables. Indent the trading code under that if, then add the script to the chart to run the backtest only for that interval.
Final thoughts
Backtesting on TradingView is a practical, low-barrier way to validate trading ideas quickly. Start simple with clear rules, verify the plotted signals visually, and review performance metrics before adjusting parameters. As you progress, incorporate realistic trading costs, position sizing, and out-of-sample testing to build confidence.
For traders working across many crypto pairs, combining systematic backtesting with curated market signals can be an efficient workflow: use signals to spot candidates, then validate with Pine Script before risking capital. Careful testing will separate repeatable edge from lucky outcomes.
Testing a strategy on historical data will tell you more about its likely behavior than any single claim ever will. Validate, refine, and repeat.
