

Table of Contents
- Why a screener saves you hours every morning
- Getting started: pick a screener and understand the tools
- Core presets (and exact Finviz filter settings)
- Practical tips and the mindset to use screeners effectively
- Sample morning checklist
- Frequently asked questions
Why a screener saves you hours every morning
Scrolling through thousands of tickers is the fastest way to waste time and miss the real opportunities. A good screener trims the universe down to a few dozen stocks that match your exact criteria. Use it as a filter, not a final checklist. The goal is to create a clean watch list that you can analyze in depth instead of chasing noise.
Getting started: pick a screener and understand the tools
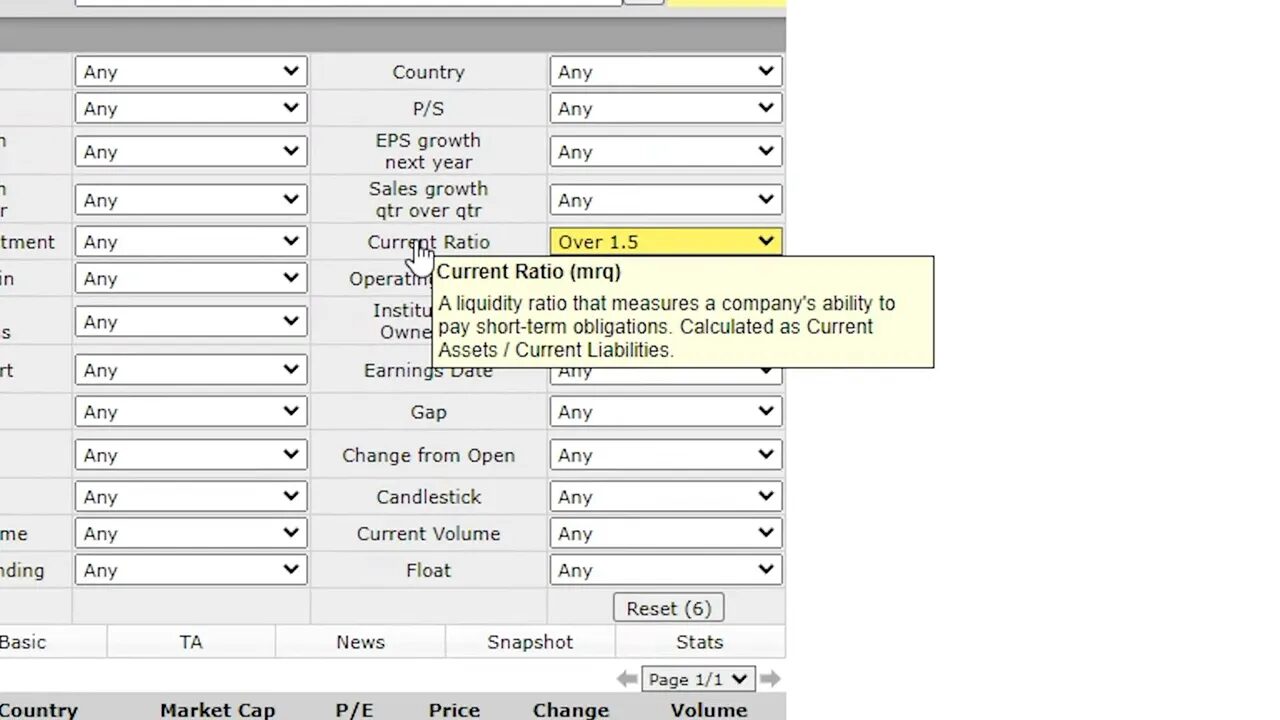
There are many screeners—some free, some paid. Finviz provides a powerful free option for most traders, while platforms like TradingView offer more advanced scanning for a subscription. Learn the filters and what they mean; Finviz lets you hover over any filter to get a quick definition. That one trick alone speeds up setup and prevents mistakes.
When you find a short list, hover over tickers to preview chart patterns before opening each chart in your analysis platform. This saves a lot of clicks.
Core presets (and exact Finviz filter settings)
Below are the practical presets that produce reliable lists for different trading styles. Treat each as a starting point—adjust the thresholds to match your risk tolerance and time horizon.
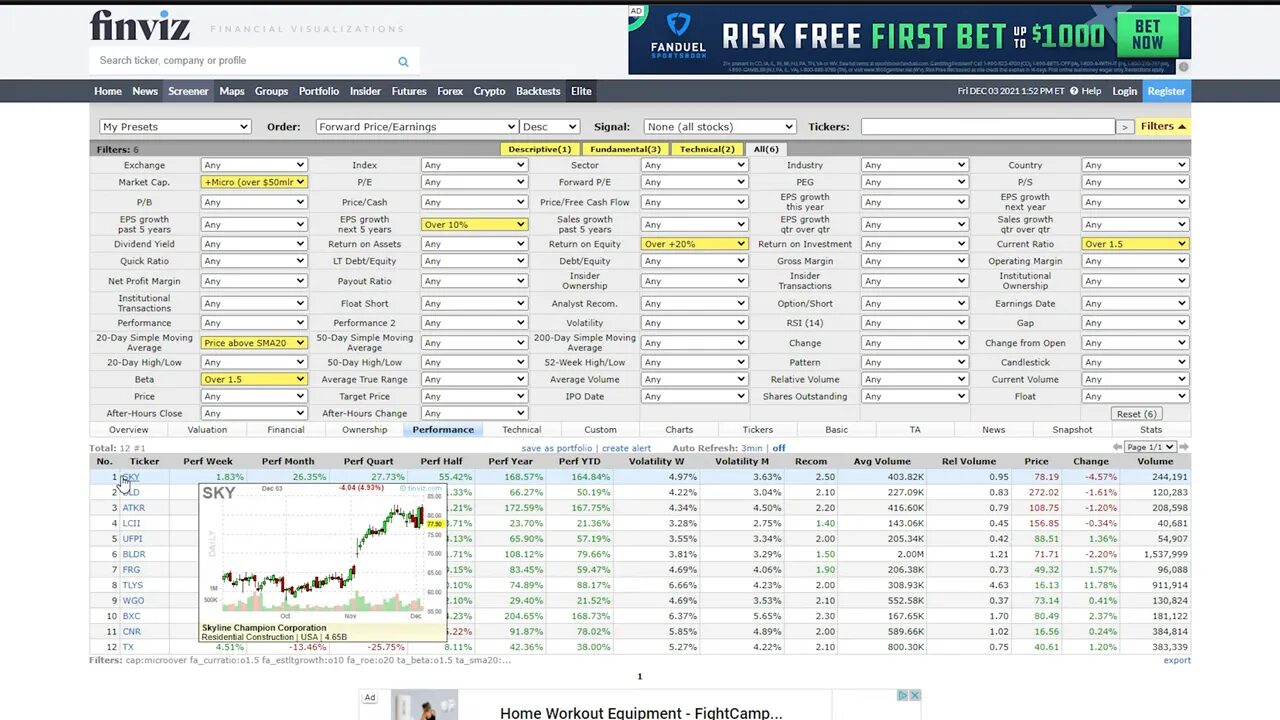
1) Buy and hold — steady growers
Use this when you want companies with consistent growth and healthy fundamentals.
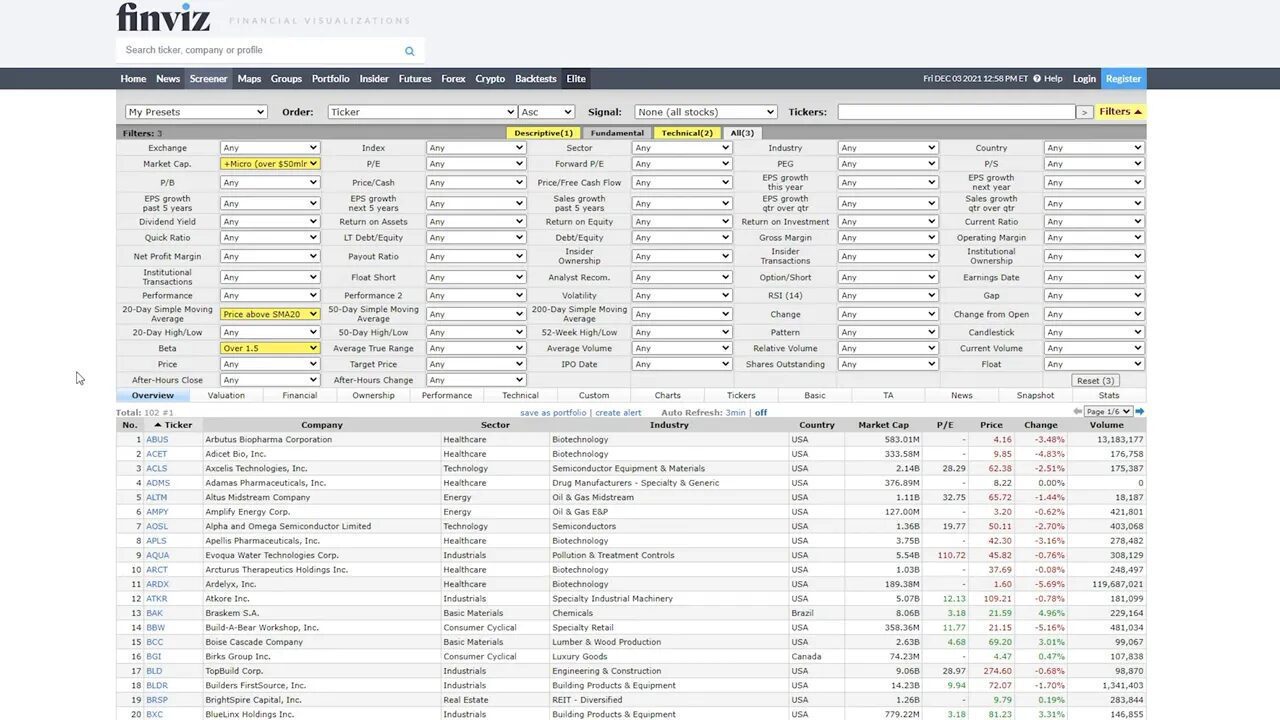
- Market Cap: > 50M (filters out penny stocks)
- Price: Above 20-day moving average
- Beta: > 1.5
- EPS growth (next 5 yrs): > 10%
- Return on Equity: > 15%
- Current Ratio: > 1.5
Result: a list of slow and steady gainers. If the list is too big, tighten one filter (for example raise EPS growth to 20%). After filtering, review each chart and the company snapshot before entering a long-term position.
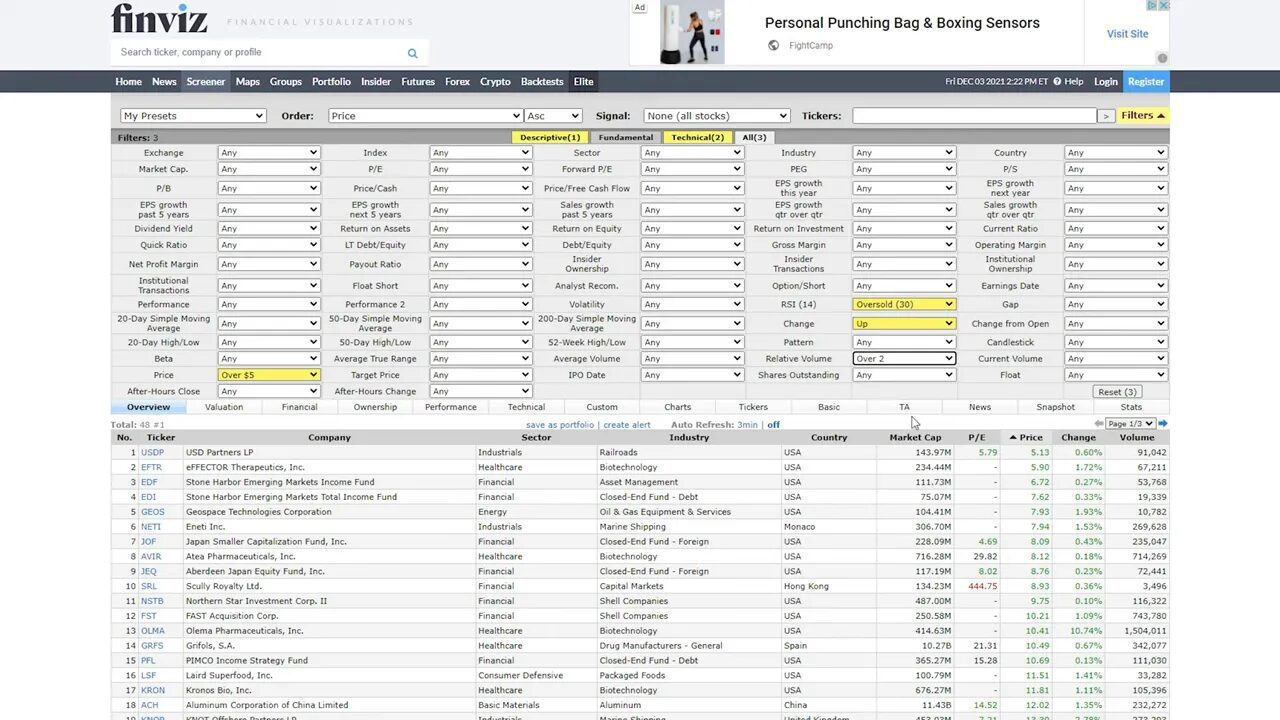
2) Oversold bounce plays
These aim to capture stocks that fell too hard and are showing early signs of reversal.
- Price: > $5
- RSI: Oversold
- Change: Up (recent uptick)
- Relative Volume: > 2
Why it works: you’re hunting for stocks that had a knee-jerk drop, are starting to recover, and are seeing higher-than-normal participation. Patience is essential. Add these to a watch list, wait for confirmation, then enter. Some will roll over again; position sizing and stop rules matter.
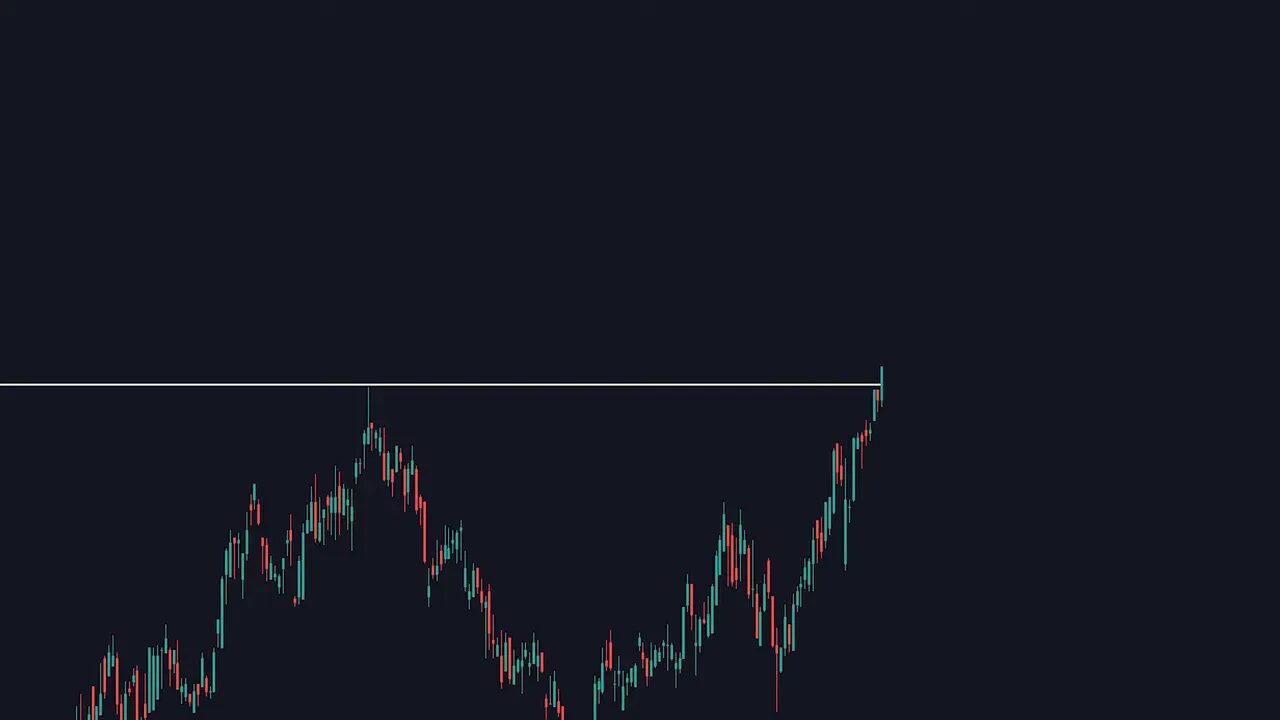
3) Breakouts — catch the next run
Designed to surface stocks that are clearing resistance and moving into higher price territory.
- Price: Above 20-day, 50-day, and 200-day moving averages
- New High (50 days): Yes
- Return on Equity: > 20%
- Debt/Equity: < 1
- Average Volume: > 100k
Play: watch for confirmation on a break of a key resistance. Not every breakout leads to a long-term winner, so plan entries and stops. The same breakout principles work in crypto markets; for crypto traders, combining this approach with reliable cryptocurrency trading signals can help time entries into high-momentum tokens across different blockchains.
4) Short plays — trade weakness
If you prefer shorting, these filters find liquid names with heavy short interest.
- Market Cap: > 300M
- Float Short: High (around 20%)
- Average Volume: > 500k
- Relative Volume: > 1
- Current Volume: > 500k
Why it helps: high short interest plus strong volume provides liquidity to enter and exit trades. The float short setting also gives confidence that other traders are positioning for the same move. Always manage risk carefully—short squeezes can be brutal.
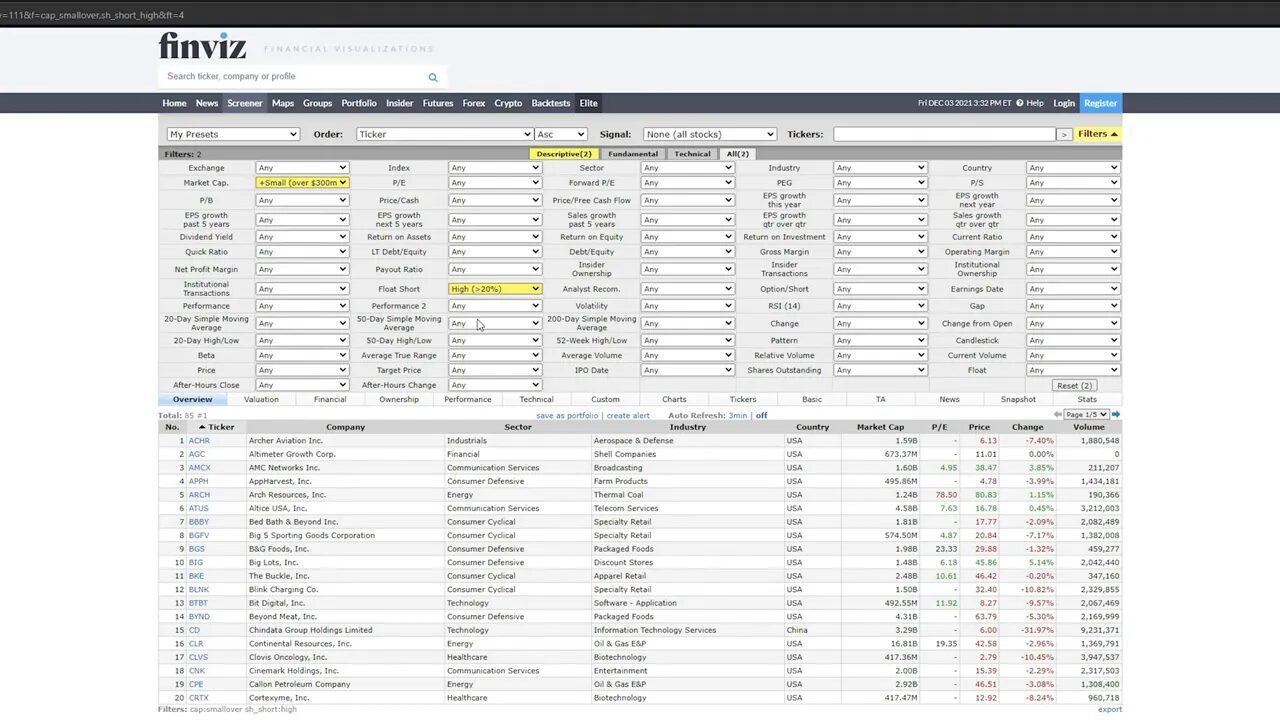 20%) and filtered results table”/>
5) Bounce off moving averages
This finds stocks testing a moving average as support and attempting to resume the trend.
- Price: Above 20-day MA but below 50-day MA
- Average Volume: > 400k
- Relative Volume: > 1
- Current Volume: > 2M
These setups often offer cleaner risk-reward because you can place a stop just below the moving average. Look for a bullish candlestick or volume spike for confirmation.

6) Dividend picks — undervalued growers that pay
Target stocks that combine income with reasonable growth expectations.
- Market Cap: > 10B
- Dividend Yield: > 0%
- P/E: < 20
- EPS Growth (5 yrs): > 5%
- Payout Ratio: < 50%
- PEG: Low
- EPS Growth (next year): > 5%
Result: a list of large-cap companies that look reasonably priced, are growing, and pay dividends. These are ideal for longer-term investors who want a mix of income and capital appreciation.
7) High earnings and rapid growth
For finding companies that are accelerating across sales and profits.
- Price: Above 200-day moving average
- Average Volume: > 400k
- EPS Growth (year): > 25%
- EPS Growth (quarter): > 25%
- EPS Growth (next year): > 25%
- Sales (quarter): > 25%
- RSI: > 50 (not oversold)
This screener highlights companies with standout earnings momentum. They often continue to outperform, but monitor valuation and sector risk. For traders who also follow crypto, similar growth screening on tokens can be informative. Pairing those insights with a cryptocurrency trading signals service helps detect tokens with accelerating on-chain activity and earnings-like metrics across DeFi projects.
Practical tips and the mindset to use screeners effectively
- Treat screeners as filters, not trade confirmers. Always review charts and fundamentals after filtering.
- Use volume filters to ensure liquidity and to avoid getting stuck in positions.
- Hover over filter names in Finviz to get short definitions when you are unsure what a metric means.
- For momentum setups wait for confirmation—price rejection at support or a candlestick pattern supported by volume.
- Adjust thresholds to shrink or expand your list. Higher EPS, higher ROE, or stricter volume requirements reduce false positives.
Sample morning checklist
- Run each preset and add interesting tickers to your watch list.
- Hover for quick chart previews, then open candidates in TradingView for technical analysis.
- Check company news, earnings calendar, and sector context.
- Set alerts for confirmation levels and define risk/reward for each trade.
- Limit position sizes and apply stops according to your plan.
Frequently asked questions
How do I choose which preset fits my trading style?
Match the preset to your time horizon and risk tolerance. Use buy-and-hold and dividend presets for longer-term investing. Use oversold bounce and breakout presets for short-term swing trades and day trades. If you prefer downside plays, use the short screen. Adjust thresholds to be more conservative or aggressive.
Can I use these filters for crypto markets?
The same principles apply: momentum, volume, and trend matter. Crypto markets are more volatile and trade 24/7, so pair screening logic with specialized data like on-chain metrics. Combining screeners with a reliable cryptocurrency trading signals service can help you identify high-probability crypto setups while managing the extra volatility.
Why are volume filters so important?
Volume indicates participation. Higher average and relative volume mean better liquidity, cleaner breakouts, and easier exits. Low-volume names can spike or gap dramatically, which increases execution risk and slippage.
Should I trust a screener’s results without further research?
No. Screeners narrow the universe but do not replace chart analysis, news checks, and fundamental review. Treat the output as a prioritized list for deeper research and confirmation before committing capital.
How often should I update my screener settings?
Review settings monthly or whenever market conditions change. In volatile markets widen volume and price thresholds; in calm markets tighten filters to focus on higher-quality moves. Keep small, iterative changes rather than large overhauls.
Any final tips for avoiding common mistakes?
Avoid overfitting filters until your list is tiny and repetitive. Don’t rush entries—wait for confirmation. Manage risk with position sizing and stop-losses. And remember that a well-built watch list is worth far more than a long, unfocused scan.
