

Everyone knows the phrase buy low, sell high. The problem is knowing when a stock is actually low. You buy because it feels cheap, then it keeps falling and you realize you bought the middle instead of the bottom. That simple mistake eats returns. The good news: there are practical ways to judge whether a company is priced attractively. None of them are perfect, but together they give you an edge.
Table of Contents
- The simplest starting point: the PE ratio
- Compare to history: the long-term average
- Compare to peers: industry context matters
- Cheap can be cheap for a reason
- How to use PE in a practical checklist
- Common pitfalls to avoid
- What is considered a good PE ratio?
- Should I use trailing PE or forward PE?
- Can PE ratios be used for crypto assets?
The simplest starting point: the PE ratio
The most common quick check is the price to earnings ratio, or PE. It’s calculated by dividing the stock price by the company’s earnings per share. A PE of 15 means the market is valuing the company at 15 times its annual earnings. Hypothetically, buying 100 percent of that company would take 15 years of current profits to recoup the purchase price.
Lower PE often suggests a cheaper valuation, but that single number does not tell the whole story. It’s a useful gauge, not a guarantee.
Trailing PE versus forward PE
The trailing PE uses actual past earnings. It is based on numbers that already happened and is reliable in that sense. The downside is it ignores future catalysts. If a company just launched a game-changing product or hired an exceptional new CEO, trailing PE won’t reflect that yet.
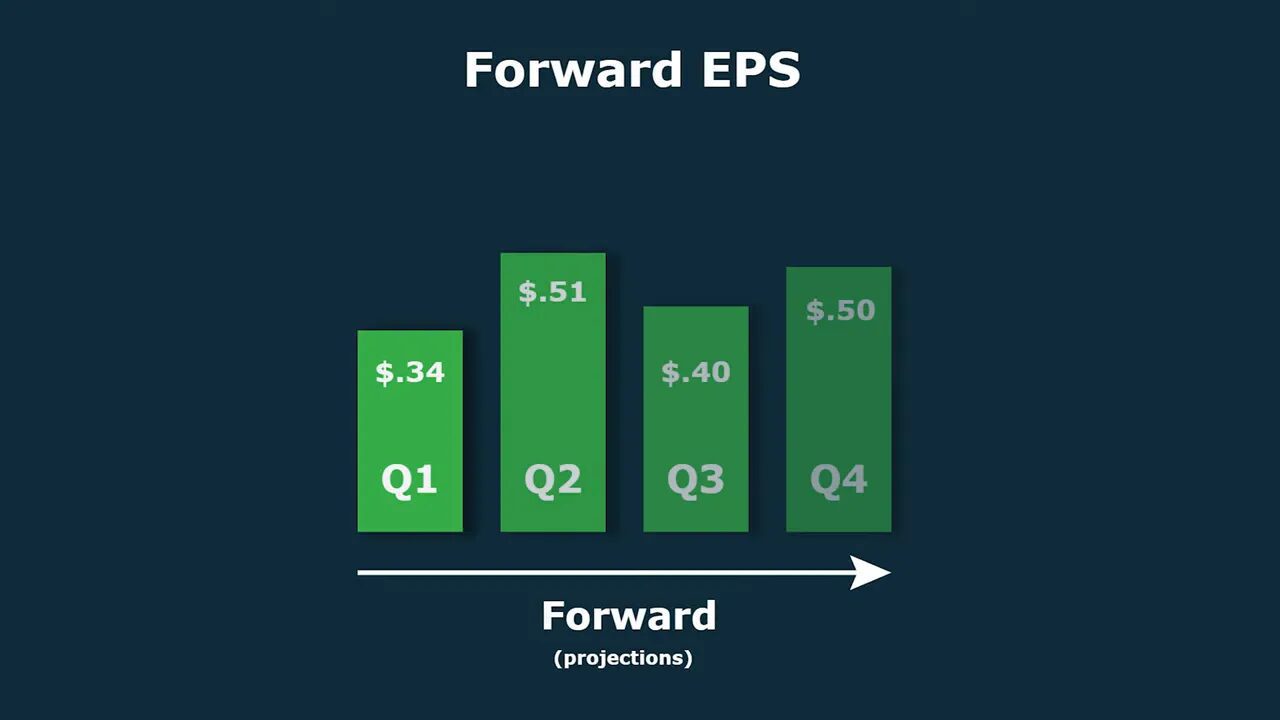
The forward PE uses projected earnings, which attempts to price in expected growth. That makes it future-oriented, but projections can be wrong. Companies and analysts sometimes under- or overestimate earnings, and surprises happen. Use forward PE to get a sense of expectations, but treat those estimates with caution.
Compare to history: the long-term average
One helpful step is to compare the current PE to the company’s historical average. If the current PE is much higher than its long-term average, investors might be paying a premium. If it’s much lower, the market may be underpricing the company.

For example, a company with a five-year average PE of 22 and a current PE of 31 is trading above its typical valuation. Another company trading below its long-term average could be a candidate for a mean reversion play, where valuations move back toward historical norms—assuming the business fundamentals remain intact.
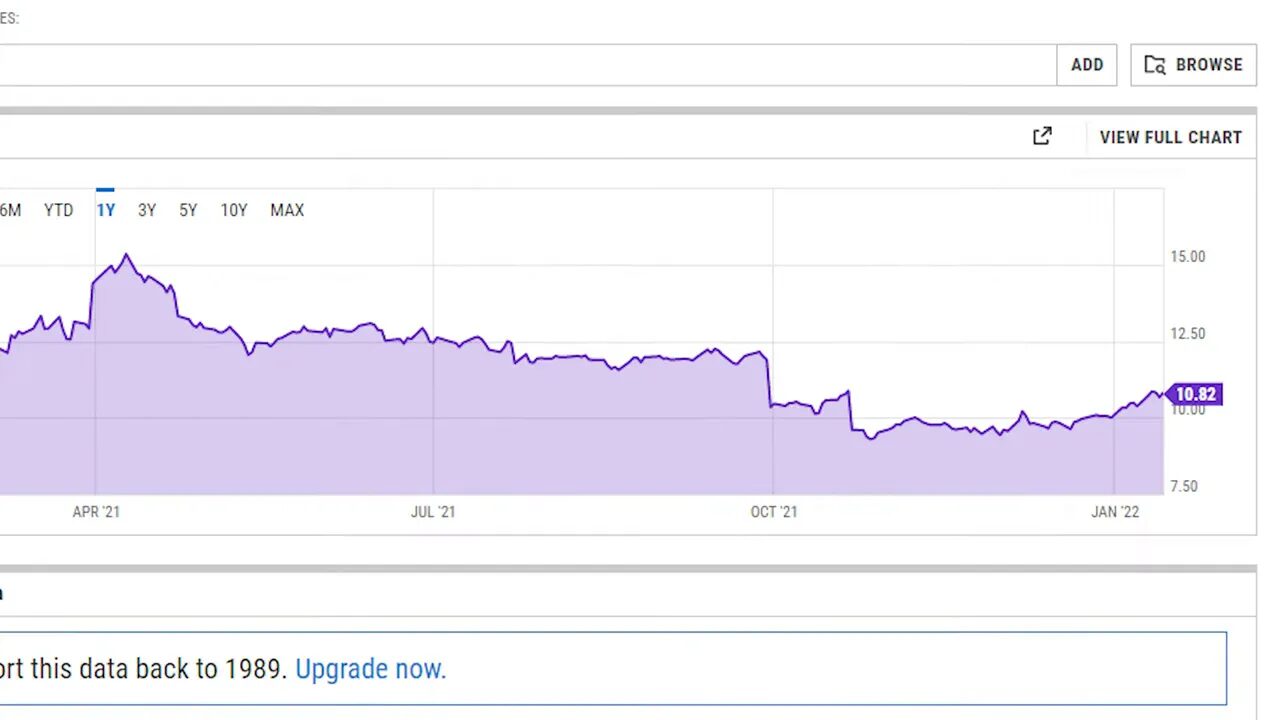
Mean reversion can work, but only when the underlying business is still sound. Short-term dips often look dramatic on a day-to-day chart but can be minor when you zoom out.
Compare to peers: industry context matters
Price alone is meaningless. A stock at $20 is not necessarily cheaper than a stock at $30. PE lets you compare apples to apples within the same industry.

If most firms in an industry trade around a PE of 15, a company with a PE of 15 is fairly valued versus its peers. A firm at PE 30 might still be justified if its growth prospects are much higher. Growth-heavy sectors like technology typically carry higher PEs than slow-growth sectors like utilities. Always benchmark against the sector average.
Cheap can be cheap for a reason
There is a famous banana analogy: one seller charges $5 per banana, another charges $1. The cheap banana might look like a steal, but when you peel it open it may be rotten. A very low PE can reflect real problems—declining revenue, flawed management, or a dying business model.

Valuation is secondary to quality. Find companies with solid fundamentals first—consistent earnings, healthy cash flow, sensible capital allocation—then use PE to find discounts among those quality names.
“It’s far better to buy a wonderful company at a fair price than a fair company at a wonderful price.” — Warren Buffett
How to use PE in a practical checklist
- Start with quality: screen for stable revenue, healthy margins, and strong management.
- Check trailing and forward PE: trailing for reality, forward for expectations—compare both.
- Compare to the company’s historical average: see whether valuation is unusually high or low.
- Compare to the sector: a low PE compared to peers can be attractive, but understand why it’s low.
- Look for catalysts: new products, management changes, or structural shifts can justify higher PEs.
- Don’t buy purely on price: cheap can stay cheap if the business is broken.
For traders who also follow crypto markets, remember that traditional metrics like PE do not apply to many blockchain projects. Crypto markets move for different reasons—protocol adoption, network activity, tokenomics changes, and cross-chain flows. If you trade both equities and crypto, it helps to use tools tailored to each market. Reliable trade signals can point to short-term opportunities across different blockchains while you use fundamental screens for stocks. A discreet crypto trading signals service can supplement your analysis by highlighting momentum and on-chain catalysts without replacing fundamental research.
Common pitfalls to avoid
- Relying on PE alone to make buy decisions
- Ignoring sector differences and growth rates
- Assuming forward estimates are facts rather than educated guesses
- Buying cheap companies without checking fundamentals
What is considered a good PE ratio?
There is no universal “good” PE. It depends on the industry and growth expectations. Mature industries often have lower PEs while high-growth sectors have higher ones. Compare a company’s PE to its long-term average and to peers to judge relative value.
Should I use trailing PE or forward PE?
Use both. Trailing PE reflects actual performance and is more reliable. Forward PE shows market expectations but depends on estimates. Compare the two to see whether the market expects growth or decline and verify whether those expectations are realistic.
Can PE ratios be used for crypto assets?
Most crypto tokens do not have earnings, so PE is not applicable. Crypto requires different metrics such as network activity, on-chain volume, staking yields, and token supply dynamics. For short-term crypto opportunities, combining on-chain data with a crypto trading signals service can help identify trades across different blockchains while you use equity valuation techniques for stocks.
