

Table of Contents
- Why mastering TradingView matters
- 1. Replay tool — practice like it is live
- 2. Indicator templates — save time and standardize setups
- 3. Keyboard shortcuts — speed up every workflow
- 4. Notes tool — keep your trading ideas on-chart
- 5. Trading panel and paper trading — execute and rehearse from the same screen
- 6. Chart layouts — monitor multiple perspectives at once
- 7. Details panel and More Technicals — fast multi-timeframe signals
- 8. Chart settings, layouts and dark mode — make charts readable
- 9. Better drawing tools — horizontal, extended lines, and quick hide
- 10. Pine editor and backtesting — validate strategies with data
- Quick tips to get more out of TradingView
- Final thought
- FAQ
Why mastering TradingView matters
TradingView is not just a charting platform. It is a complete toolbox for practicing, analysing, and executing trades faster and with more confidence. Small features that hide in menus or under icons can save hours, reduce mistakes, and help you treat trading like a repeatable process instead of guesswork. Below are 10 little-known but powerful TradingView features that will change how you trade.
1. Replay tool — practice like it is live
The replay tool lets you replay historical price action candle by candle. That means you can simulate how a setup would have unfolded in real time without hindsight bias. Pick a start candle on any timeframe, hit play, and control the playback speed. It is not perfect live trading because candles render fully from open to close, but it is one of the best ways to sharpen your entry timing and trade management.
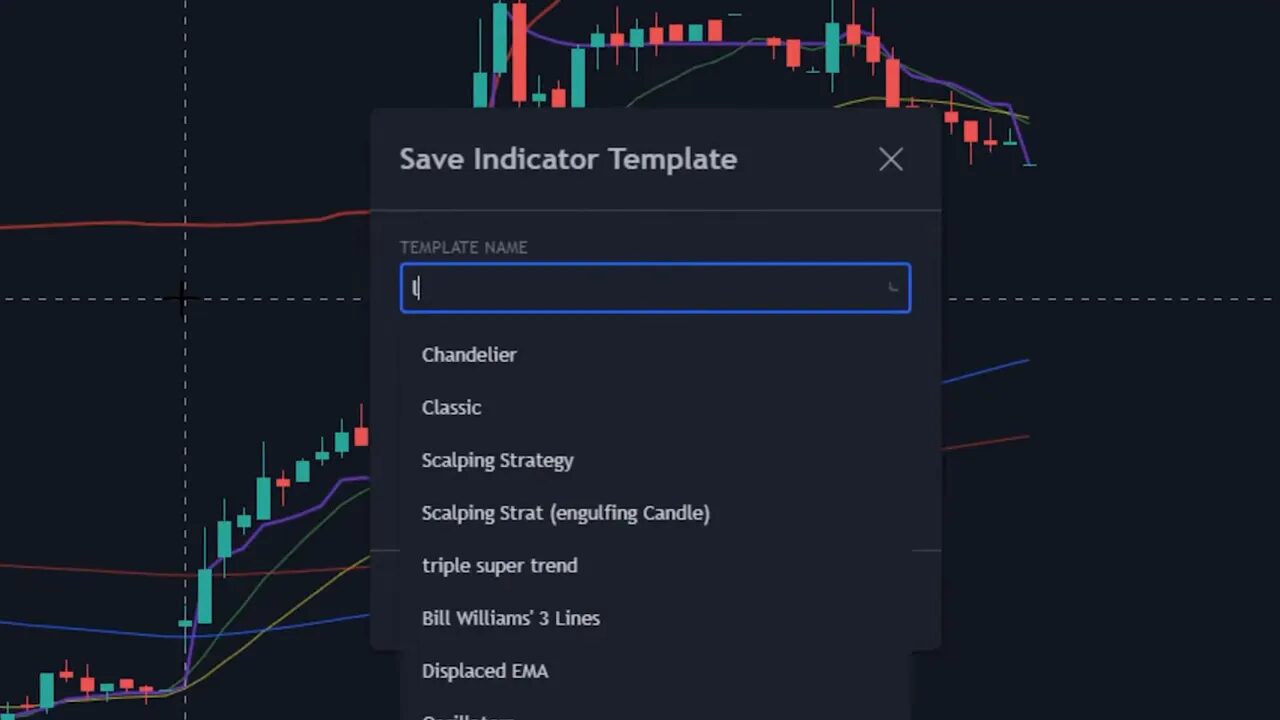
2. Indicator templates — save time and standardize setups
Instead of hunting for and reconfiguring multiple indicators every time you test a strategy, use the save indicator template function. Add the indicators you need, dial in parameters and colors, then save the template. Switching between strategies becomes a click, not a chore. This is a fundamental step toward consistent analysis and faster setup when markets move.
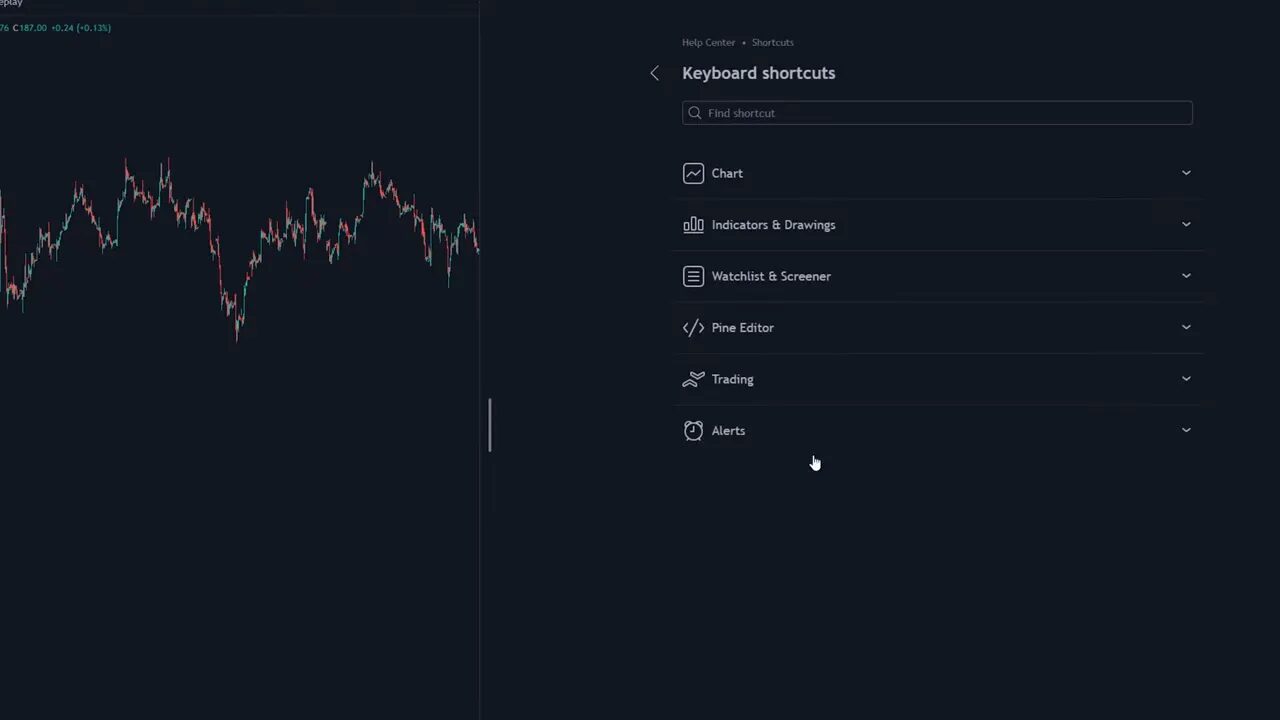
3. Keyboard shortcuts — speed up every workflow
TradingView includes a huge list of keyboard shortcuts hidden in the hamburger menu. Learning a handful of these will shave seconds off frequent tasks and minutes off overall screen time. Check the keyboard shortcuts section for drawing, chart navigation, and snapshot commands.
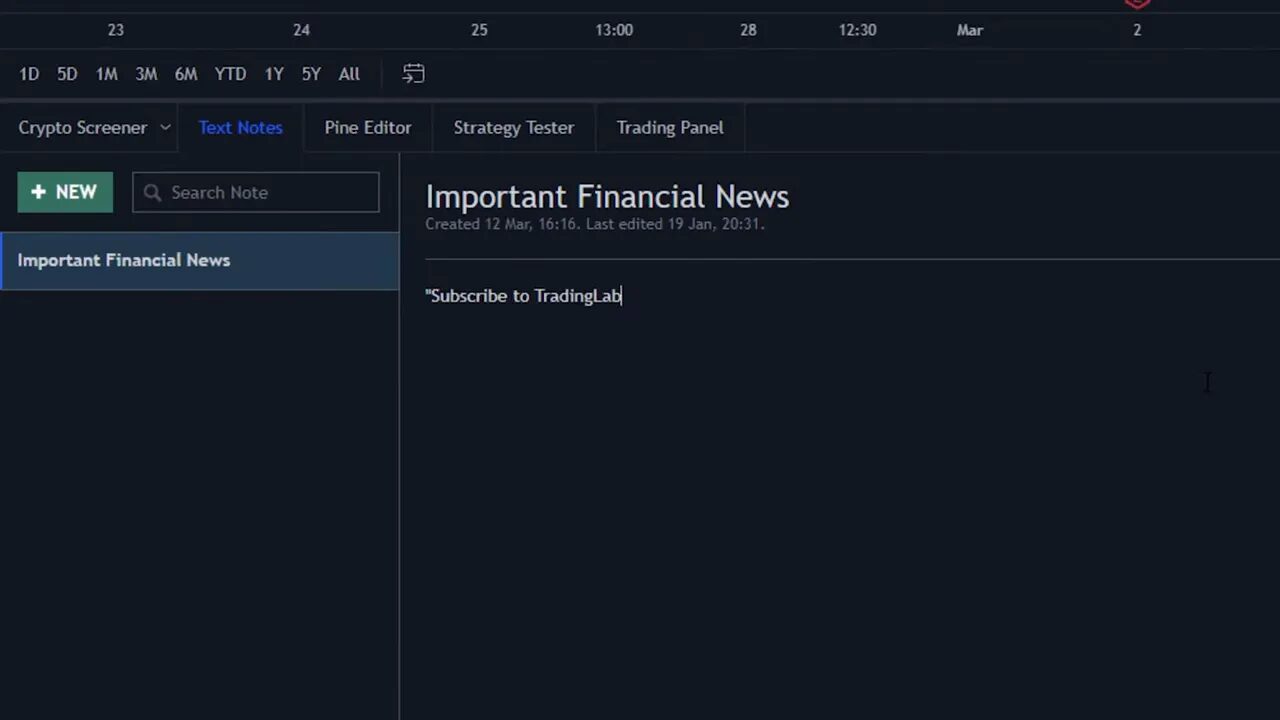
4. Notes tool — keep your trading ideas on-chart
Replace the sticky-note habit with the on-chart notes tool. Jot entry ideas, earnings reminders, or watchlist triggers directly on the chart so important thoughts do not get lost. When speed matters, having context in the same place as price is an underrated advantage.
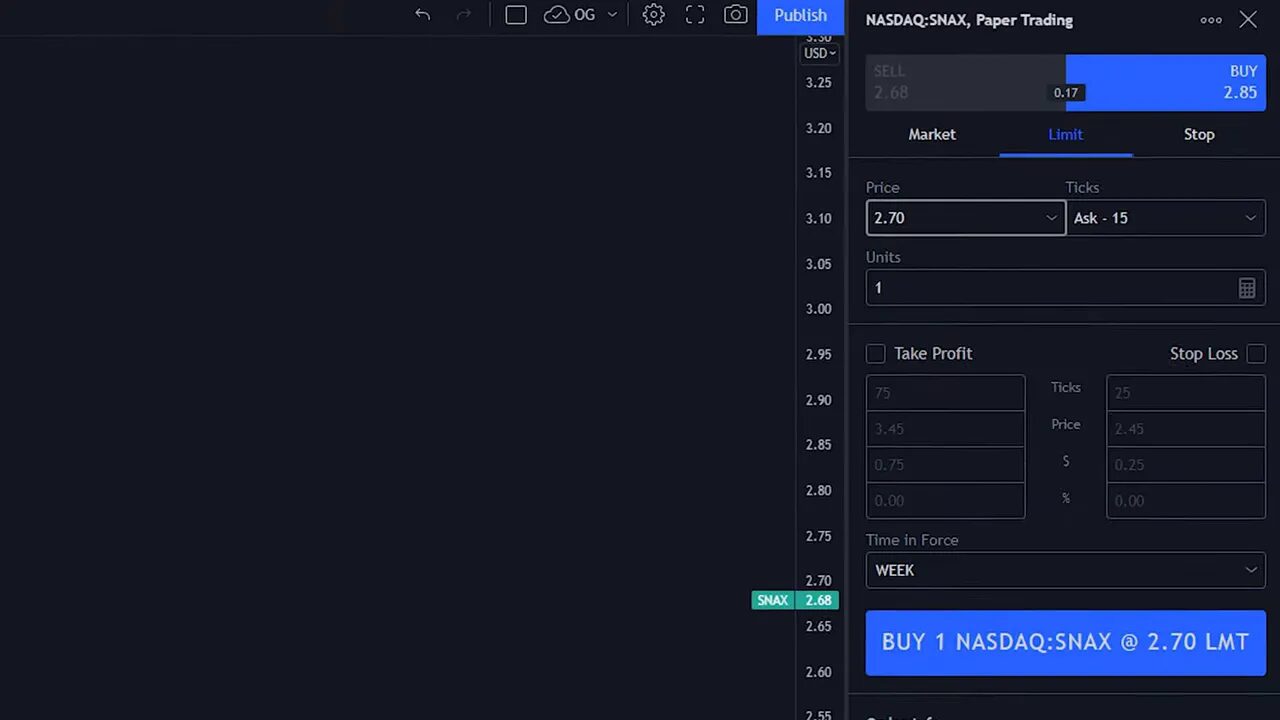
5. Trading panel and paper trading — execute and rehearse from the same screen
Connect compatible brokers directly through the TradingView trading panel to place live trades without switching platforms. There is also a built-in paper trading account for practicing with simulated funds. Paper trading is essential before risking capital and replicates the order entry experience so you can test timing, size, and execution rules.
For those active in crypto markets, pairing TradingView’s broker integrations with a reliable crypto trading signal service can accelerate idea discovery across blockchains. Signals can highlight potential entries and exits which you then validate and execute directly within TradingView or a connected broker. Use signals as a starting point, not a substitute for confirmation.
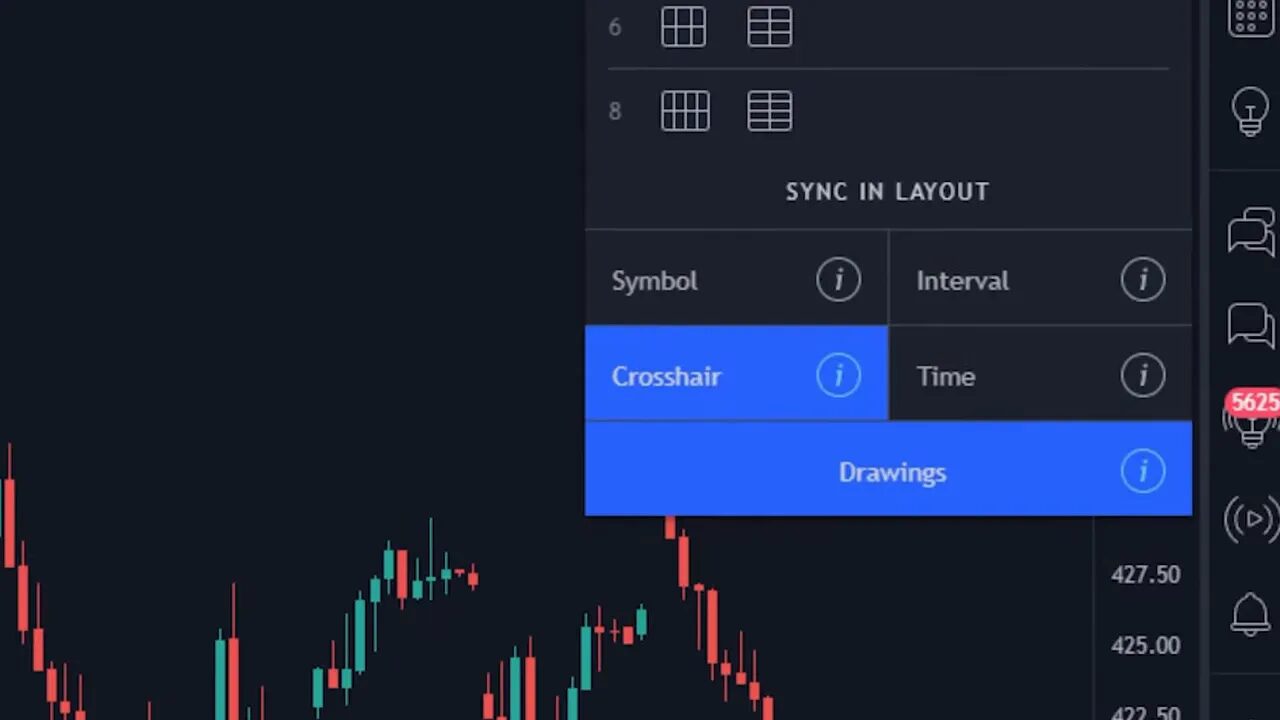
6. Chart layouts — monitor multiple perspectives at once
Use the chart layout tool to view multiple timeframes, different tickers, or correlated instruments side by side. Layouts can be synced so symbols, timeframes, or drawings update across charts simultaneously. This is invaluable for day traders who need to watch a one-minute and five-minute chart together or for traders comparing a stock to the S&P 500.
7. Details panel and More Technicals — fast multi-timeframe signals
The details panel (bottom right) hides a powerful button called More technicals. It opens three meters that show oscillators, a summary, and moving averages across selectable timeframes. Scroll further and you can see how each meter is calculated and what factors pushed a buy or sell rating. These meters update in real time and provide a quick second opinion when you need one.
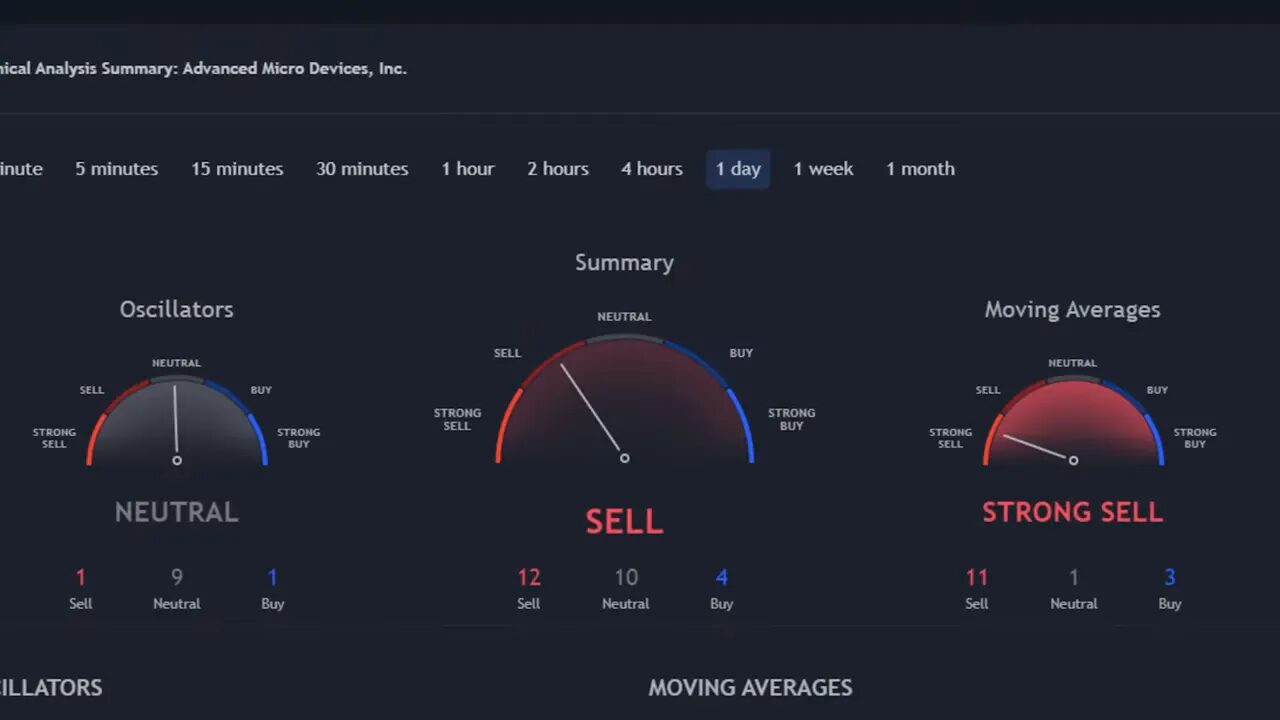
Use these meters as a filter rather than a green light. They are excellent for confirmation and spotting divergence across timeframes, but they do not replace your trading rules.
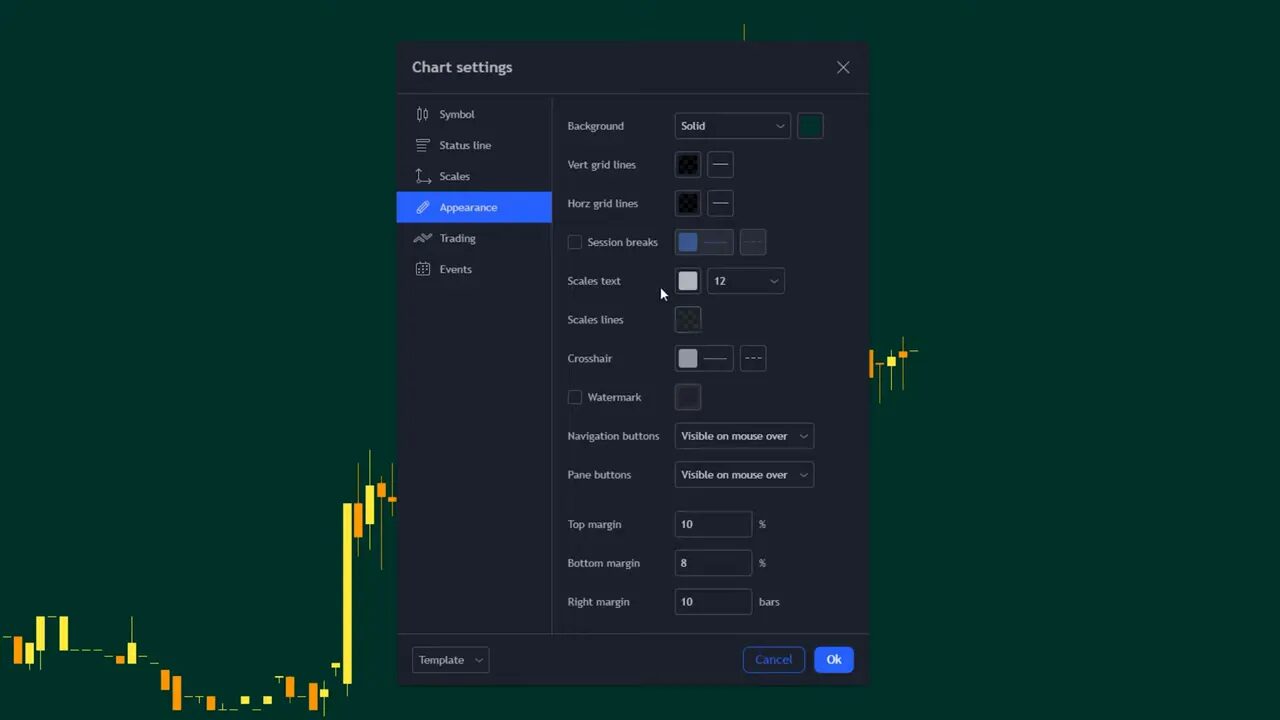
8. Chart settings, layouts and dark mode — make charts readable
Default chart colors and grid lines can be noisy. Open the chart settings to change candlestick colors, price line behavior, background, and grid visibility. Save custom layout themes so you can switch styling instantly between analysis modes. Dark mode reduces eye fatigue and often looks cleaner, especially during longer sessions.
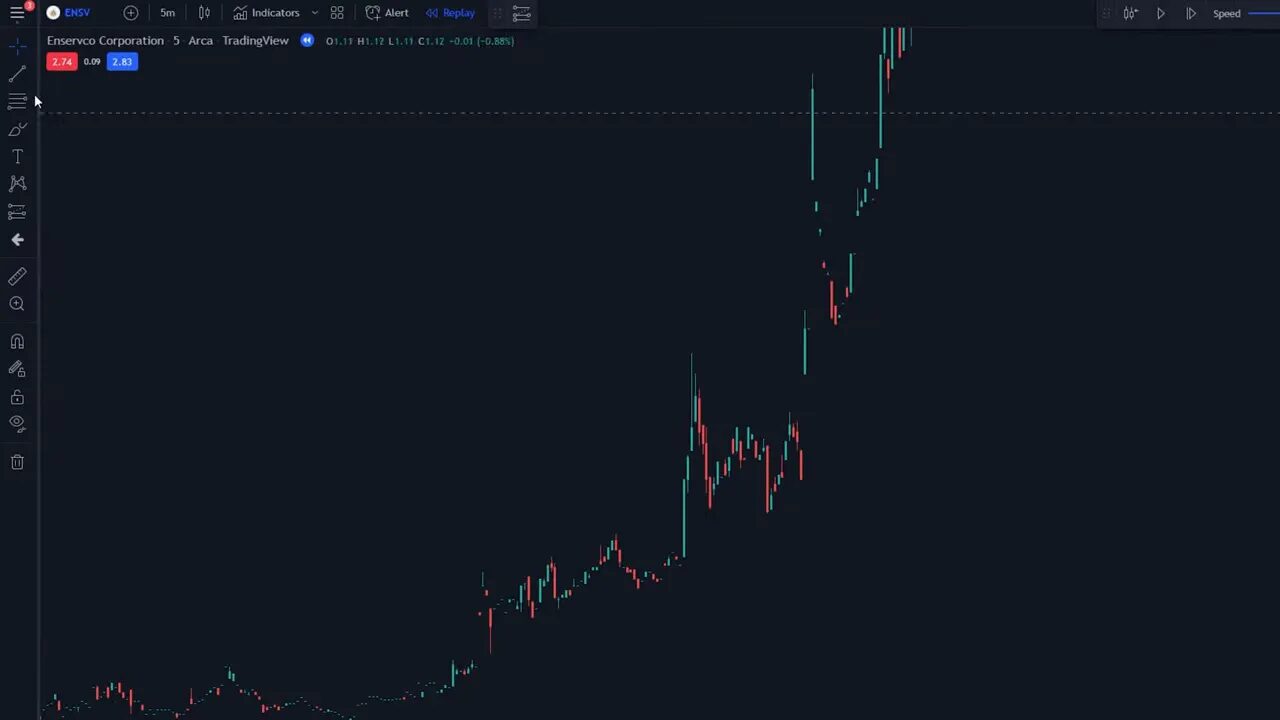
9. Better drawing tools — horizontal, extended lines, and quick hide
Basic trendline drawings can skew or require constant adjustment. For support and resistance, use the horizontal line tool to draw perfect levels across the chart. For trendlines that should extend indefinitely, use the extended line tool to avoid repeatedly moving your lines as price evolves. When you want to declutter the screen without deleting work, use the hide drawings option to toggle visibility of drawings and indicators.
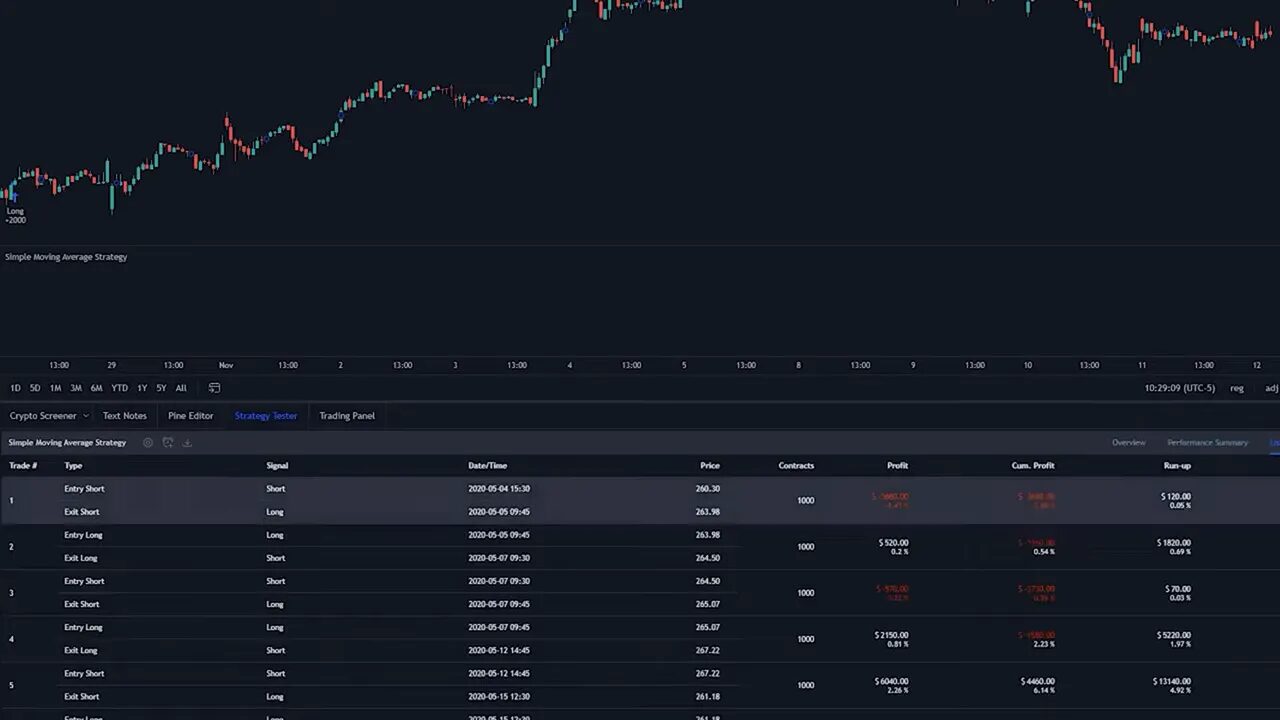
10. Pine editor and backtesting — validate strategies with data
The Pine editor lets you code and backtest strategies over years of historical data. It requires basic scripting, but even a simple script can generate detailed trade lists, win rates, and net profit figures. Backtesting transforms opinions into evidence: tell the platform your entry and exit rules and it will show every simulated trade on the chart and in statistical output.
Backtesting is how you separate hopeful ideas from robust strategies. If you are new to scripting, start with template scripts and tweak one parameter at a time. For those trading multiple asset classes, backtest across stocks, Forex, and crypto to see how a strategy behaves on different volatility profiles. Combining backtested rules with real-time support from a trusted crypto trading signal service can help you shortlist opportunities and reduce time spent scanning different blockchains.
Quick tips to get more out of TradingView
- Save indicator templates and chart layouts to build repeatable setups you can deploy instantly.
- Use replay sessions for procedural practice rather than just looking at past charts with hindsight.
- Paper trade until execution and size rules feel automatic.
- Combine objective filters like the More Technicals meters with your own rules to avoid impulsive trades.
- Hide drawings when preparing clean screenshots or presentations so your chart remains readable.
Final thought
TradingView contains many features that reward exploration. The difference between a hobbyist and a professional approach often comes down to process. Use templates, notes, replay sessions, and backtests to make your edge repeatable. Integrate supportive tools like paper trading and selective signal services when appropriate, but always validate ideas with data before risking capital.
FAQ
How do I use the replay tool to practice entries?
Open a chart, click the replay icon, select a start candle, and press play. Adjust playback speed with the dial to practice reading candles and executing entries without hindsight bias.
Can I place live trades from TradingView?
Yes. Connect a supported broker via the trading panel to place live orders directly from TradingView. There is also a paper trading option for risk-free practice.
Do I need to code to backtest in Pine editor?
Basic scripting knowledge helps, but many community scripts and simple examples exist to get started. Learning a few Pine basics enables you to test rules and view comprehensive performance metrics.
How do I save my chart appearance and indicators?
Use the save indicator template option to store indicator setups and the save layout option to preserve chart styling, background, and grid preferences. Load them quickly when switching strategies.
Are the More Technicals meters reliable for trade decisions?
They are a useful summary and confirmation tool, showing oscillators and moving average signals across timeframes. Use them as an extra data point rather than the sole decision-maker.
