

Table of Contents
- Why I dug into MACD
- What is MACD and how it works
- Four common MACD strategies traders use
- Why MACD signals sometimes fail
- How I tested MACD (method and markets)
- Backtest results — crossover strategy
- Backtest results — trading extremes
- What are the best MACD settings?
- Practical takeaways
- FAQ
Why I dug into MACD
I spent a week researching the MACD, testing popular strategies, and backtesting thousands of parameter combinations across multiple markets. The goal was simple: figure out how useful MACD signals actually are, which strategies have an edge, and whether the default settings are optimal. The short takeaway: MACD can be powerful, but it is not a magic formula. Context and testing matter.
What is MACD and how it works
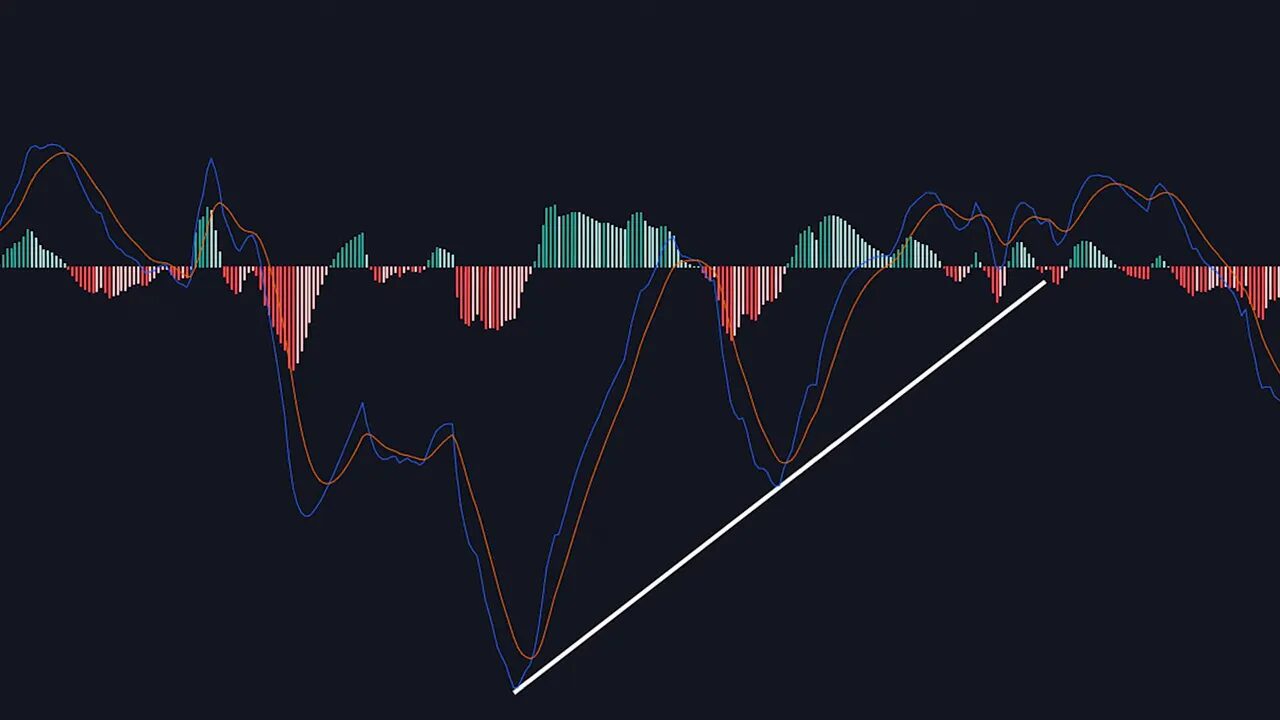
The MACD stands for Moving Average Convergence Divergence. It compares two exponential moving averages to measure momentum and has four main parts: the MACD line, the signal line, the histogram (the difference between the two lines), and the zero line which marks the center. The default inputs are 12 for the fast EMA, 26 for the slow EMA, and 9 for the signal smoothing, but these can be changed.
Four common MACD strategies traders use
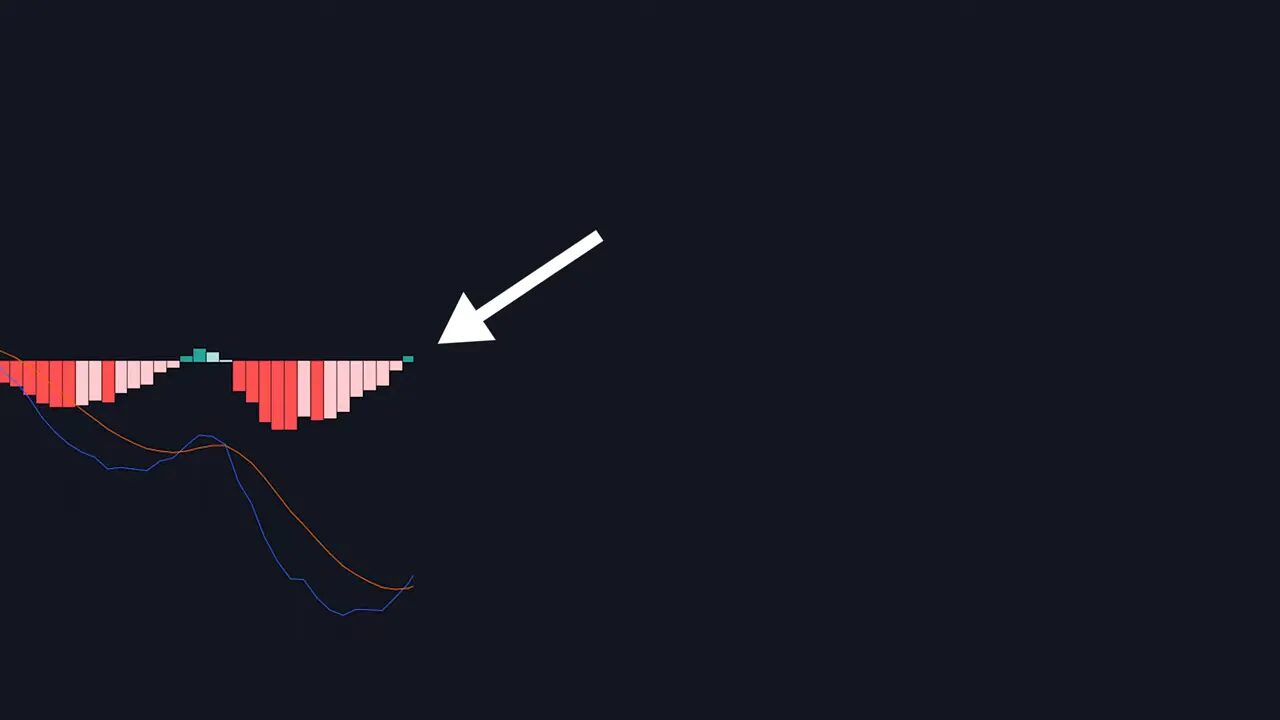
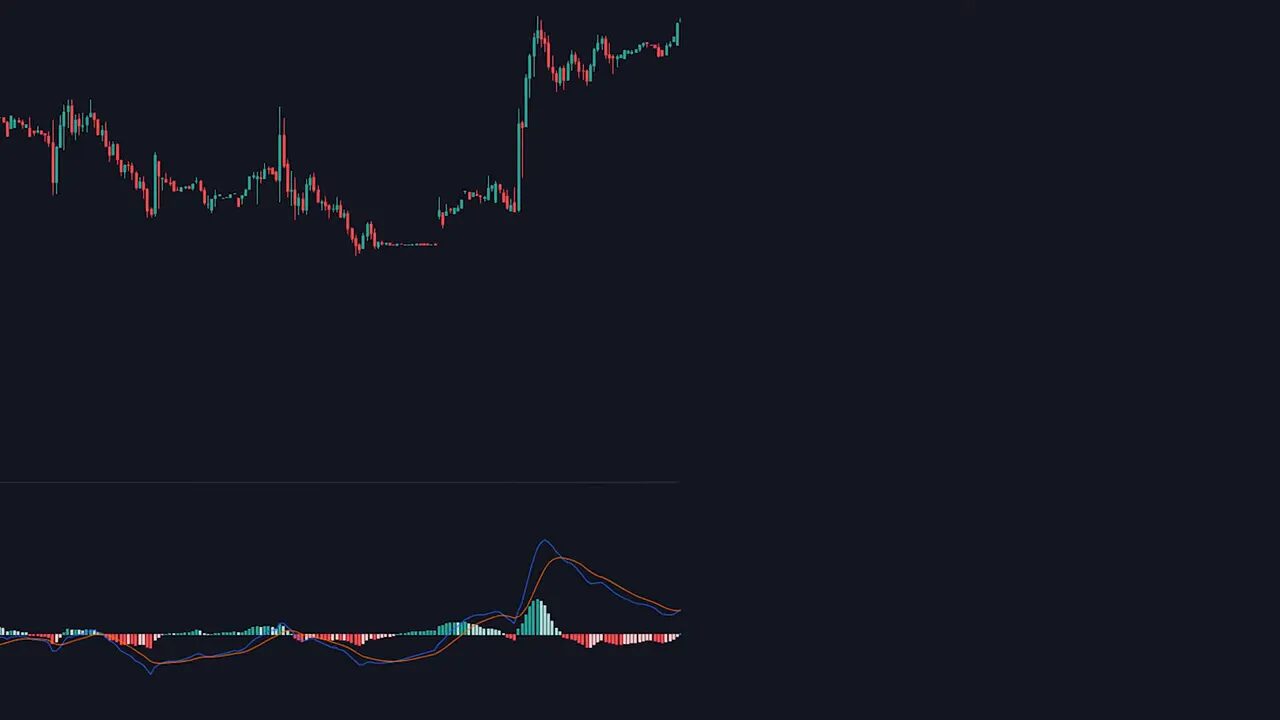
1. Crossovers (histogram color change)
Buy when the MACD line crosses above the signal line (histogram turns green). Sell when it crosses below (histogram turns red). The logic: short-term momentum overtakes long-term momentum for a potential trend.
2. Divergence
Look for price making higher highs while MACD fails to make higher highs (bearish divergence), or price making lower lows while MACD does not (bullish divergence). This attempts to spot weakening momentum before a reversal.
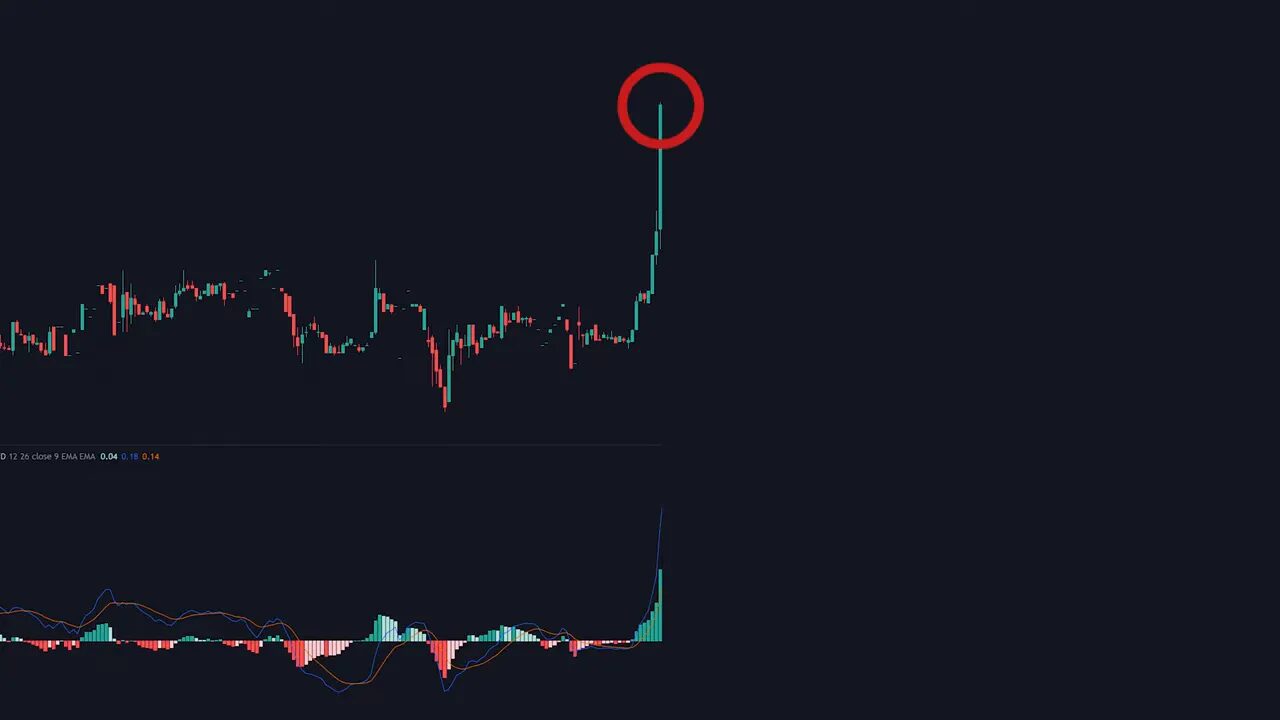
3. Trading extremes
Enter against extreme spikes in the histogram. The idea: when momentum becomes extreme, a pause or reversal is likely. This strategy looks for MACD readings in the top or bottom percentiles of their historical distribution.
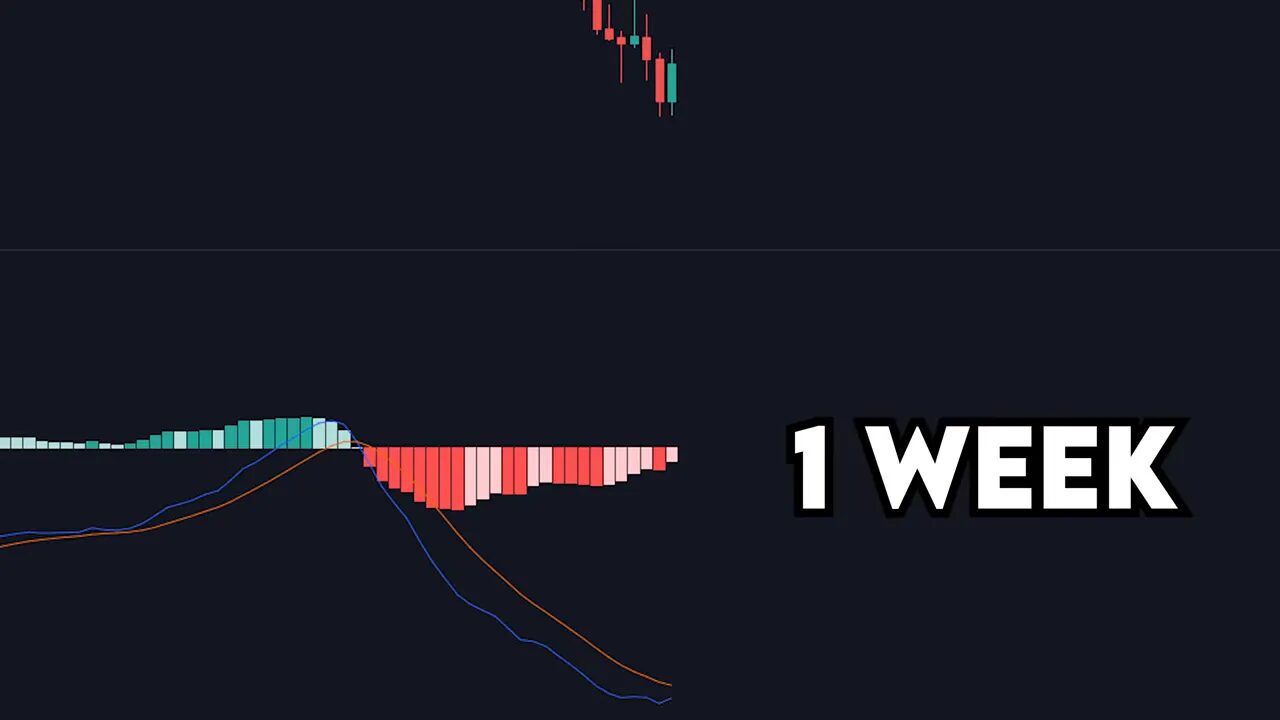
4. MACD as a trend filter
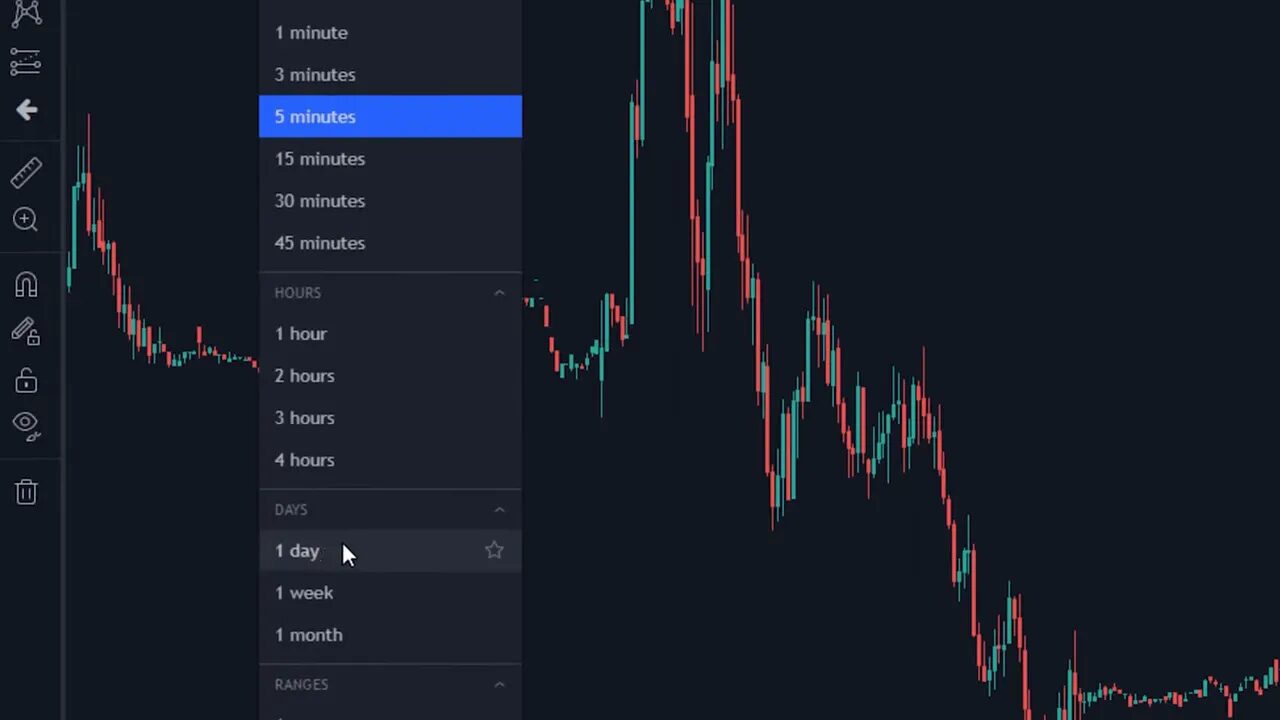
Use MACD on a higher timeframe to define the bias for your trading timeframe. For example, if you trade daily but the weekly MACD histogram is positive, favor long trades; if negative, favor shorts. This is simply a way to align with higher-timeframe momentum instead of trading against it.
Why MACD signals sometimes fail
- Crossovers can be whipsaws: Momentum can weaken briefly and then resume, producing false exits and re-entries.
- Divergence is subjective: Two traders can look at the same chart and call divergence differently. That makes reliable backtesting and mechanical rules difficult.
- Extremes can keep going: A very large MACD reading does not guarantee an immediate reversal. Extreme momentum can extend further.
- Trend filters need context: Using a higher timeframe MACD can help, but many traders prefer a straightforward trend measure like a 200-period EMA to decide bias.
How I tested MACD (method and markets)
To keep results objective I focused on mechanical rules and historical data. I removed divergence from the formal backtests because it is too subjective and hard to quantify. I also excluded the trend-filter-only approach as a stand-alone strategy because it is usually combined with other entries.
That left two strategies to test mechanically:
- MACD crossover: enter long when the histogram is positive; enter short when negative. Daily timeframe tests.
- MACD extremes: detect historical top or bottom 5 percent histogram readings (converted to a percentage of price range so a bot can detect extremes) and measure subsequent returns.
Markets tested: S&P 500, gold, and the US Dollar Index. Timeframe for the core backtests: daily (results cover 1928 to 2018 for the S&P example).
Backtest results — crossover strategy
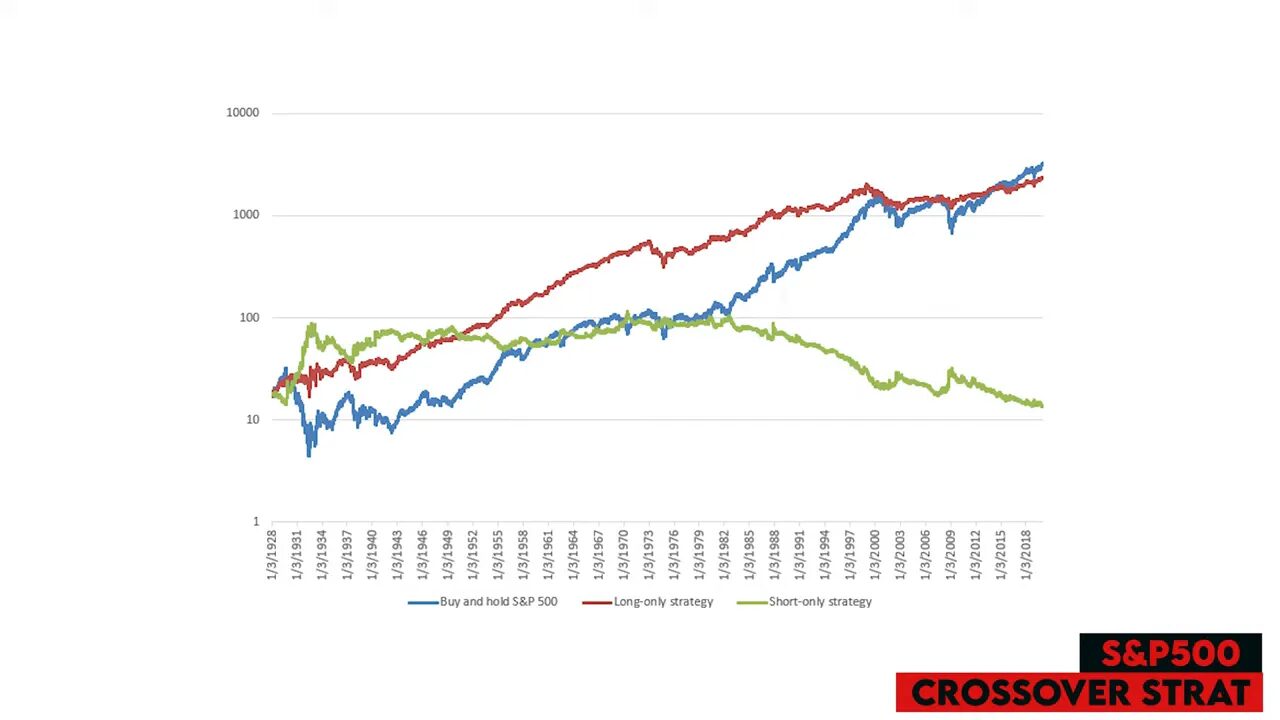
Summary of what happened when the strategy was automated (enter long only when histogram positive, short only when negative):
- S&P 500: Bullish MACD signals produced some gains but neither long-only nor short-only MACD strategies beat a simple buy-and-hold of the index. Buy-and-hold outperformed the mechanical MACD crossover on this long-term test.
- Gold: Long-only MACD entries outperformed buy-and-hold on gold. Short entries were positive but weaker.
- US Dollar Index: The short-only MACD strategy performed best for the dollar index; long-only came second. Both were well above buy-and-hold for that market.
Backtest results — trading extremes
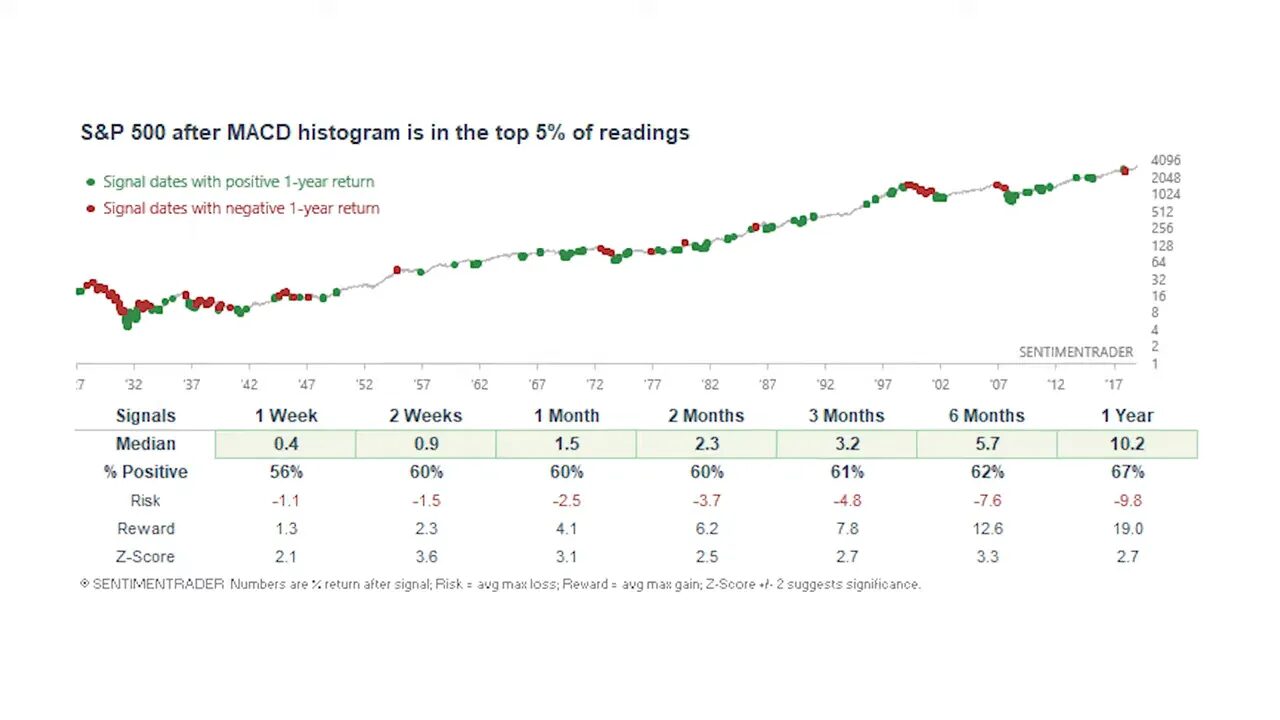
To quantify extremes, I converted the MACD histogram into a percentage measure so the algorithm could find top and bottom 5 percent readings and then track what came next.
- S&P 500: Extremely high MACD readings tended to be followed by more upside rather than immediate reversals. In other words, momentum often persisted after a big spike.
- Gold: No clear statistical edge when trading extremes. Top 5 percent and bottom 5 percent readings did not reliably predict direction.
- US Dollar Index: Extremes tended to produce more extremes — a high histogram often preceded further dollar strength and a low reading preceded continued weakness.
What are the best MACD settings?
Default settings are 12, 26, 9. I asked a bot to brute-force test every integer combination between 2 and 60 for the fast, slow, and signal lengths on the S&P 500 using simple rules: enter long when histogram is positive and exit when it turns negative. Tests ran on daily and weekly timeframes.
Results found optimal past settings (remember these are historical-best and not guaranteed to work going forward):
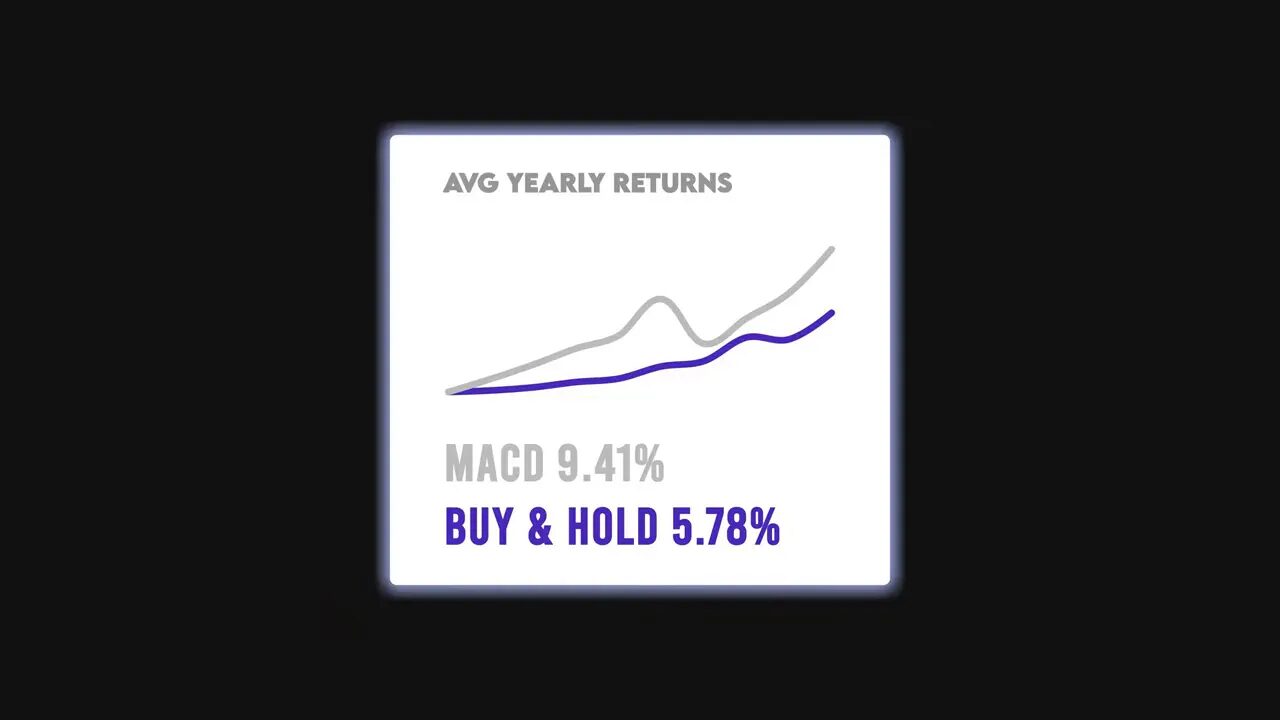
- Daily optimal: 2, 60, 2 — average profit about 9.41% per year versus buy-and-hold at 5.78% per year (dividends not reinvested in that comparison).
- Weekly optimal: 30, 57, 27 — strategy averaged 6.12% per year versus buy-and-hold at 5.78% per year.
Key point: the best settings from historical data were not the defaults. That underlines the value of testing rather than assuming the factory values are ideal for your market and timeframe.
Practical takeaways
- MACD is useful but not infallible: It gives insight into momentum and can be an effective part of a trading plan, but it should not be treated as a single-source, exact signal.
- Test for your market and timeframe: Optimal settings vary. Brute-force backtesting helped find non-default parameters that worked historically for the S&P 500.
- Combine tools: Use MACD with price action, trend measures like a 200 EMA, risk management rules, and other indicators to reduce false signals.
- Beware of subjectivity: Divergence looks powerful in hindsight but suffers from inconsistent interpretation in live trading and is hard to backtest mechanically.
- Past performance is not a promise: Backtesting reveals historical edges but market regimes change. Keep adapting and re-testing.
FAQ
What does MACD stand for and what does it measure?
MACD stands for Moving Average Convergence Divergence. It measures momentum by comparing two exponential moving averages and plotting the difference as the histogram, alongside a signal line and zero center to indicate trend strength and direction.
Are the default MACD settings the best?
Not necessarily. Defaults are 12, 26, 9, but backtests showed different settings (for example, 2, 60, 2 on the S&P daily test) produced higher historical returns. Optimal settings depend on market and timeframe, so test before adopting.
Which MACD strategy performed best in tests?
Results varied by market. For crossovers, MACD long-only did not beat buy-and-hold on the S&P but outperformed buy-and-hold on gold. For the US Dollar Index, short-only crossovers did very well. Extremes showed persistence in the S&P and USD, but no edge in gold.
Can I use MACD alone for trading?
Relying solely on MACD is risky. It should be part of a broader system that includes trend context, risk management, price action, and other indicators. Mechanical backtests can reveal edges, but combining signals usually improves reliability.
How should I decide which MACD settings to use?
Backtest combinations on the specific market and timeframe you trade. Avoid assuming defaults are best. Also periodically re-test because market behavior changes over time.
