

There are patterns the market repeats so often they almost feel predictable if you know what to look for. I built a free indicator that automatically spots one of those patterns — a simple, high-probability price action formation I call the ABC pattern — and I’m sharing how to use it across stocks, forex, and crypto.
Table of Contents
- What the ABC Pattern Is (and why it works)
- How the Indicator Helps
- Entry, Stop Loss, and Take Profit Rules
- Filtering False Setups with RSI
- Use Higher Timeframe Support to Raise Win Rates
- Applying This to Crypto, Stocks, and Forex
- Live Examples
- Practical Tips and Common Mistakes
- Why This Indicator Is Useful
- How do I get the indicator?
- Can I use this on any timeframe and any market?
- What RSI settings should I use for the confirmation filter?
- How do I manage losing streaks?
- Is this indicator free?
- Final Notes
What the ABC Pattern Is (and why it works)
The ABC pattern is straightforward. It maps three key swing points after a directional move:
- Point A — the end of the initial trend (for a bullish setup this is the lowest point).
- Point B — the short-term high after price reverses from A and starts a new trend.
- Point C — the pullback or retracement after B. For a valid long setup, C must remain above A.
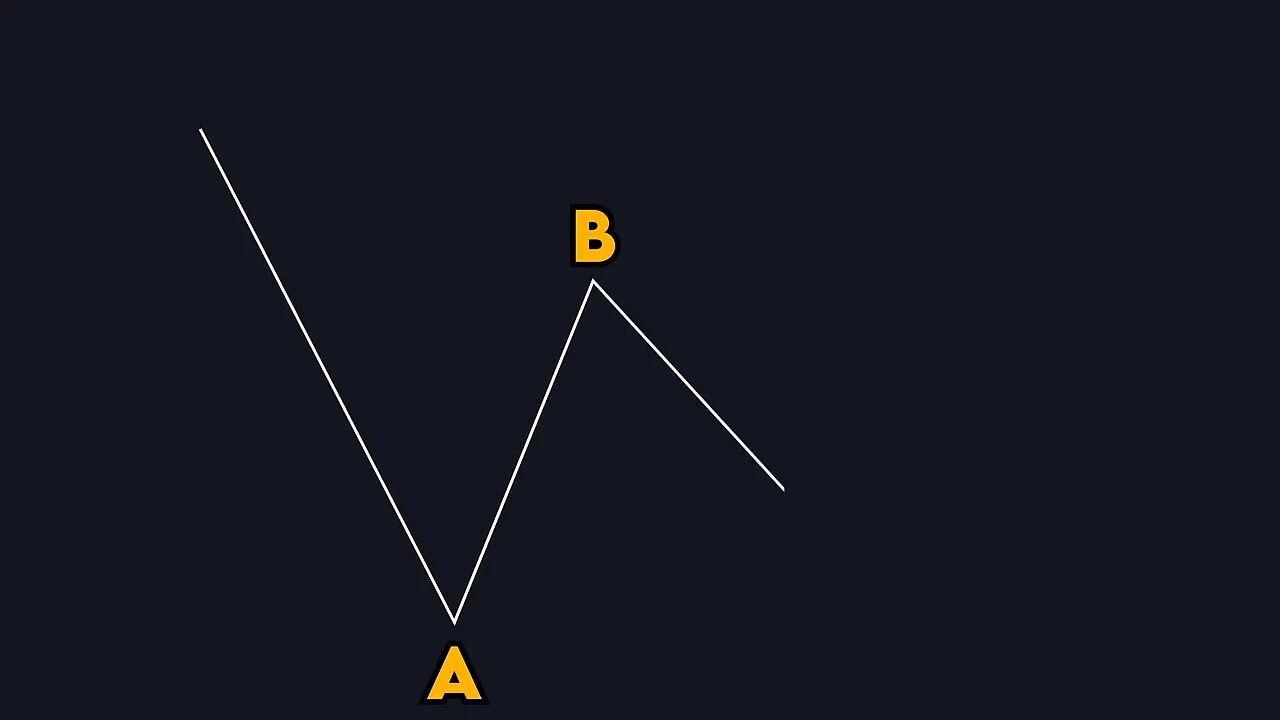
Once B creates a new short-term high, price will often test and then break that level. The moment price breaks that B high is the trigger for a long entry. For shorts, the logic mirrors: an uptrend makes A, B, C pulls back, then a break below the short-term low signals a short.
How the Indicator Helps
Manually drawing A, B, and C can be tedious and subjective. The indicator automatically:
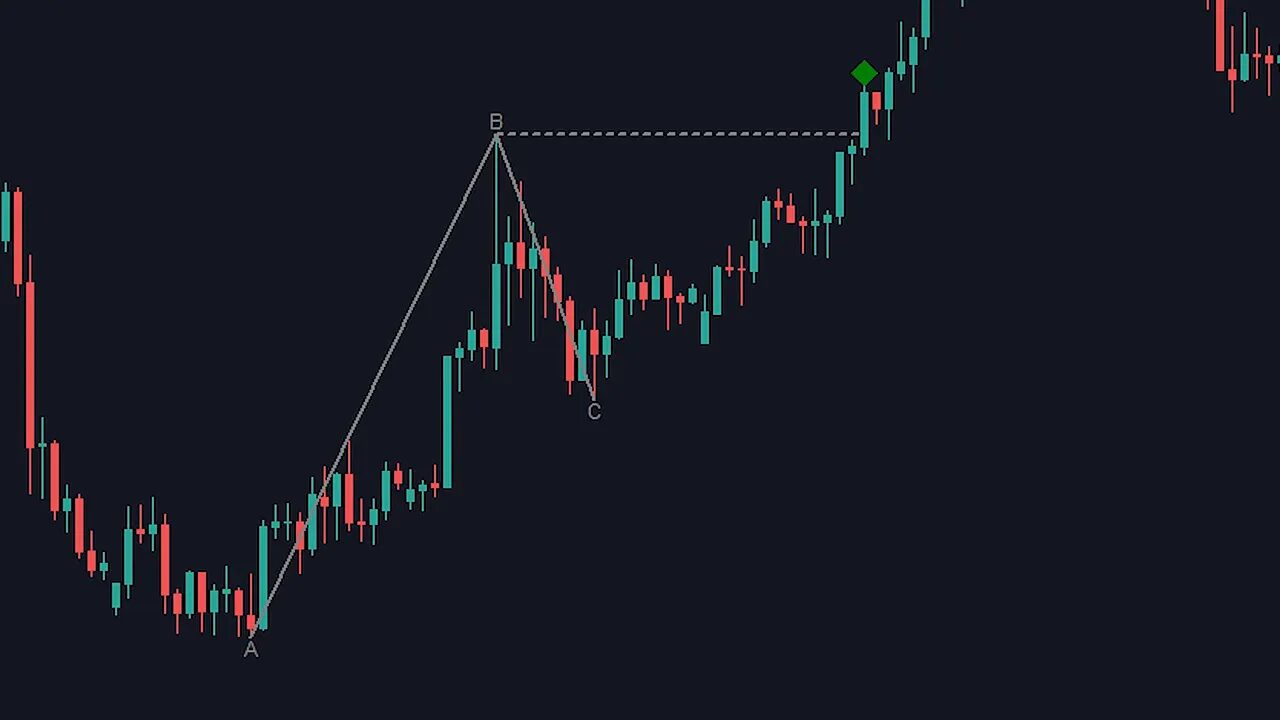
- Draws the A-B-C structure and the dotted breakout line for you.
- Labels the setup as long or short.
- Displays a diamond signal when the breakout happens (green for long, red for short).
Entry, Stop Loss, and Take Profit Rules
Follow these simple rules when trading an ABC signal:
- Entry: Enter at the breakout of the dotted line that marks the B level.
- Stop Loss: Place the stop just beyond point C.
- Take Profit: Aim for a 1:2 risk to reward ratio as a default. Adjust depending on structure and higher timeframe context.
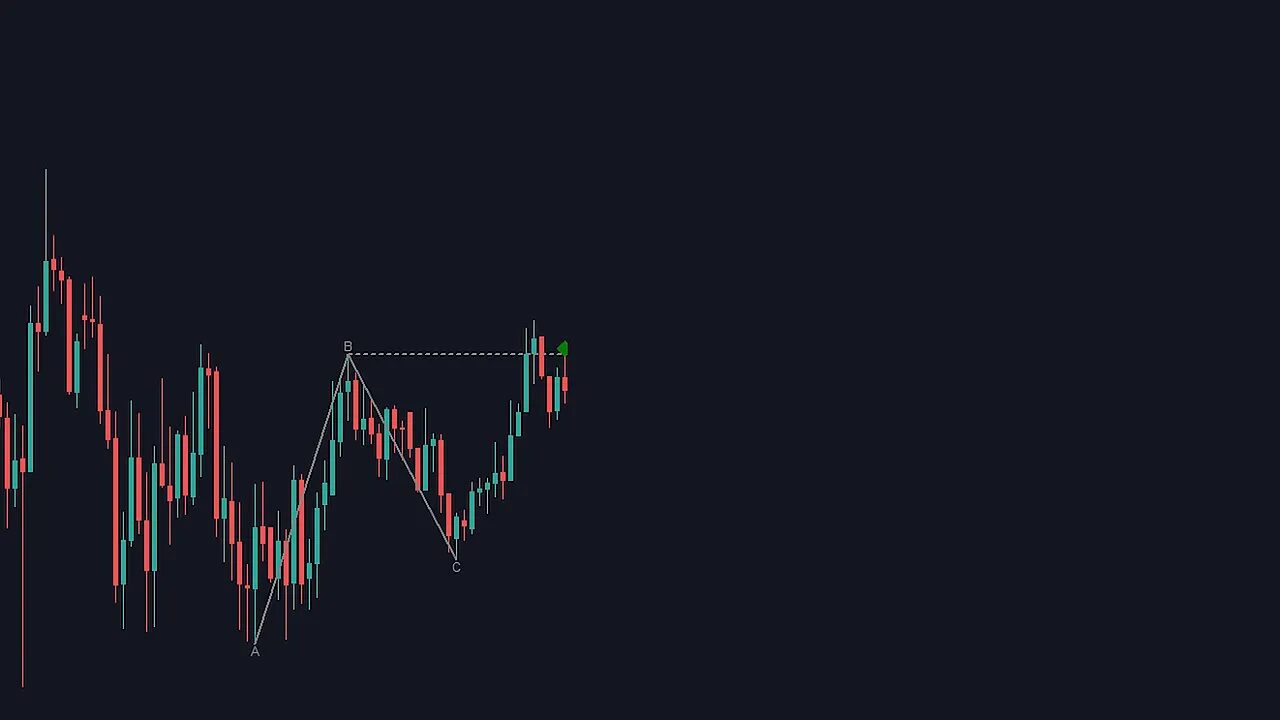
After entering, price can wobble a bit, but when the setup is healthy the momentum usually follows and hits the target cleanly.
Filtering False Setups with RSI
Not every ABC formation leads to a winner. To filter weaker formations, add an RSI check:
- Use the RSI midline at 50 as the reference.
- For long trades, point B on the RSI must be above 50.
- Additionally, point C on the RSI must be above point A on the RSI.
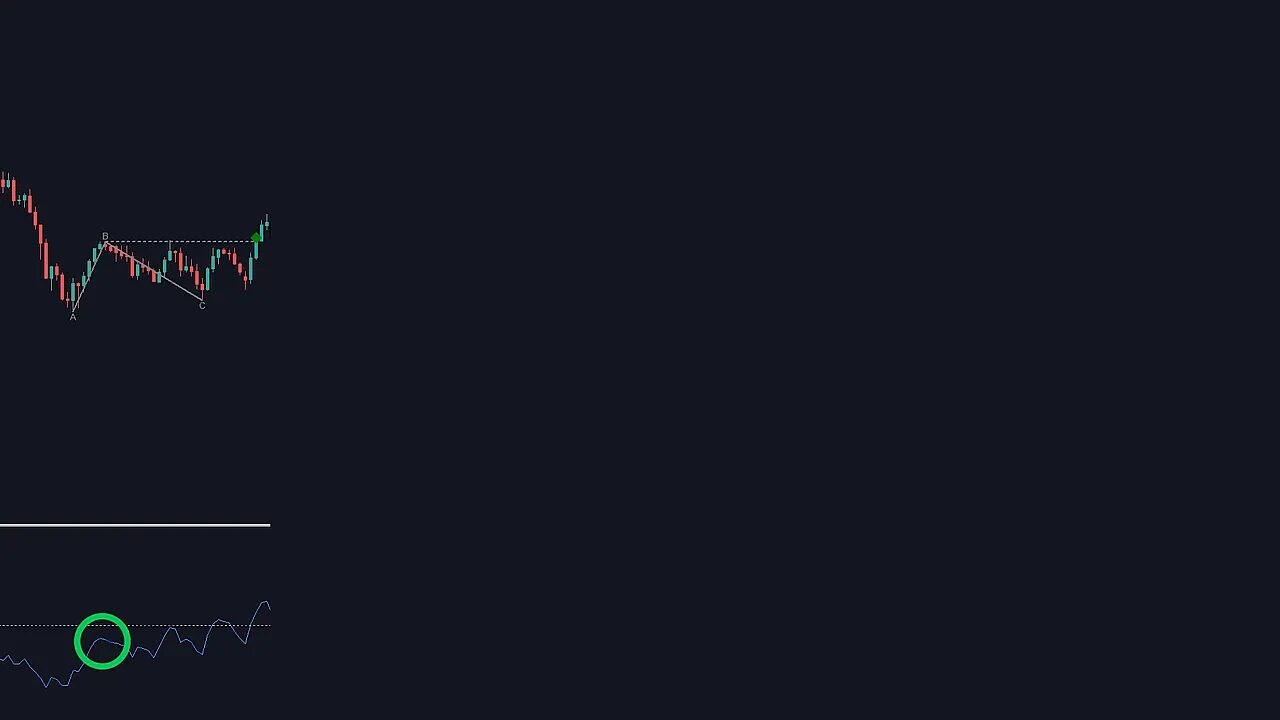
This double check on the RSI significantly reduces losing trades by ensuring the structure has momentum backing it. If B is below 50 or C does not exceed A on the RSI, skip the trade.
Use Higher Timeframe Support to Raise Win Rates
One final edge: if point A aligns with a strong support zone on a higher timeframe (one hour or daily), the win probability improves substantially. Before taking a long trade, zoom out and see whether A is bouncing off a demand level — that context matters.
Applying This to Crypto, Stocks, and Forex
This is a pure price action setup, so it shows up across markets. On crypto chains where volatility and liquidity vary, the ABC formation still appears — but it helps to prioritize setups.
When scanning many coins or cross-pairs, pairing the ABC indicator with curated free crypto signals helps you filter the best opportunities quickly. The signals point out coins and pairs with strong momentum, while the ABC indicator times entries within that momentum. Together they make finding high-probability crypto setups much faster and less noisy.
Live Examples
Long example: the indicator identifies A, B, and C, draws the dotted breakout line, and produces a green diamond as price breaks. Stop under C, target 1:2, and the trade often completes with a clean push upward.
Short example: same rules inverted. The indicator marks the structure, price breaks the dotted line to the downside, a red diamond confirms entry, stop above C, and target 1:2.
Practical Tips and Common Mistakes
- Be strict about C staying above A for longs. If C dips below A, toss the setup and wait for the next one.
- Use RSI as your confirmation filter. It will save you from many false breakouts.
- Never trade blindly on the signal alone. Check higher timeframe structure and liquidity.
- Consider adjusting take profit targets when price approaches known supply or resistance zones on higher timeframes.
Why This Indicator Is Useful
Because it’s price action based, the indicator is simple, fast, and adaptable. It removes the guesswork of drawing swing points and gives you consistent entries and risk rules. Use it on TradingView or your charting platform of choice, combine it with RSI, and mark higher timeframe support and resistance for the best results.
“It’s free real estate.”
How do I get the indicator?
Sign up with your email on the download page to receive the indicator file. The installer will add the ABC detection to your charts so you can start scanning for setups immediately.
Can I use this on any timeframe and any market?
Yes. The ABC formation appears across timeframes and markets — forex, stocks, and crypto. Shorter timeframes produce more signals but more noise; higher timeframes produce fewer signals with stronger conviction.
What RSI settings should I use for the confirmation filter?
The standard RSI with the 50 midline is sufficient. Use the RSI to check that point B is above 50 for longs, and that point C on RSI is above point A. This simple filter improves the strategy’s win rate.
How do I manage losing streaks?
Stick to the rules: strict stops at C and consistent position sizing. Expect losing trades; the goal is to keep losses small and let winners run to your 1:2 target. Review setups that failed and consider whether the RSI or higher timeframe context would have filtered them.
Is this indicator free?
Yes, it is offered for free. It was designed as a gift to help traders find clean price action entries without manual drawing.
Final Notes
This indicator is a practical way to apply price action consistently. It automates the tedious parts and leaves you to focus on context and execution. Use the RSI filter and higher timeframe support checks to improve your edge, and consider integrating curated free crypto signals when scanning the many coins and chains to prioritize the most promising setups.
Keep refining your process. Price action is patient; traders are not. Stick to your rules, learn from each setup, and the edge grows over time.
