

Table of Contents
- Why machine learning matters for trading
- How the machine learning engine works (in plain terms)
- The baseline: visualizing predictions in real time
- How to use the tool in your trading
- Best practices and tips
- Community and continuous improvement
- Frequently asked questions
- Closing thoughts
Why machine learning matters for trading
I decided to take a leap into machine learning because markets are changing. Computers are getting smarter every day, and when you feed them years of market data they can begin to spot patterns humans miss. The goal was simple: build an indicator that doesn’t just show current momentum, but predicts what price is likely to do next based on how similar situations played out in the past.
How the machine learning engine works (in plain terms)
The core idea is straightforward even if the math behind it is not. The indicator watches a basket of popular tools — RSI, CCI, ADX, and others — and records their values across the entire history of the chart you are looking at. It then asks: when these indicators looked like this before, where did price go next?
Instead of finding a single match, the engine finds tens of thousands of historical moments that closely resemble the current readings, looks at what happened next in each case, averages those outcomes, and uses that average to produce a prediction. All of this happens in milliseconds.
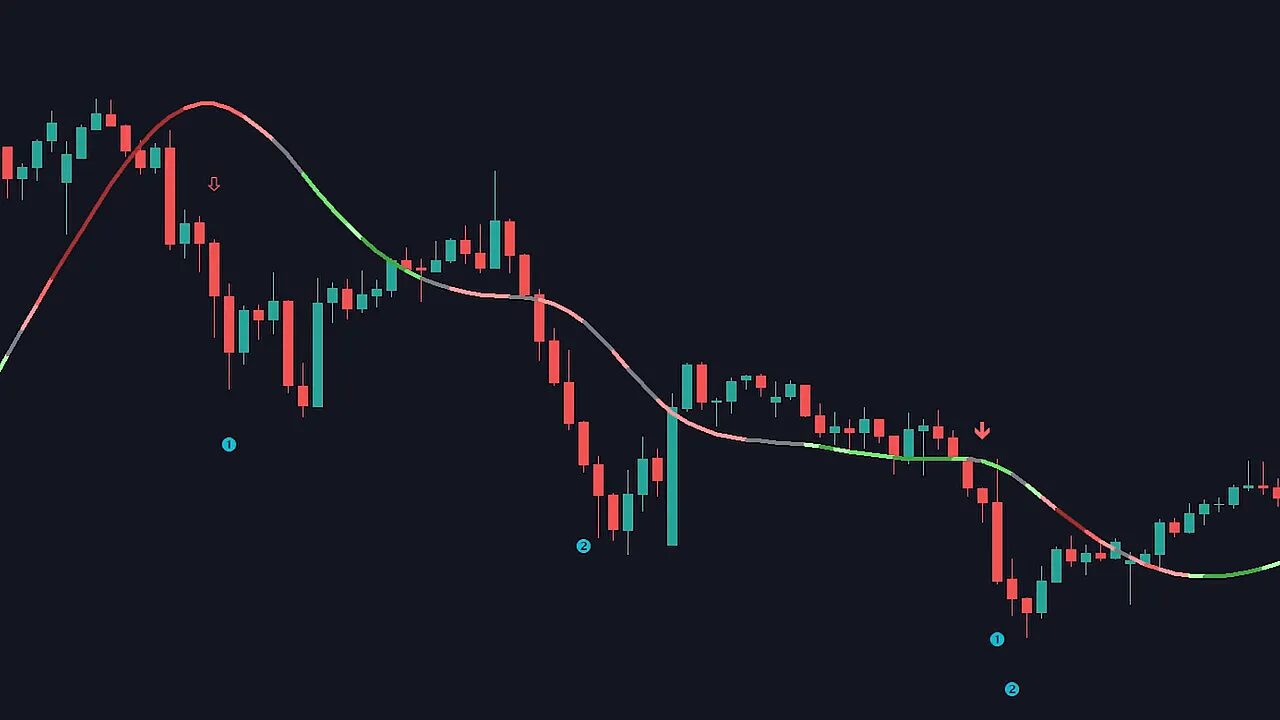
The baseline: visualizing predictions in real time
Raw predictions were a messy cloud of dots, so I translated the engine’s output into a simple baseline that anyone can read in seconds. The baseline uses three primary colors:
- Green for bullish
- Gray for consolidating
- Red for bearish
Shades matter. A darker green or red means the machine learning model is more confident about that direction. You can also see a live metric in the trend table called the machine learning metric, which updates in real time and matches the baseline color to give an extra numeric confirmation.
How to use the tool in your trading
This is not a magic button you press for instant profits. It works best as confirmation layered on top of solid trade setups. Here are practical ways I use it.
Use it with order blocks (my favorite confluence)
I like the one hour timeframe when trading order blocks. The setup is simple: wait for price to reach an order block and show signs of respect — price should slow at the block and not close the candle body through it. If the baseline turns from gray to green while the order block is being respected, that gives a strong additional reason to enter a long.
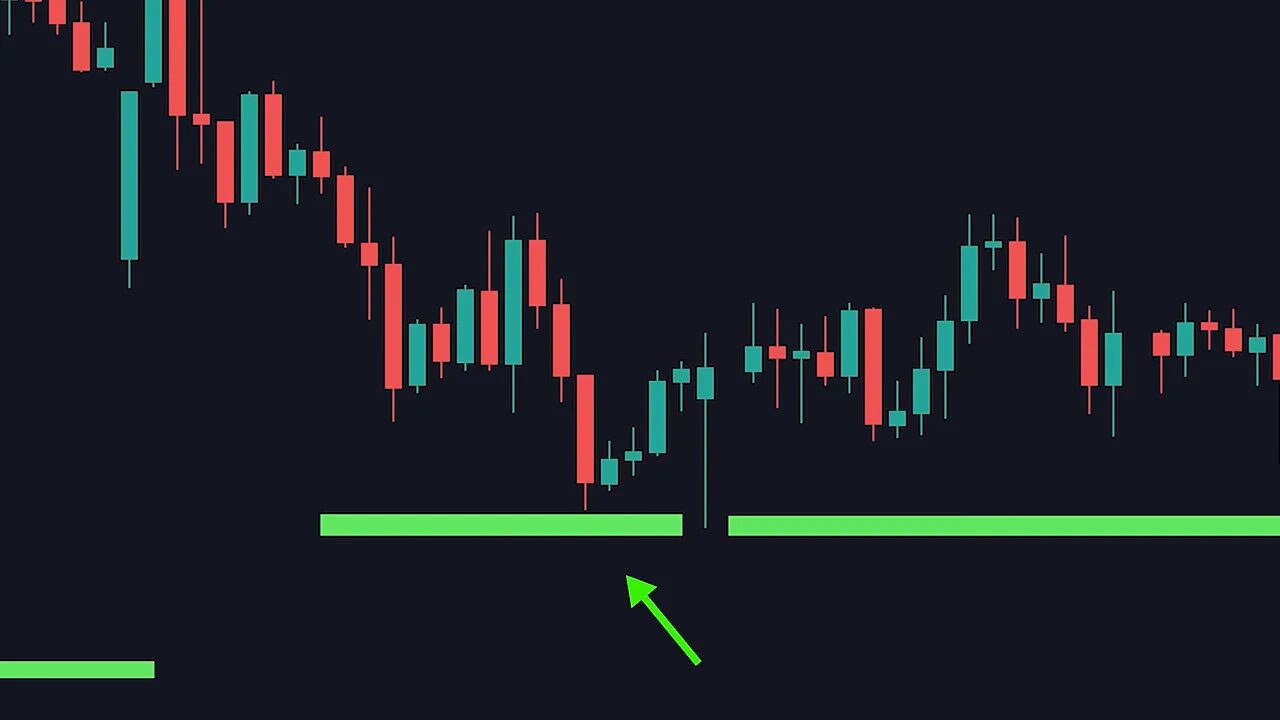
Conversely, if price respects an order block but the baseline is pure red, I skip the trade. The baseline has avoided setups that later collapsed, and confirmed setups that spiked higher.

Higher timeframe confirmation
Check the machine learning baseline on the 4 hour or daily first. If the higher timeframe baseline turns gray to green, bias your lower timeframe work toward longs only. Change the market consensus setting to bullish if you want the tool to favor long signals while you trade the 5 or 15 minute charts. This reduces noise and aligns smaller-timeframe entries with the broader probability lean.
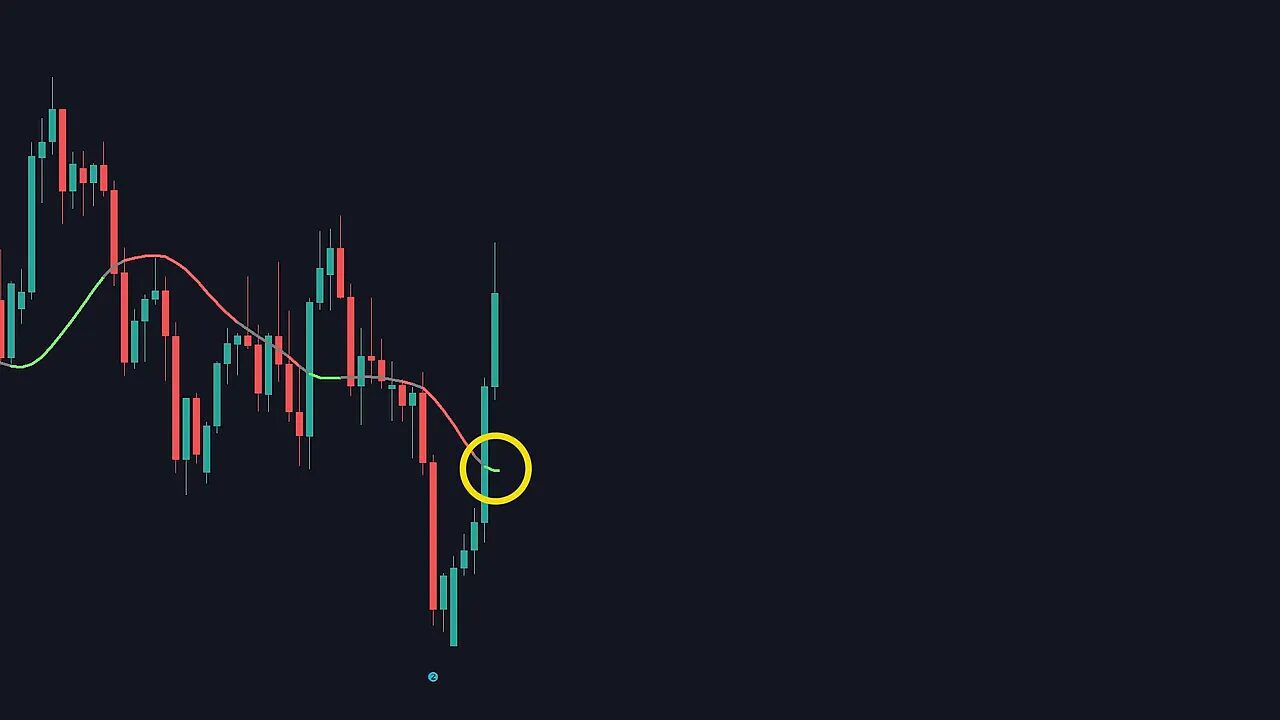
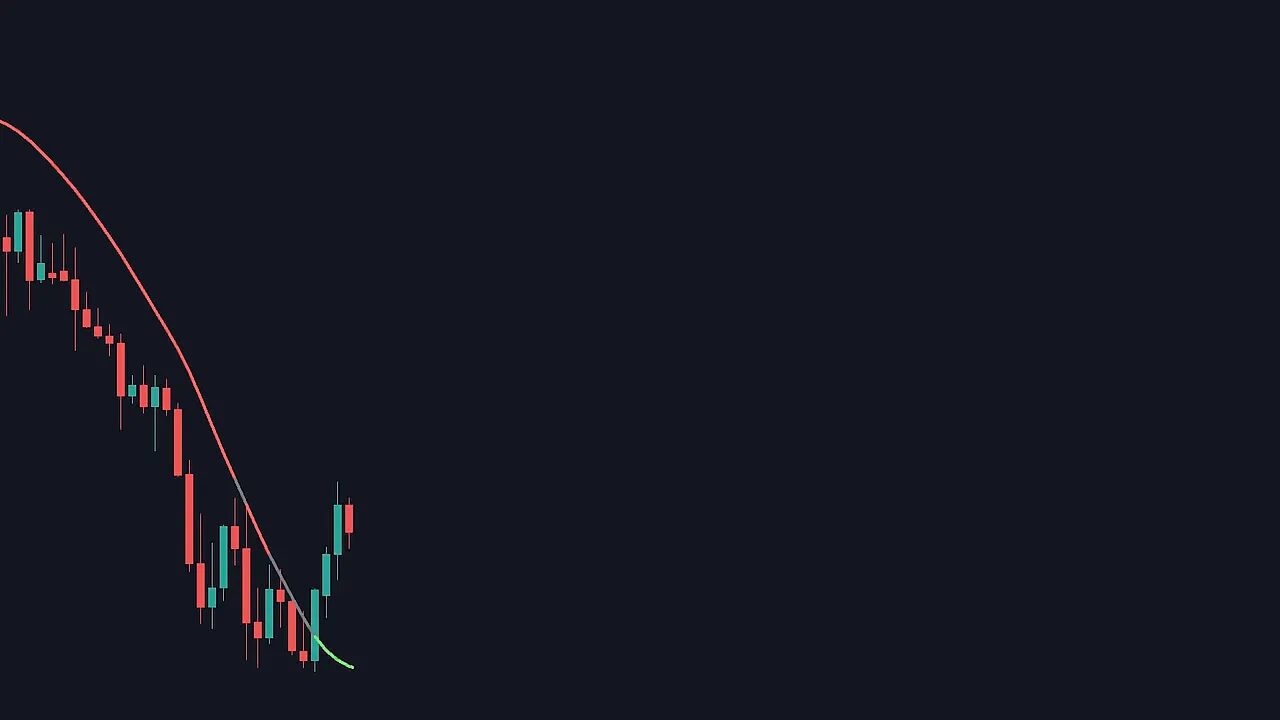
Use it for managing exits and taking profits
The baseline is excellent for spotting loss of momentum. If you are in a short trade and the baseline shifts from red to gray and then to green lower down, that is a strong cue to tighten stops and book profits. The same applies in reverse for longs. Let the baseline changes serve as a probability-based trailing indicator.
Best practices and tips
- Do not rely solely on it to enter or exit. Use it as confirmation alongside price action, order blocks, support and resistance.
- Favor higher timeframe confirmations to set the bias, then execute on the lower timeframe that fits your plan.
- Watch shade intensity. Darker colors mean higher confidence — use that to scale position size or to prioritize setups.
- Let it learn. The model improves the more it runs on an asset’s history, so expect its edge to grow with time and usage.
Community and continuous improvement
I built this to be more than an indicator. Members are already sharing strategies and results in the Discord channel, and that collective testing helps refine how the tool is used. When traders share what works, the community gets better signals and everyone benefits.
If you want a place to test ideas, share screenshots, and compare setups, look for communities centered around collaborative testing and strategy refinement.
Frequently asked questions
Which indicators does the machine learning model use?
It tracks values from a set of popular technical indicators such as RSI, CCI, ADX and additional signals. Those indicator values across chart history form the input space the model searches to find past situations similar to the present.
Can I trade solely based on the baseline?
No. The baseline is most effective as confirmation. Pair it with order blocks, higher timeframe bias, price action, or other confluences. Using it alone increases risk because no model predicts price perfectly.
How does the model get smarter over time?
The engine constantly ingests additional historical and live chart data. As more matching instances are found and compared, the averaged outcomes become more robust, which increases predictive accuracy for similar future patterns.
What timeframes work best?
Use higher timeframes such as 4 hour or daily for bias and confirmation, then execute on lower timeframes like 5, 15, or 60 minutes. The model works on any timeframe, but combining timeframes improves decision quality.
Can the baseline help with exits?
Yes. Changes from red to gray to green (or the reverse) are useful cues that momentum is fading or shifting. Those color transitions make helpful signals for tightening stops or taking profits.
Where can I try the indicator?
The indicator is available at tradinglab.ai. Use it alongside your existing workflow, and test the ideas above on a demo account until you are comfortable with how the baseline behaves on your instruments and timeframes.
Closing thoughts
Machine learning is not a crystal ball, but when applied thoughtfully it can add a meaningful edge. The baseline turns complex pattern-matching into something you can read in seconds and use to stack confluences. Over time the model improves as it learns from the market, and that improvement compounds in your favor if you treat it as a probability tool rather than a certainty.
Trading is a team sport. Use the baseline to refine your edge, share what works, and keep iterating. The real power comes from combining human judgment with machine speed.
