

Table of Contents
- Why reversals are the place to be
- The two-step reversal system (simple and repeatable)
- Entry, stop loss, and take profit — exactly where to place them
- Save time: automating the search with an indicator
- Ways to improve your edge
- Risk management and realistic expectations
- Quick trade checklist
- FAQ
Why reversals are the place to be
Hunting reversals is one of the highest edge ways to trade. You are aiming for the exact point where price changes direction, which gives you exceptional risk-to-reward ratios. Win or lose, the losing trades are tiny pebbles compared to the massive wins you catch when a reversal goes your way.
The two-step reversal system (simple and repeatable)
The setup has just two core steps:
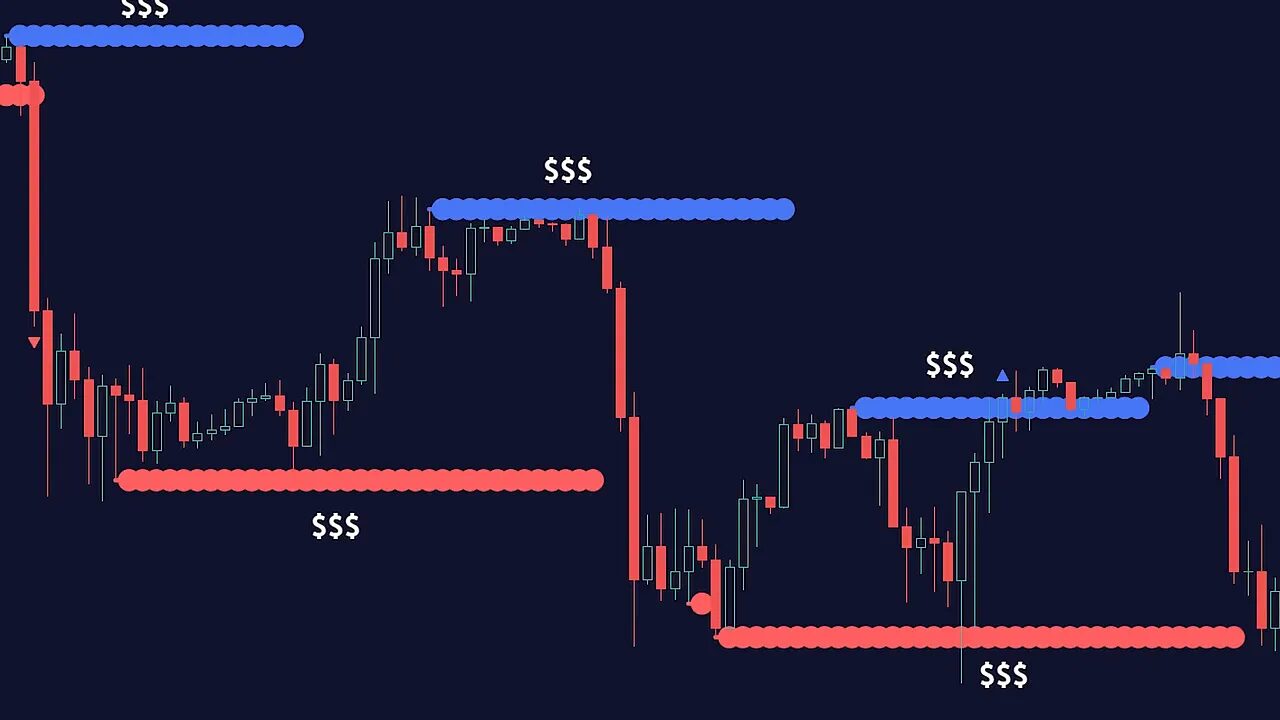
- Step 1: Find a liquidity grab. This is when price breaks a support or resistance level with a fakeout and then reverses. That break sucks in breakout traders who place stops near the breakout. When price flips, those stops get run and add fuel to the reversal.
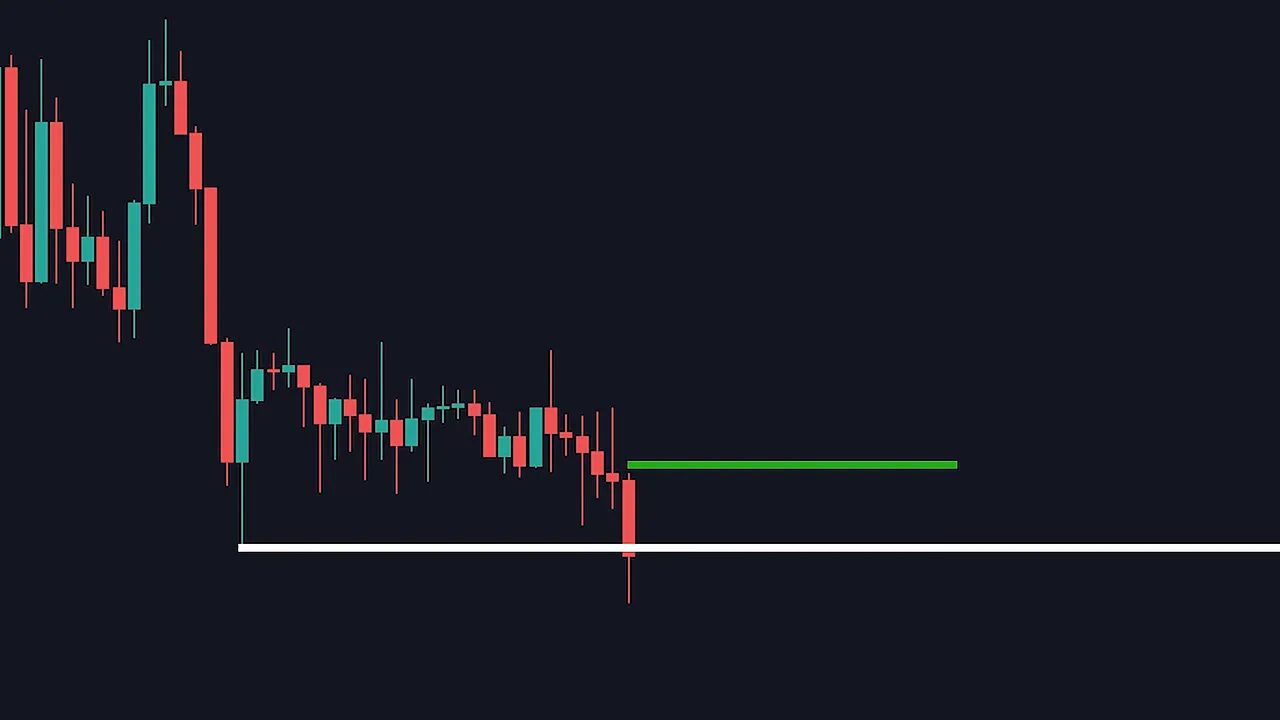
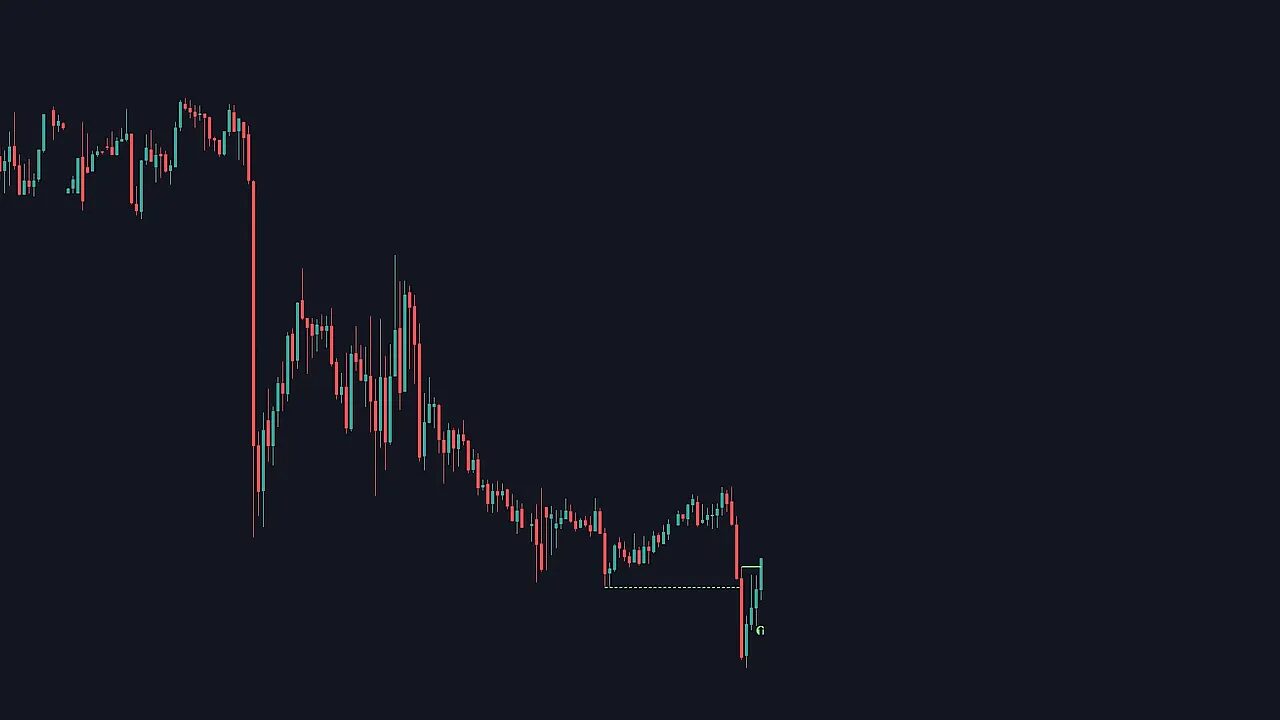
- Step 2: Enter at the candle that made the liquidity grab. Mark your entry at the candle that pierced the level. Your stop sits just beyond that candle and your take profit targets a recent swing high or low for a big reward relative to your risk.
Why liquidity grabs work
Picture a resistance that gets barely broken. Retail traders buy the breakout and stash stops just above that area. When price fails and reverses, those stops cascade and amplify the move back the other way. If you enter on the reversal, you ride that impulsive move with excellent risk control.
Backtested data supports this idea. In a large study of 14,000 trades, patterns that showed liquidity-grab structure outperformed the opposite pattern. In short: liquidity grabs are high-probability reversal fuel.
Entry, stop loss, and take profit — exactly where to place them
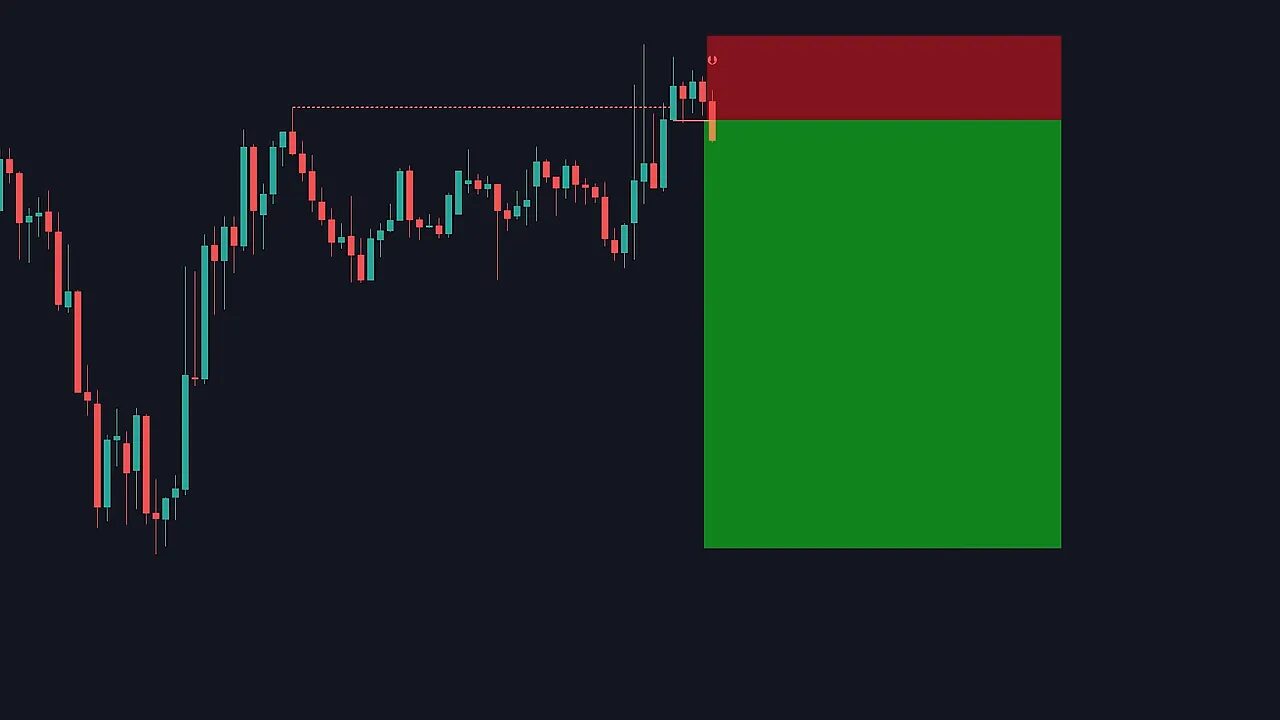
Entry is straightforward: enter at the candle that initiated the liquidity grab. For a long, enter at the base of the bullish fakeout candle that pierced support. For a short, enter at the top of the bearish candle that pierced resistance.
Set your stop loss just beyond the extreme of that liquidity-grab candle. Set your take profit at a recent swing high or swing low. Because you are entering near the exact top or bottom, your risk is small and your potential reward is large.
Even when trades lose, losses are compact. The winners tend to be massive impulsive moves, so a few small losses won’t dent your equity curve if position sizing is disciplined.
Save time: automating the search with an indicator
If you prefer not to hunt liquidity grabs all day, an indicator can flag candidates for you: marking the liquidity grab, the entry candle, and the exact entry signal. This speeds decision making and keeps your watchlist tight.
For crypto traders specifically, combining automated scans with a trusted provider of the best crypto trading signals can be especially useful. Crypto markets move fast across multiple blockchains; signals can highlight clean liquidity zones and high-probability reversals so you focus only on the setups that match the two-step system.
Ways to improve your edge
Layering simple confluences raises the probability of the setup. These are the most powerful add-ons I use:
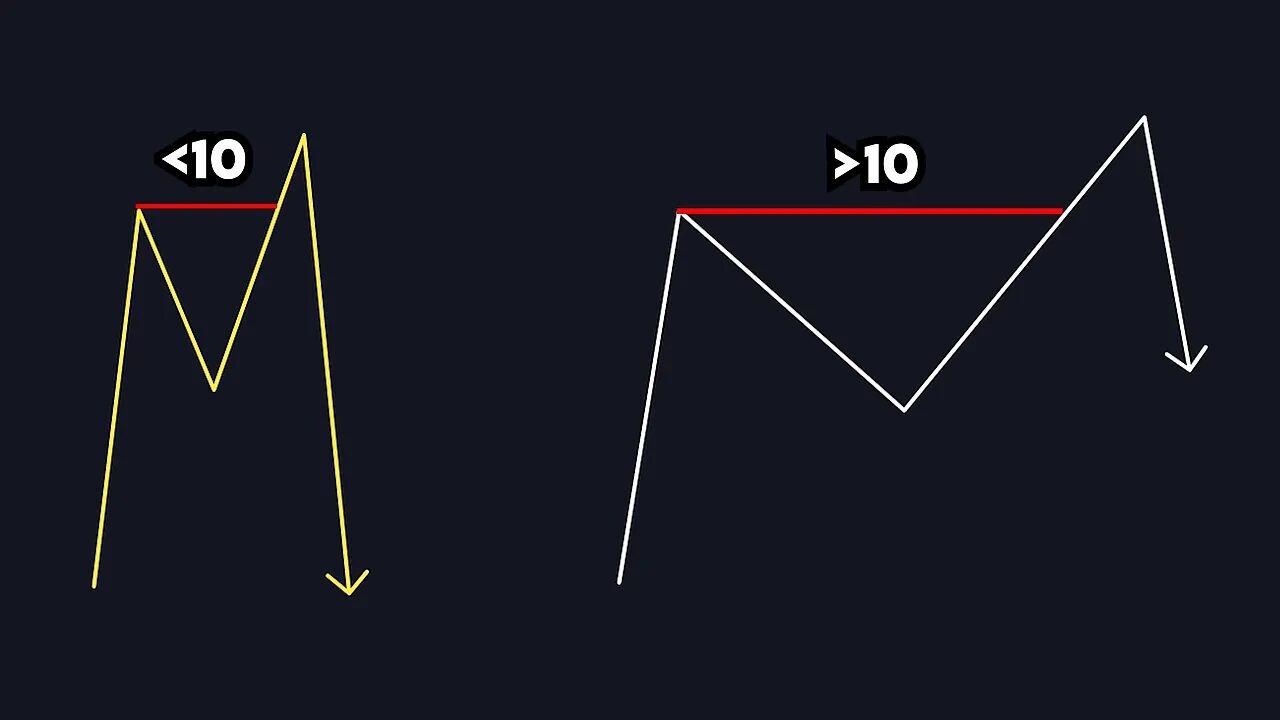
- 10-candle proximity rule — On the daily timeframe, liquidity grabs where the two nearest peaks are within 10 candles tend to produce sharper, more impulsive drops. In other words, peaks closer together often mean stronger reversals.
- Divergence with a momentum oscillator — Add a momentum oscillator and look for divergence: price making lower lows while momentum makes higher lows is bullish, and vice versa. Combining divergence with a liquidity grab gives higher probability trades. (In MetaTrader this is under Insert → Indicators → Oscillators → Momentum.)
- Higher timeframe confirmation — Use a higher timeframe to confirm you are at the top or bottom of a larger range. A liquidity grab that aligns with higher timeframe support or resistance is a far better trade than one that happens in the middle of a bigger move.
 10 examples”/>
Putting these together — liquidity grab structure, the 10-candle proximity check, divergence, and higher timeframe S/R — creates a compact checklist you can run through in seconds before taking a trade.
Risk management and realistic expectations
Risk management makes this strategy work. Use small position sizing so your stop loss is a small percentage of your account. When your stop losses are small and winners are allowed to run to recent swings, your risk-to-reward profile becomes very favorable.
Expect that not every signal will win. The point is: losses are small, winners are big, and the win-rate plus position sizing should produce a profitable edge over many trades.
Quick trade checklist
- Identify a clear support or resistance on the higher timeframe.
- Scan lower timeframes for a liquidity grab that pierces that level.
- Confirm entry at the candle that created the fakeout.
- Place stop loss just beyond the liquidity-grab candle extreme.
- Set take profit at the recent swing high or low on the same timeframe or slightly higher.
- Look for confluences: divergence, 10-candle proximity, and higher timeframe S/R.
FAQ
What exactly is a liquidity grab?
A liquidity grab is a fakeout where price briefly breaks a support or resistance, traps traders, and then reverses. It concentrates stops and creates an impulsive move in the opposite direction, which you can trade.
How should I set stop loss and take profit?
Place stop loss just beyond the extreme of the liquidity-grab candle. Set take profit at a recent swing high for longs or swing low for shorts. This gives a small loss if wrong and large reward if right.
Which timeframes and instruments work with this strategy?
This method works across instruments: stocks, Forex, and crypto. It also works on multiple timeframes. Use higher timeframe context to find tops and bottoms, then execute on a lower timeframe for precise entries.
Can I rely on the indicator or do I need to learn to spot liquidity grabs manually?
An indicator speeds up the process and reduces screen time, but learning to spot liquidity grabs manually builds skill and judgement. Use an indicator for screening and your eyeballs for final confirmation.
Do these setups work in crypto markets?
Yes. Crypto often produces excellent liquidity grabs due to high retail participation and volatile stop runs. Using the best crypto trading signals alongside this strategy can help you find high-quality reversal opportunities across different blockchains faster.
Is this strategy suitable for beginners?
Beginners can use it but should focus on risk management: small position sizes, practice on a demo account, and add confluences like higher timeframe S/R and divergence before trading live.
