

Short version: the relationship between gold and Bitcoin is not a simple back-and-forth trade. Sometimes they move in opposite directions, sometimes together. The driver is almost never a literal rotation from one asset to the other. It’s about risk appetite, who’s buying gold (central banks vs speculators), and the global liquidity cycle. Understanding those forces—and the signals that reveal them—lets you make sense of what might happen to both markets in 2026.
Table of Contents
- How people think about gold and Bitcoin (and why that’s misleading)
- Risk‑off vs risk‑on: real historic examples
- Whenever they move together, look at who’s buying gold
- Why central banks and structural shifts mattered recently
- But the summer surge in gold? That looked different
- Yield on gold: a red flag for leverage and speculation
- Liquidity is the underlying driver
- The debt refinancing wall: why liquidity may fall in 2026
- DXY: the practical gauge of liquidity stress
- So will a gold crash be bullish for Bitcoin?
- Why Bitcoin didn’t rally with gold in late 2025
- Unexpected injections change the expected path
- But beware the debt wall: the bigger drawdown likely follows
- What to watch now: a practical checklist
- Possible scenarios for 2026
- Positioning ideas and risk controls
- Why the “digital gold” tagline still matters—but only sometimes
- Final synthesis
- FAQ
- Closing thoughts
How people think about gold and Bitcoin (and why that’s misleading)
At first glance, Bitcoin and gold share obvious similarities: capped supply, self-custody, and no single controlling authority. That’s why some call Bitcoin “digital gold.” But theory and practice diverge. For many investors Bitcoin behaves like a high‑beta risk asset—a tech growth play in crypto clothing—while gold remains the canonical safe haven.
Put another way, Bitcoin often sits on the risk‑seeking end of the spectrum; gold sits on the risk‑averse end. That simple risk framing explains much of the apparent “rotation” between them: when investors get scared and move to safe assets, gold rises and risk assets—including Bitcoin—tend to fall. When confidence returns, gold weakens and risk assets rally. The appearance of a lag between gold and Bitcoin is often just the market’s tempo: liquidity and sentiment change first, and Bitcoin follows with its own timing.
Risk‑off vs risk‑on: real historic examples
Examples are helpful.
- Spring 2020: the pandemic shock pushed markets into a classic risk‑off environment. Gold rallied while Bitcoin crashed as investors scrambled for liquidity.
- Summer–autumn 2020: unprecedented stimulus created a risk‑on environment. Gold cooled off and crypto entered a massive rally that culminated in 2021’s altcoin cycle peaks.
- Autumn 2024 into 2025: gold’s moves signaled shifting sentiment across asset classes. At times altcoins hit multi‑year highs while gold weakened, and at other points gold’s rally coincided with crypto weakness.
These episodes show the core point: gold’s direction tends to reflect investors’ appetite for safety. Bitcoin’s direction often reflects appetite for risk. Correlation between them is therefore dynamic and conditional, not fixed.
Whenever they move together, look at who’s buying gold
There are periods when gold and Bitcoin rally together, and periods when they crash together. That sounds contradictory until you look at the buyer profile driving gold’s gains.
Two distinct demand regimes for gold produce entirely different coin‑cousin behavior:
- Risk‑off fundamentals—central bank accumulation and cautious global investors buying gold as a reserve or store of wealth. In this regime, gold is a safe harbor and tends to rise when risk assets fall.
- Speculative, risk‑on flows—retail and leveraged capital piling into gold, miners, and silver as high‑beta plays. In this regime, gold’s rise is driven by momentum and leverage, which means it can rally alongside other risk assets.
The difference matters. When central banks are the dominant marginal buyer, gold’s price movements act as a safety signal. When speculative flows dominate, gold acts like a commodity momentum trade and correlations with equities and crypto can flip positive.
Why central banks and structural shifts mattered recently
Since 2022, several structural factors pushed real demand for gold higher:
- Some central banks increased gold reserves after the freezing of certain foreign reserves following geopolitical events. That change stressed the idea that large sovereign reserves need assets outside the traditional Western banking framework.
- In China, the housing market cooled dramatically. For many Chinese investors the home had been the primary store of wealth; when that ceased to be reliable, precious metals reemerged as an alternative.
- In the West, concerns about concentrated stock market valuations and sovereign debt dynamics made both private and institutional investors cautious about bonds and equities, again increasing allocations into gold.
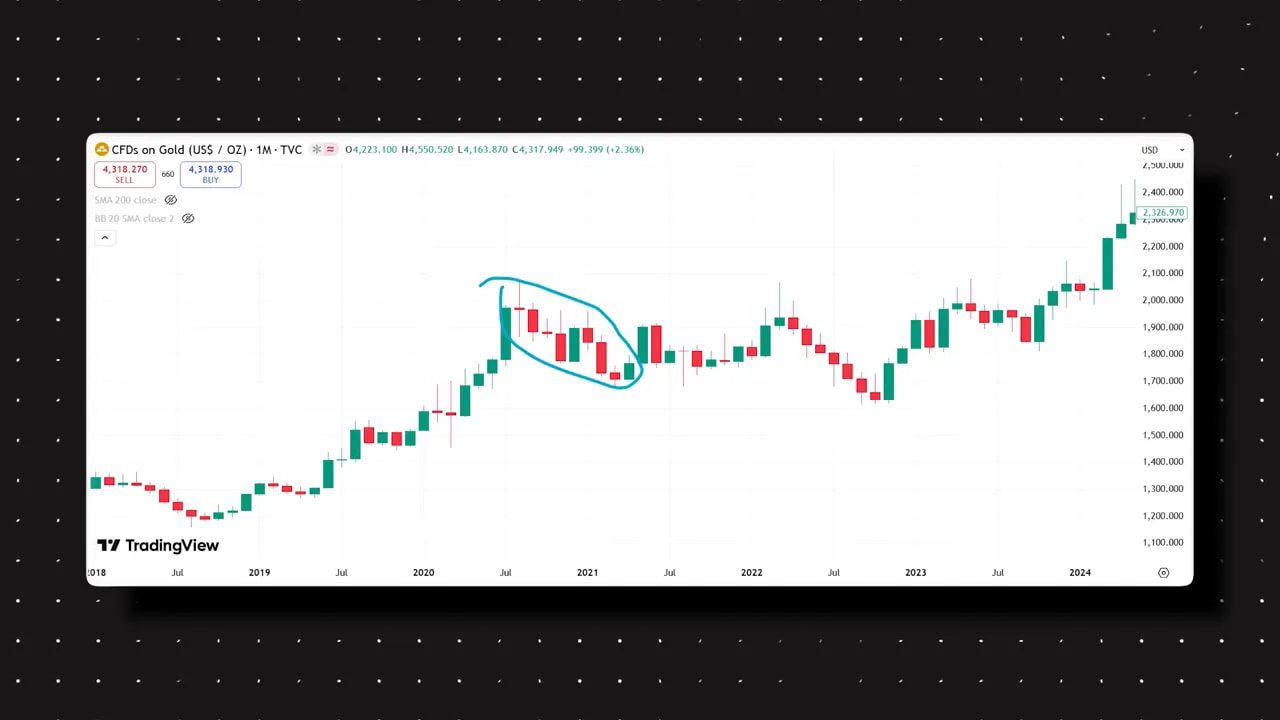
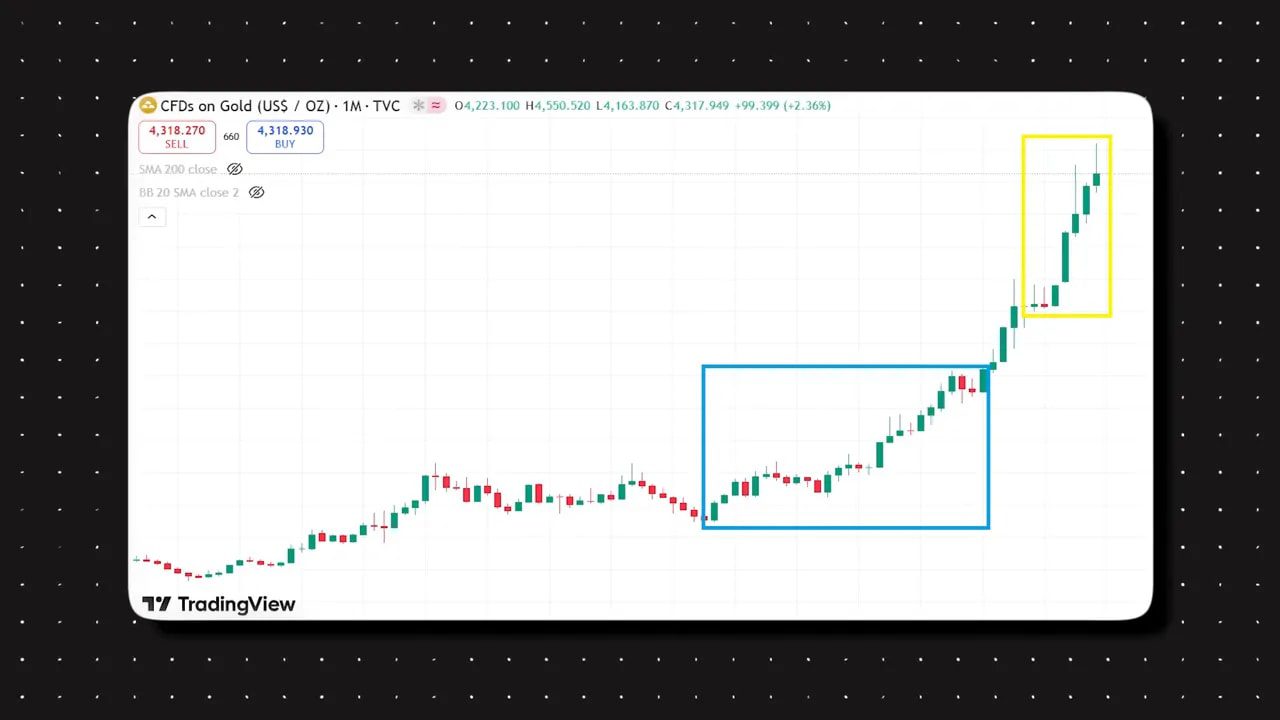
These structural, reserve‑level shifts explain much of gold’s move from around $2,200 per ounce in early 2024 to roughly $3,400 by mid‑2025. That rally looks driven by accumulation rather than pure speculation.
But the summer surge in gold? That looked different
From $3,400 up toward $4,600 in mid‑2025, gold’s rally showed hallmarks of speculative momentum:
- Search trends for “gold” and “gold price” went vertical—typical of retail interest and momentum chasing.
- Higher‑beta plays—gold miners and silver—started to run parabolically alongside bullion.
- New products promising yield on gold became widely promoted, suggesting both demand for leveraged exposure and the growth of margin/wrap products.
When speculative flows dominate gold’s price action, correlation with crypto can turn positive. That’s because the marginal buyer is not the cautious central bank or the flight‑to‑safety investor. It’s levered, risk‑seeking capital that chases returns across asset classes—commodities, miners, and crypto included.
Yield on gold: a red flag for leverage and speculation
One of the clearest signs that speculation is growing is when yield‑paying products appear for an asset that traditionally doesn’t yield anything. Gold yield products and services began cropping up more widely, and even prominent commentators promoted them. That’s an indicator of two things:
- Speculative demand—people and institutions willing to pay for enhanced returns on gold exposure.
- Rising leverage—the mechanics of providing yield usually implies borrowing, lending, or structured notes that introduce margin and potential forced selling during stress.

When leverage is high, a correction in gold can produce cascading liquidations that amplify any initial fall. If gold’s recent rally was supported by leverage, a sharp pullback would not necessarily produce a rotation out of gold into Bitcoin. Instead, it could mean a generalized liquidity squeeze that hits risk assets across the board.
Liquidity is the underlying driver
At the heart of this entire dynamic is global liquidity. Liquidity here is shorthand for the amount of money available in financial markets—central bank balance sheets, bank lending, flows into ETFs, and so on. At a macro level, liquidity rises and falls in multi‑year cycles, and those cycles influence asset allocations.
Michael Howell and several other liquidity analysts highlight a pattern: commodities tend to peak around the liquidity top. That is, when liquidity stops expanding and reaches a maximum, commodity prices—sensitive to industrial demand and speculative flows—often hit cycle highs. Precious metals are included in that bundle.
Why does this matter? Because the most bullish phase for risk assets occurs when liquidity is still expanding. A peak is not the same as expansion. Peak liquidity often coincides with the top of speculative bubbles in commodities, and what follows is a liquidity drawdown that pressures all risky assets.
The debt refinancing wall: why liquidity may fall in 2026
Howell ties the global liquidity cycle to a simple mechanical force: debt refinancing. Large borrowers—governments, corporates, financial institutions—need to roll over debt every few years. Rolling debt requires cash. When a concentrated refinancing wall arrives, many actors must convert assets into cash to meet obligations. That process drains liquidity from markets.

2026 has been flagged as a major refinancing year. If enough large players need to produce cash at roughly the same time, the aggregate effect is a drawdown in liquidity. Prices go down because cash becomes preferred; the dollar strengthens; risk assets suffer.
DXY: the practical gauge of liquidity stress
The US Dollar Index, DXY, is a practical, easy‑to‑watch indicator of global demand for US dollar cash. When DXY rises, the world is asking for dollars; when it falls, demand for dollars eases.
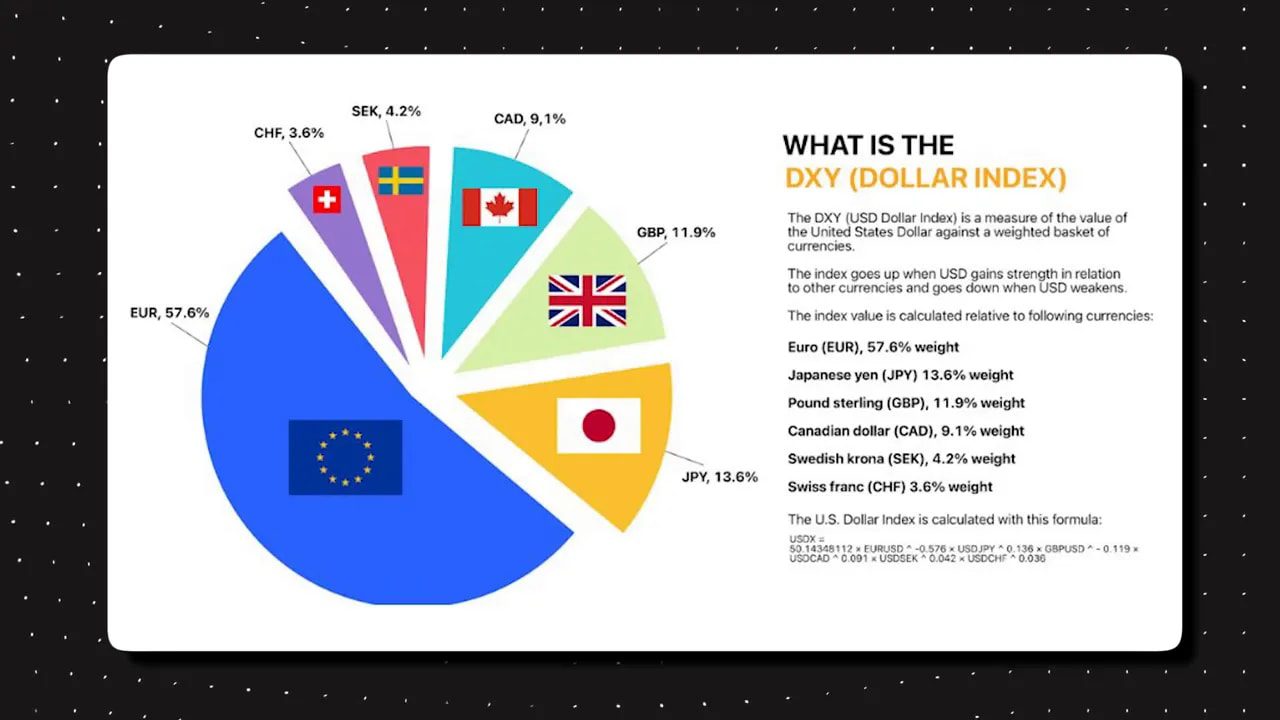
There’s a reliable inverse correlation between DXY and gold: rising DXY tends to pressure gold prices. If a debt refinancing wall in 2026 triggers a scramble for dollars, the DXY should push higher—and gold (especially speculative gold) should fall. That fall can be amplified by forced selling from leveraged speculators.
So will a gold crash be bullish for Bitcoin?
Not necessarily. That’s the counterintuitive but important point.
If gold collapses because risk‑on speculators are forced out by a liquidity squeeze, BTC is unlikely to benefit. Instead, crypto could fall alongside gold because the underlying driver is liquidity and risk aversion, not an active rotation from gold into Bitcoin.
History supports this: during late 2018 and late 2022, crypto bottoms coincided with broad market distress rather than a clean rotation into risk assets. Gold’s role in those episodes was complex—sometimes down, sometimes up—but the primary force was liquidity.
Why Bitcoin didn’t rally with gold in late 2025
Many expected Bitcoin to rally following gold’s late‑2025 spike under the idea that Bitcoin lags gold by roughly three months. But BTC remained rangebound while global liquidity continued to climb into autumn 2025. The mismatch deserves explanation.
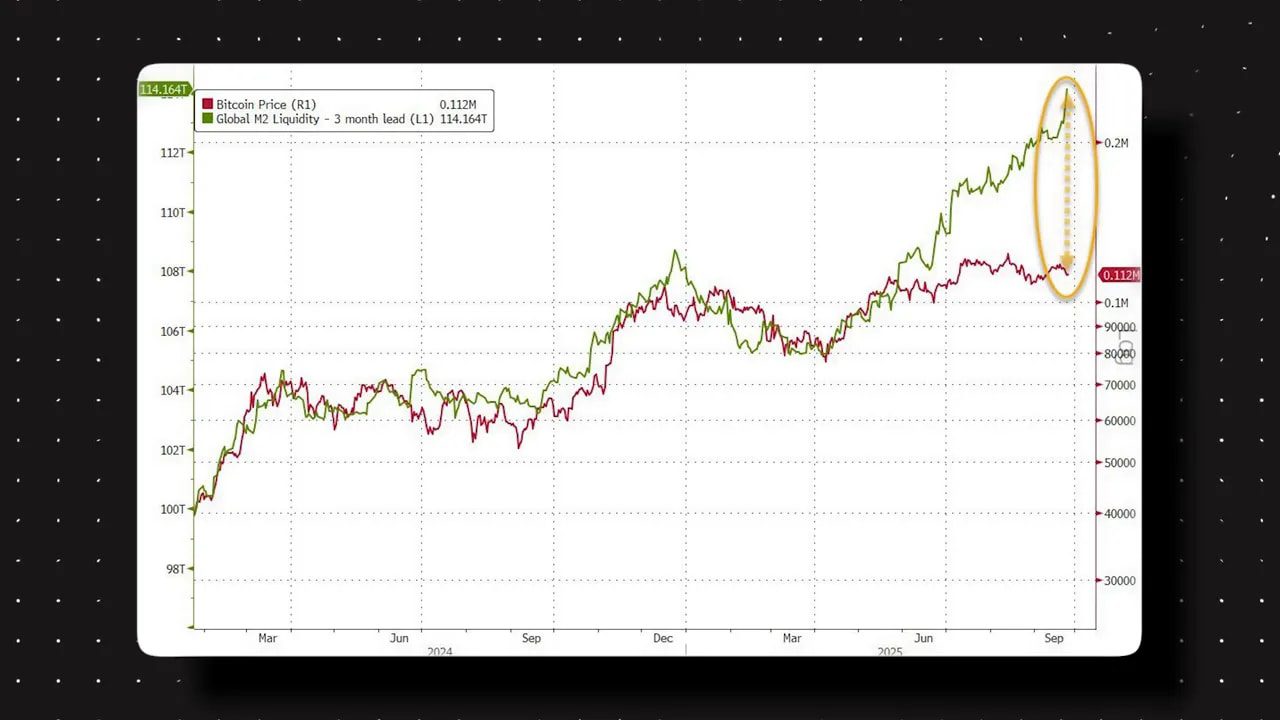
Key points:
- Crypto is highly correlated to global liquidity and tends to lag liquidity by about three months. When liquidity goes up, crypto typically follows with a lag.
- Global liquidity continued to rise into autumn 2025, yet crypto chopped sideways—an anomaly that suggests something specific to crypto broke in spring 2025.
- One plausible break was market microstructure damage from a large policy shock and the market’s response to that shock. When events produce a sudden loss of available leverage in a market, the subsequent price behaviour can be muted even while liquidity elsewhere rises.
Some pointed to the Treasury General Account (TGA) refill as the culprit for crypto underperformance. But timing doesn’t match: the crypto‑liquidity disconnect predated the TGA refill. The deeper issue was likely a structural weakening of crypto’s liquidity reservoir in spring 2025, meaning later liquidations (for example, in October) were more brutal because the market started from a shallow liquidity base.
Unexpected injections change the expected path
Models that forecast liquidity peaks and drawdowns are powerful, but they miss one thing: unexpected policy injections. Central banks and fiscal authorities can—and sometimes will—add last‑minute liquidity to prevent systemic stress.
Two such 2025–2026 developments matter:
- The Federal Reserve began purchasing US Treasuries around December 2025, a move framed as operational but which de facto increases liquidity.
- The Treasury General Account experienced a drawdown since November, which also supports liquidity in markets.
Because crypto tends to lag liquidity by roughly three months, these injections can generate a modest rally in Q1 2026 even if a larger liquidity contraction is expected later in the year. Add in potential regulatory or legislative catalysts—such as approvals that increase institutional clarity—and a short‑term rotation into crypto is plausible.
But beware the debt wall: the bigger drawdown likely follows
After a small liquidity‑driven uptick, the larger structural story—debt rollovers in 2026—could reassert itself. As refinancing needs peak, liquidity pressure will grow, the DXY could strengthen, and risky assets could see another leg down. That leg would be driven by the mechanics of refinancing and forced asset sales, not by a tidy rotation from gold into Bitcoin.

A few practical consequences:
- Expect greater correlation across risk assets during the drawdown. If gold corrects because speculators sell, BTC may fall by similar dynamics, not because of direct capital flow from gold to crypto.
- Gold will likely hold up better in percentage terms than most risk assets during a liquidity squeeze because it’s still viewed as a safe haven by many institutions. The relative outperformance doesn’t mean a flight into Bitcoin.
- Emergency liquidity injections (QE) historically arrive after severe market stress; they tend to mark bottoms rather than prevent the drawdown. When QE arrives, asset prices often recover with a lag—crypto historically recovering around three months later.
What to watch now: a practical checklist
Focus on indicators that reveal the drivers discussed above. These are the most actionable things to track:
- DXY: a rising DXY is the clearest early warning of rising demand for dollars and liquidity stress.
- Search trends and retail interest for gold, silver, and miners: spikes suggest speculative retail momentum and rising leverage.
- Gold miners and silver performance: these higher‑beta instruments often move before bullion does and can signal the nature of flows (fundamental vs speculative).
- Yield products offering returns on gold: the appearance and popularity of these products suggest rising leverage in the gold market.
- Fed and central bank balance sheet actions: purchases of bonds or other operations that expand liquidity can change the near‑term path for risk assets.
- Treasury General Account (TGA) activity: refills or drawdowns materially affect short‑term liquidity.
- Debt maturity calendar: known large refinancing years like 2026 matter. Plot the timeline for major sovereign and corporate rollovers.
Possible scenarios for 2026
Nothing is certain, but mapping plausible paths helps with planning. Here are three simplified scenarios based on liquidity and policy response.
Base scenario: short rally, then drawdown, then policy support
Fed and TGA dynamics create a liquidity pulse that produces a modest crypto rally in Q1 2026. Legislative clarity events add extra interest. As the debt wall tightens through mid‑2026, DXY rises, forcing a liquidity drawdown that pressures most risk assets. Markets deteriorate until policymakers enact larger stimulus, which then seeds a recovery roughly three months later. Gold bottoms around the same time as crypto, and the cycle begins anew.
Bull scenario: injections offset the debt wall
Policy response arrives early and is sufficiently large to offset refinancing needs. Liquidity never contracts materially. Risk assets—including Bitcoin—continue their advance and commodities peak later than expected. This requires central banks and fiscal authorities to be proactive and substantial in their support.
Bear scenario: severe drawdown before policy help
Refinancing stress accelerates quickly. DXY surges, speculative positions in commodities and miners unwind violently, and liquidity evaporates. Bitcoin and other risk assets suffer large drawdowns. Policymakers eventually intervene, but only after sizable market damage. Recovery begins after the intervention, and the deepest part of the drawdown coincides with the peak of market stress.
Positioning ideas and risk controls
How one positions depends on risk tolerance and horizon, but some sensible rules apply during uncertain liquidity regimes:
- De‑leverage where possible—margin and yield products increase vulnerability to forced liquidations.
- Keep a cash buffer to take advantage of dislocations or to meet margin calls without forced selling.
- Use DXY as a trigger—rising dollar strength is a high‑probability signal of tightening liquidity; adjust exposure accordingly.
- Watch speculative signals (search interest, parabolic moves in miners and silver). If these appear in abundance, the risk of a violent unwind rises.
- Consider hedging or staggered entries—size positions so that you have flexibility if liquidity cycles move against you.
Why the “digital gold” tagline still matters—but only sometimes
Calling Bitcoin digital gold captures a set of shared attributes, and it has long‑term conceptual appeal as a scarce, censorship‑resistant store of value. In the shorter term, however, markets price Bitcoin like any other risk asset. That dual nature is why labels matter less than regime analysis.
If Bitcoin becomes the dominant destination for flight‑to‑safety capital at some future point, we’d expect it to decouple from other risk assets and behave more like classic safe havens. Until that time, its short‑to‑medium term moves will be governed by liquidity, leverage, and shifting investor risk appetite.
Final synthesis
The gold‑Bitcoin relationship is not a simple seesaw where money leaves one and enters the other. It’s a mirror of broader risk and liquidity dynamics. When gold is rising because central banks and cautious investors are buying, crypto usually falls. When gold is rising because speculators and leveraged money are piling in, crypto can rise alongside it.
Global liquidity cycles, driven in part by debt refinancing schedules, are the master clock. Watch those cycles, follow the DXY, monitor speculative signs in precious metals, and respect the three‑month lag between liquidity moves and crypto price action. Unexpected policy injections can change the near‑term path, but the structural debt wall of 2026 argues for preparedness rather than complacency.
FAQ
Does a rising gold price mean Bitcoin will rise three months later?
No. A rising gold price does not automatically mean Bitcoin will rally three months later. The historical three‑month lag between gold and Bitcoin is conditional: it holds when gold’s moves reflect broad liquidity and risk shifts that typically lead to lagged moves in crypto. If gold is rising due to risk‑off accumulation by central banks, Bitcoin will more likely fall. If gold is rising due to speculative, leveraged flows, Bitcoin may rise with it. Always check the underlying driver.
Why have gold and Bitcoin sometimes rallied together?
They rally together when speculative, risk‑on capital drives up both precious metals and crypto. In those periods the marginal buyer is risk‑seeking and levered, so momentum in one market spreads to others. That’s why parabolic runs in miners and silver alongside bullion often coincide with stronger correlations to crypto.
What is the global liquidity cycle and why does it matter?
Global liquidity describes the availability of cash and funding across markets—central bank actions, credit conditions, and balance sheet flows. It tends to move in multi‑year cycles influenced by credit, fiscal timing, and debt maturities. When liquidity expands, risk assets typically rally; when liquidity peaks and then contracts, assets can sell off sharply. Tracking the cycle helps anticipate regime shifts in correlation and price behavior.
How can I use the DXY indicator effectively?
Use DXY as a real‑time proxy for the world’s demand for dollar liquidity. A sustained rise in DXY often precedes or accompanies liquidity tightening and risk asset weakness. A sustained fall suggests easing demand for dollars and a more supportive environment for risky assets. Combine DXY moves with other indicators—credit spreads, central bank actions, and search/flow signals—for higher confidence.
Will a crash in gold be bullish for Bitcoin?
Not necessarily. If gold crashes because leveraged speculators are forced out while global liquidity is contracting, Bitcoin may fall too. Only if gold’s decline reflects rotation from speculative precious metal positions into crypto (and liquidity remains ample) would a gold crash be potentially bullish for Bitcoin. The more likely scenario during a liquidity drawdown is broad risk aversion, which pressures both.
What short‑term scenarios are most plausible for Bitcoin in early 2026?
The most plausible near‑term path is a modest rally in Q1 2026 driven by recent liquidity injections (central bank purchases and TGA drawdowns) and any positive regulatory news. That rally could be followed by a larger correction as the 2026 refinancing wall exerts downward pressure, unless policymakers intervene early and substantially.
Is any of this investment advice?
No. This guidance is educational and should not be interpreted as financial, legal, or tax advice. Market timing and exposure decisions carry risk. Use this framework as a starting point for your research and consider consulting a licensed advisor for individual strategy.
Closing thoughts
The gold‑Bitcoin dynamic is a great example of how surface correlations hide deeper mechanisms. Instead of assuming a mechanical rotation between asset classes, focus on liquidity, the identity of marginal buyers, and the presence of speculative leverage. Those are the levers that will determine whether gold’s moves create opportunities for Bitcoin or simply signal incoming pain for all risk assets.
Keep an eye on the DXY, search and flow data for speculative signals, central bank operations, and the 2026 debt calendar. With disciplined position sizing and clear triggers, you can navigate the cycles rather than be surprised by them.
