

Table of Contents
- Outline
- Why AMD is the simplest money-making concept you’ll use
- Step-by-step setup
- Entry rules — fair value gaps and risk placement
- Get better take profit levels with a custom Fibonacci
- Backtest snapshot: real results worth noting
- Applying the strategy across markets — including crypto
- Practical tips and common mistakes
- How often does this AMD setup occur?
- What timeframes should I use to find the bias and entry?
- Can this strategy be used on crypto?
- Is this financial advice?
- Final thoughts
Outline
- What AMD means and why it matters
- Step-by-step setup (timeframes, bias, and the 10:00–11:30 window)
- Entry rules: fair value gaps and stop placement
- Improved take profit using a custom Fibonacci setup
- Backtest results and what they tell us
- Practical tips, common mistakes, and a short FAQ
Why AMD is the simplest money-making concept you’ll use
AMD stands for Accumulation, Manipulation, Distribution. It describes a repeating market pattern:
- Accumulation — price grinds sideways, building resting liquidity above and below the range.
- Manipulation — a swift liquidity grab that pokes beyond the range, often opposite the next intended move.
- Distribution — the big, powerful move that exploits that grabbed liquidity and runs toward the opposite side.
In bullish contexts you commonly see open → low → high. In bearish contexts open → high → low. Once you can spot accumulation and the subsequent liquidity grab, you can anticipate where price is likely to run.
Step-by-step setup
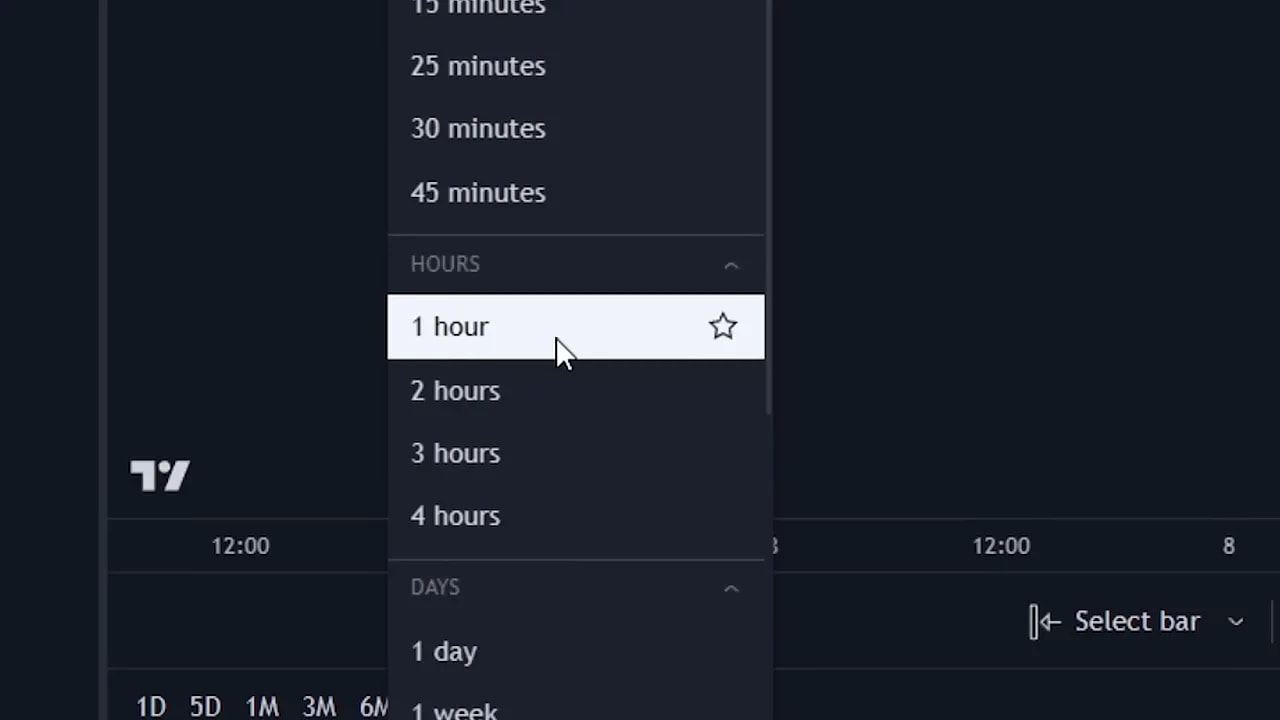
1. Pick your chart software and timeframe
Use any solid charting platform. I use a popular one that shows price action cleanly. Start on the 1-hour timeframe to set the bias. Higher highs and higher lows equals bullish bias; lower highs and lower lows equals bearish bias.
2. Drop to the 5-minute timeframe and mark your trade window
All setups are taken between 10:00 a.m. and 11:30 a.m. Eastern — that’s roughly 30 minutes after the open to 2 hours after open depending on your local market. Mark those times with two vertical lines and only consider setups inside that box.

3. Look for accumulation then manipulation
Inside that time box you want to see accumulation followed immediately by manipulation. If your bias is bullish, manipulation should dip lower first — grabbing stop liquidity below the range — then reverse into distribution north. If bearish, manipulation will spike up and then collapse.

Entry rules — fair value gaps and risk placement
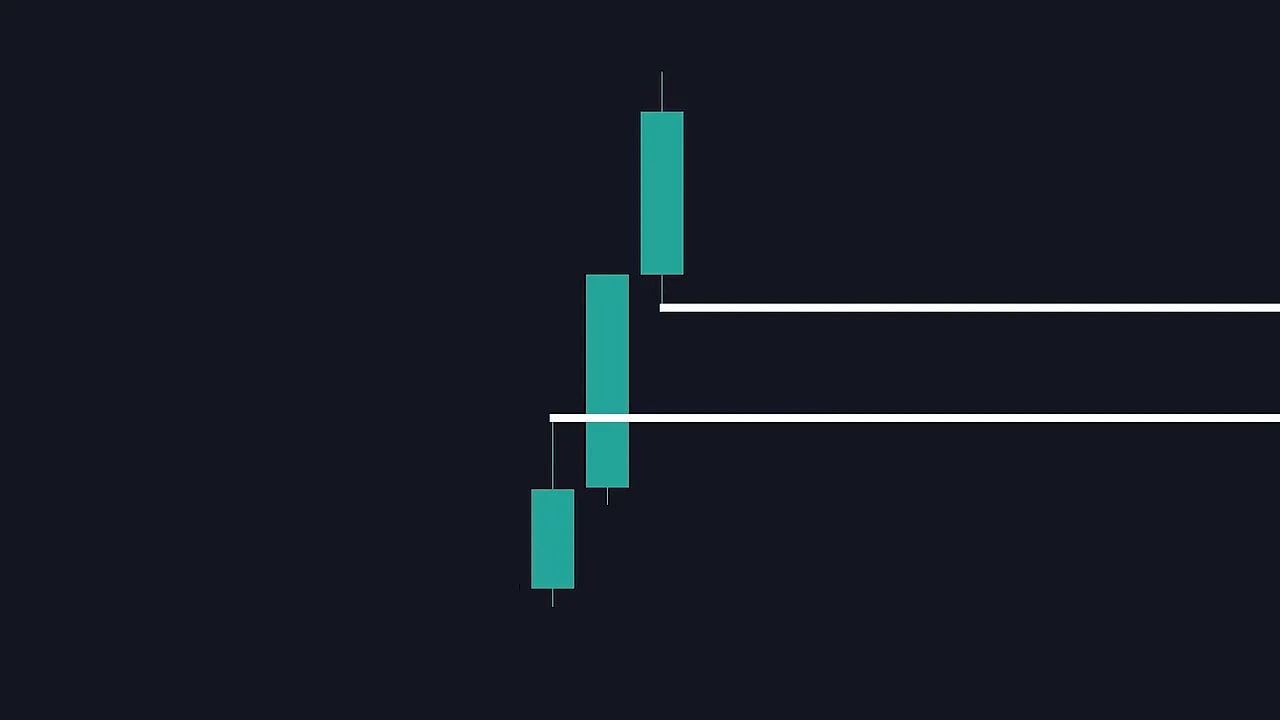
The preferred entry is on a fair value gap. That is the empty area created when price jumps so fast that there is a visible gap between the candle before the move and the candle after the move.
- After manipulation produces the spike and the subsequent strong move, identify the fair value gap left behind.
- Wait for price to return into that gap.
- Enter when price tests the gap and shows acceptance.
- Stop loss goes below the manipulation low (for bullish setups) or above the manipulation high (for bearish setups).
- Initial take profit target is the prior high (or low) created by the distribution move.
Get better take profit levels with a custom Fibonacci
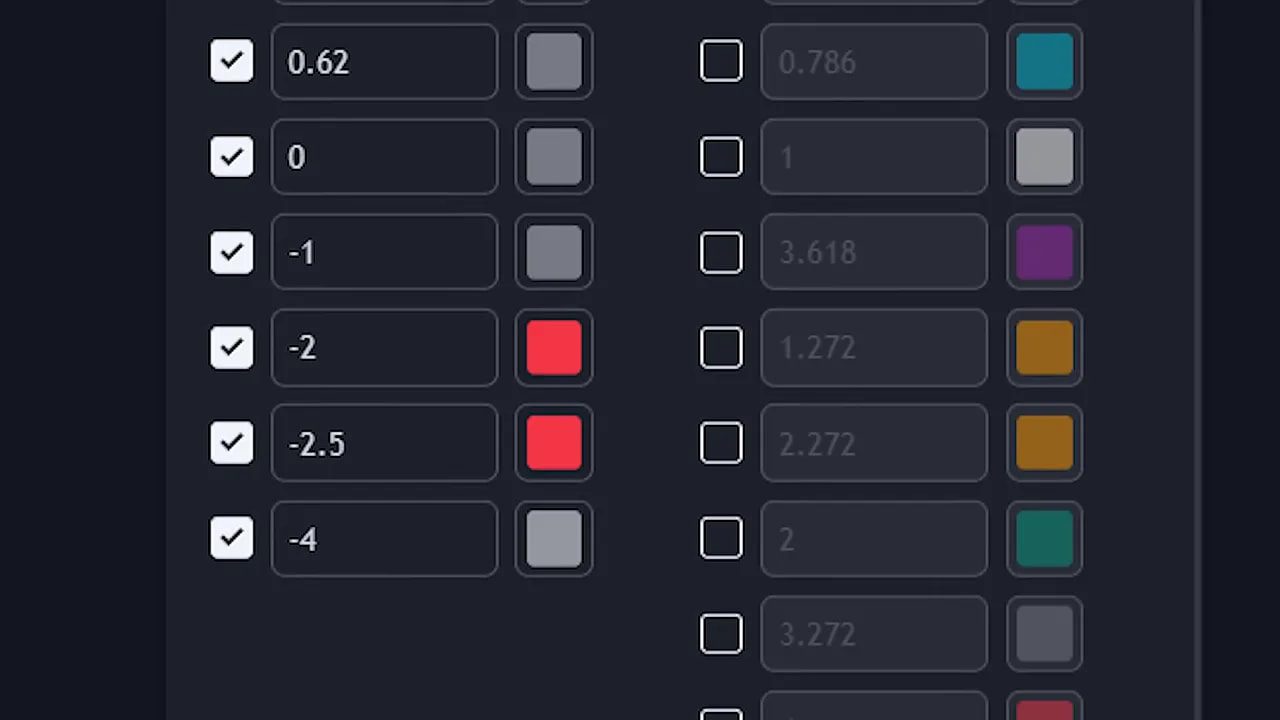
Instead of taking full profit at the first high, you can extend your capture by using a customized Fibonacci retracement to highlight realistic extension zones.
- Open the Fibonacci tool and adjust the level values to: 1, 0.79, 0.62, 0, -1, -2, -2.5, -4.
- Make most levels gray and style the -2 and -2.5 levels red so they stand out as the “red zone.”
- Draw the tool from the manipulation low to the most recent distribution high (bullish). The red zone becomes a high-probability area to take the majority of profits.
When that red zone lines up with higher-timeframe confluence like buy-side liquidity, you get much better odds and larger wins.
Backtest snapshot: real results worth noting
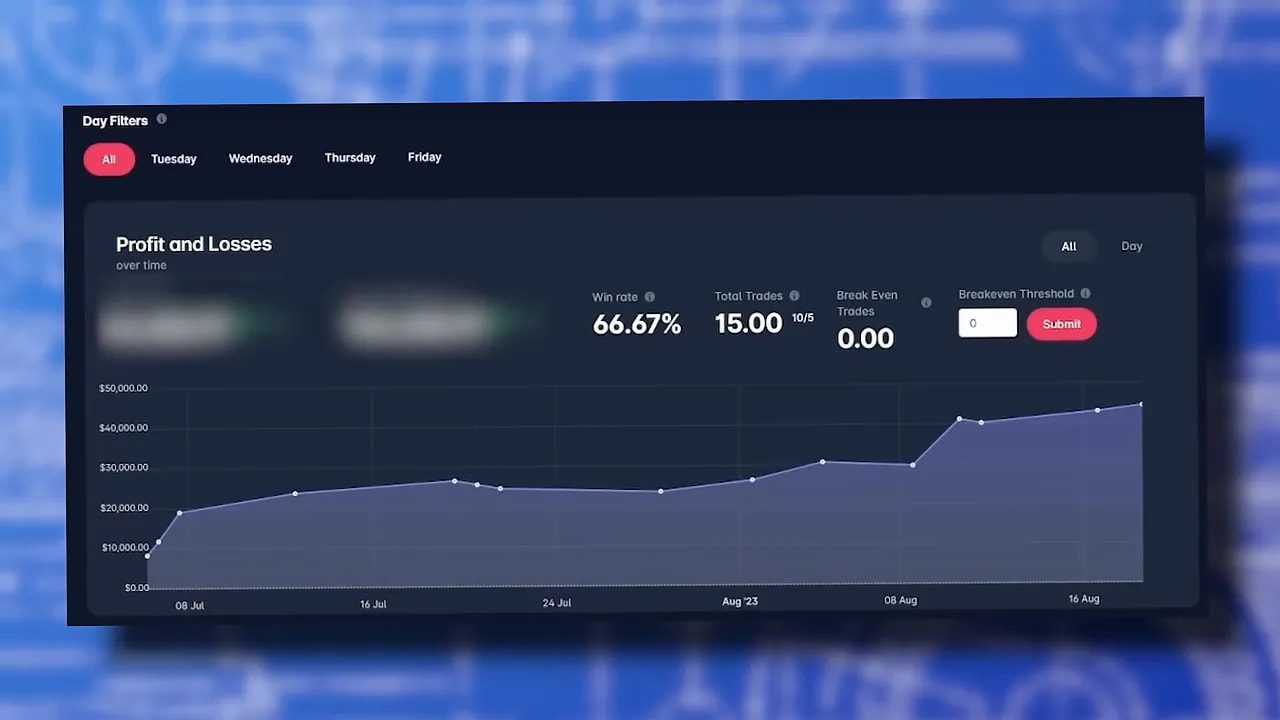
A 20-day backtest with a $100,000 starting balance followed the exact rules above. Conditions required accumulation and manipulation between 10:00 and 11:30.
- The setup appeared on 15 of the 20 days (75% frequency).
- 15 trades produced a win rate of 66%.
- Total profit over 20 trading days was 44.4%, meaning $100,000 grew to roughly $144,407.
That kind of edge does not mean every day is a winner, but it shows the power of a simple, repeatable edge when combined with proper risk management.
Applying the strategy across markets — including crypto
AMD is not limited to stocks. Crypto markets often exhibit the same accumulation-manipulation-distribution behavior, sometimes more exaggerated due to lower liquidity. If you trade multiple assets, this framework helps you screen for high-probability setups fast.
For traders who want real-time head starts, a quality crypto trading signals service can surface these AMD-style opportunities across top blockchains and centralized exchanges. A reliable signals feed saves time scanning multiple tickers and charts and can be used to confirm setups before committing capital.
Practical tips and common mistakes
- Only trade inside the time box. Setups outside 10:00–11:30 are ignored to retain the edge.
- Respect the bias. Accumulation followed by manipulation in the same direction as your bias increases probability.
- Wait for gap acceptance. Don’t chase the move — wait for price to test the fair value gap before entering.
- Size accordingly. Backtest results are about percentage returns; adjust position size to your capital and risk tolerance.
- Combine signals and analysis. Use higher timeframe confluence, liquidity zones, and the customized Fibonacci to stack the odds.
How often does this AMD setup occur?
In a 20-day sample the setup appeared on 15 days, or about 75% of the time. Frequency will vary by market and volatility regime, but expect it to show up regularly in liquid assets.
What timeframes should I use to find the bias and entry?
Use the 1-hour timeframe to determine bias and the 5-minute timeframe for entries inside the 10:00–11:30 window. The 5-minute view gives the resolution needed to spot accumulation, manipulation, and fair value gaps.
Can this strategy be used on crypto?
Yes. Crypto often shows pronounced AMD behavior. Because crypto moves fast, consider using a signals service to monitor multiple tickers and reduce the time spent scanning. That said, apply the same rules: bias, time window, accumulation, manipulation, and fair value gap entry with disciplined risk.
Is this financial advice?
No. This is an educational trading framework. Always test strategies with paper trading or small sizes first and manage risk carefully. Past performance does not guarantee future results.
Final thoughts
The power of this approach is its simplicity: identify accumulation, wait for manipulation within a defined time box, then enter on a fair value gap with clear risk and a layered take profit plan. When those elements align, the odds tilt in your favor.
Keep testing, refine your execution, and consider augmenting your workflow with curated crypto trading signals if you trade across many assets. That combination can turn pattern recognition into repeatable profits.
