

The big question right now is simple: should you still believe the old market saying, “sell in May and go away”, or is that exactly the wrong move in this environment?
I think a lot of people are being fooled by old expectations. They are looking for this cycle to behave exactly like previous crypto bear markets and previous post-halving setups. But the data lining up today suggests something very different. In fact, some of the strongest macro and on-chain signals are flashing bullish at the same time.
That matters because Bitcoin is not trading in isolation. It is tied to broader risk appetite, especially tech. And if tech earnings, the business cycle, and liquidity conditions are all turning supportive while Bitcoin and Ethereum are setting up technically, then the next move could catch a lot of sidelined people off guard.
Table of Contents
- Why “Sell in May” May Be the Wrong Read This Time
- The Macro Signal Most People Are Ignoring
- Bitcoin’s Monthly RSI Is Flashing a Major Trend Change
- MVRV Suggests Bitcoin Is in a Bottoming Zone
- Even Traditional Macro Analysts Are Starting to Sound Bullish on Bitcoin
- The Cup and Handle Setup on Bitcoin’s Monthly Chart
- Stocks Are Strong, and That Matters for Crypto
- The Two Macro Signals That Historically Precede Explosive Bitcoin Moves
- Earnings Growth Is Fueling the Risk Trade
- Bitcoin as a Retail Fear and Greed Gauge
- The Bull Case for Ethereum Is Getting Harder to Ignore
- Why Ethereum Could Be Facing a Supply Squeeze
- The Bigger Ethereum Narrative: Clarity, Rate Cuts, AI, and Tokenization
- Why Sentiment Matters More Than Most People Think
- So, Is the Bottom In?
- FAQ
Why “Sell in May” May Be the Wrong Read This Time
Historically, it is fair to ask whether May leads to softer summer conditions. Plenty of market participants expect a pump in May, weakness in June and July, and maybe even some sort of capitulation in September or October.
That is the conventional expectation. The problem is that markets rarely reward the most obvious consensus view for long.
What stands out right now is that the backdrop does not look like a market rolling over. It looks like a market regaining strength.
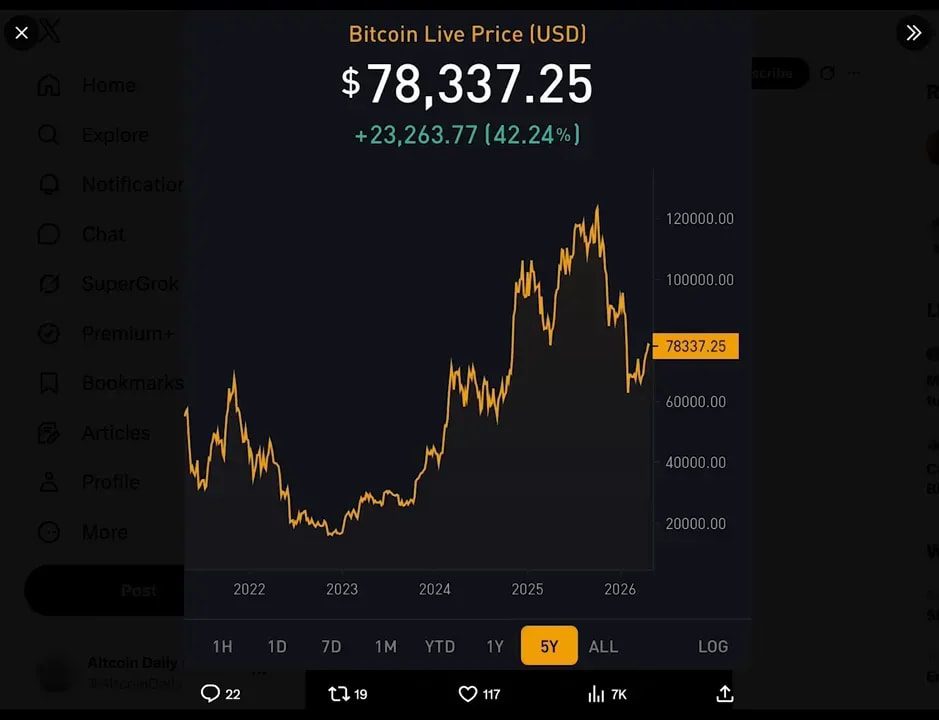
One of the clearest examples is Bitcoin itself. Moving off the low $60,000 range and pushing toward $80,000 says demand is there. And because Bitcoin and the Nasdaq are so closely linked in risk-on environments, that move says something broader about investor appetite too.
When both tech and crypto are acting strong, it becomes a lot harder to argue that the easy answer is simply to step aside for the summer.
The Macro Signal Most People Are Ignoring
Start with the business cycle.
The ISM manufacturing data has stayed above 52 for four straight months. That is not noise. That is not a one-month blip. That is a trend.
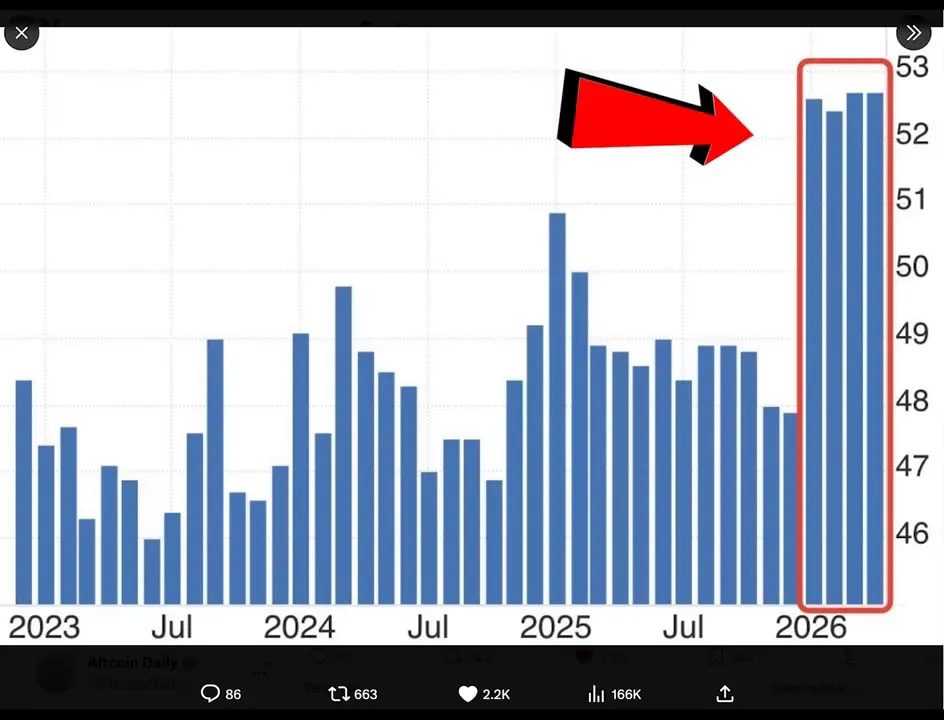
Four straight months of business cycle expansion changes the conversation. It suggests the current environment is meaningfully different from the sluggish backdrop that dominated much of 2022 through 2025.
If the economy is expanding instead of contracting, that supports earnings, risk assets, and speculative markets. Crypto tends to do best when macro is not fighting it.
This is one reason the setup looks stronger than many people appreciate. Too many traders are waiting for old recession-style signals to return, while the actual data is showing a fresh expansion phase.
Bitcoin’s Monthly RSI Is Flashing a Major Trend Change
On the Bitcoin chart, the monthly RSI is one of the key signals worth paying attention to.
The argument here is straightforward: when Bitcoin’s monthly RSI flips after a long decline, it has historically signaled that the bottoming process is either underway or already complete. That does not mean price goes straight up in a line, but it does mean the probability starts shifting away from deep downside and toward a new upside phase.
This is where a lot of bearish commentary falls apart. Many people seem convinced that every bear market has to hit the exact same triggers in the exact same way.
That is not how markets work.
If the prior upside cycle was calmer and less euphoric than other cycles, then the downside does not need to be as violent either. Cycles rhyme, but they do not copy and paste.
MVRV Suggests Bitcoin Is in a Bottoming Zone
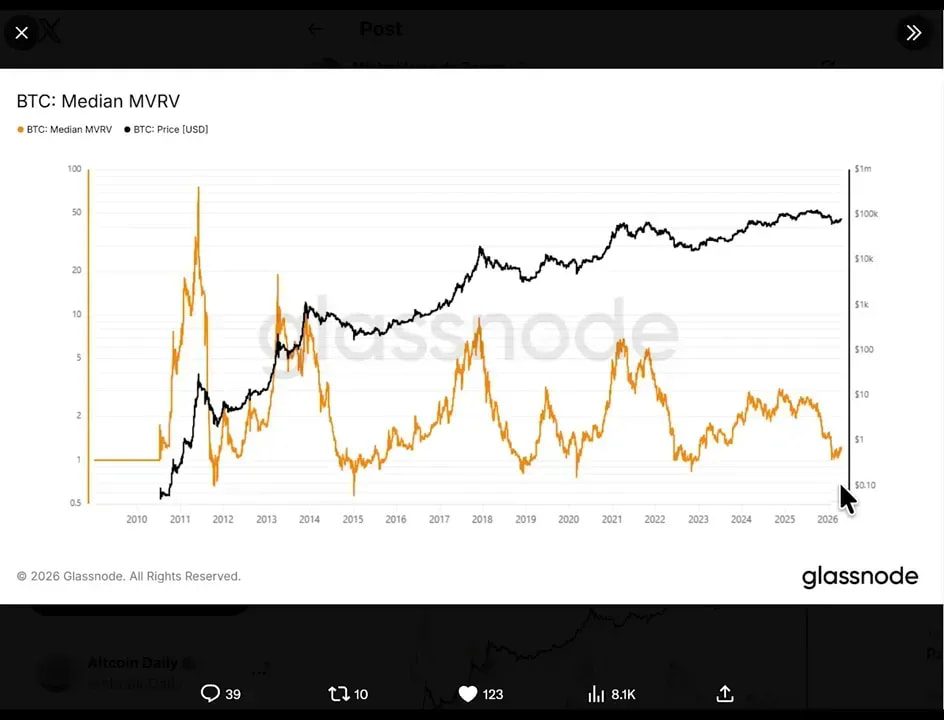
Another important metric is the medium-term MVRV.
Historically, this measure has helped identify bear market bottoms. The current reading is being compared to prior major low zones such as:
- 2015
- 2018
- The 2020 COVID crash
- 2022
The implication is not that price has to bottom on one exact day. The implication is that Bitcoin is trading in the kind of valuation area where major bottoms tend to form.
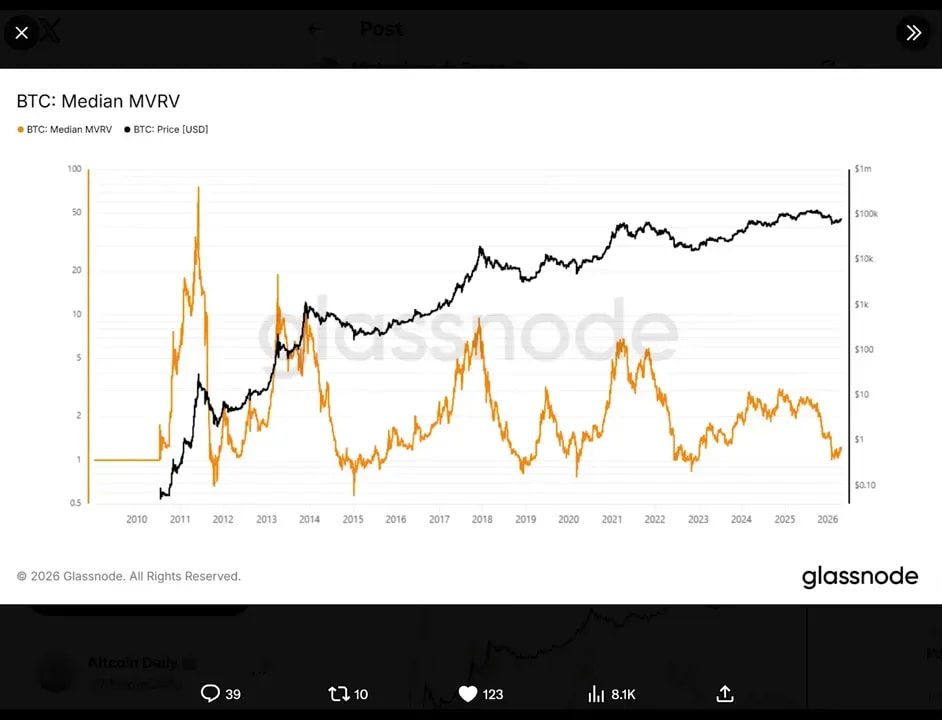
If that interpretation is correct, then the more important takeaway is what usually comes next: not weeks, but potentially two to three years of bullish market conditions.
For anyone trying to position around trend changes instead of reacting late, this is the kind of context that matters.
And if you are actively trading these swings rather than just investing long term, having a disciplined process matters even more. This is where cryptocurrency trading signals can be useful, especially when market structure is shifting and traders are trying to separate real breakouts from fake-outs.
Even Traditional Macro Analysts Are Starting to Sound Bullish on Bitcoin
This is not just a crypto-native argument.
The head of global macro at Fidelity has suggested that Bitcoin may have already bottomed and that another bullish phase may be starting. His framework is not ideological. It is chart-driven and comparative.
The key points in that view are:
- Bitcoin’s momentum has improved
- Its Sharpe ratio has improved relative to gold and commodities
- There has been visible rotation away from gold ETFs and toward Bitcoin ETFs
That last point matters a lot. Capital rotation is one of the clearest signs of changing preference. If investors are moving away from traditional safe-haven exposure and increasing Bitcoin exposure, that says Bitcoin is gaining legitimacy as a macro asset, not just a speculative token.
For more context on that broader store-of-value debate, this comparison of Bitcoin vs. gold is a useful reference.
The Cup and Handle Setup on Bitcoin’s Monthly Chart
Technically, one of the most bullish interpretations on the table is that Bitcoin’s monthly chart is forming a cup and handle pattern.
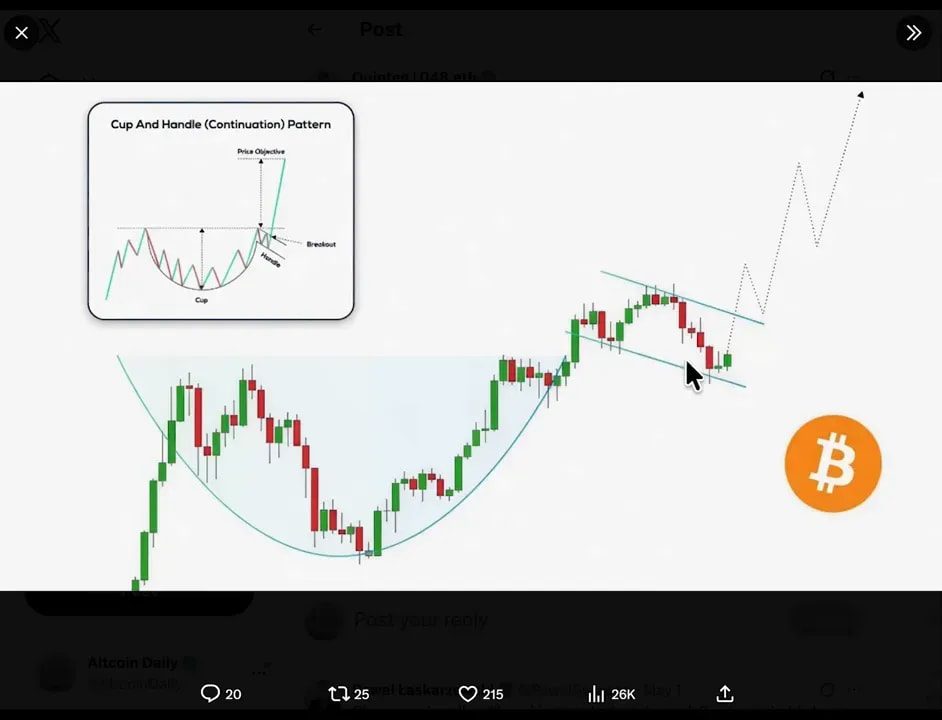
If that pattern fully plays out, it points to a major continuation move higher.
Now, no technical setup is guaranteed. There is always a chance of another leg down. But the broader point is that the odds do not appear to favor a dramatic breakdown as strongly as many people assume.
In fact, the argument here is that Bitcoin may be more likely to run toward the $90,000 to $95,000 zone in the shorter term than to revisit a deep washout.
Why?
- It already broke below the 50-week moving average
- It already tagged the 200-week moving average
- It does not necessarily need to break far below that level
In 2022, price fell much harder because multiple black swan events hit the market. That is a very different setup from a market where traditional equities are showing unusual strength.
Stocks Are Strong, and That Matters for Crypto
One of the biggest differences right now is that the S&P 500 and Nasdaq are near all-time highs.
That is not a trivial detail.
Bitcoin is deeply connected to the broader risk-on trade, especially to technology stocks. If the S&P 500 is recovering at one of the fastest paces in 25 years, even in the face of geopolitical stress and tariff concerns, then it becomes much harder to make the case that Bitcoin should still be acting like a deeply distressed asset.
Instead, the better interpretation may be that Bitcoin is still undervalued relative to the strength of traditional markets.
This is also why comparing asset classes can be so useful. Crypto and equities often move together in liquidity-driven regimes. If you want a broader framework for that relationship, this breakdown of stocks vs. crypto helps frame how each behaves in different environments.
The Two Macro Signals That Historically Precede Explosive Bitcoin Moves
Here is where the case gets especially interesting.
Two macro indicators are reportedly aligning at the same time:
- Copper vs. gold one-month MACD bullish cross
- Business cycle expansion
When those two conditions have aligned in past cycles, they have marked the beginning of Bitcoin’s most explosive periods, with those runs lasting roughly 380 days on average.
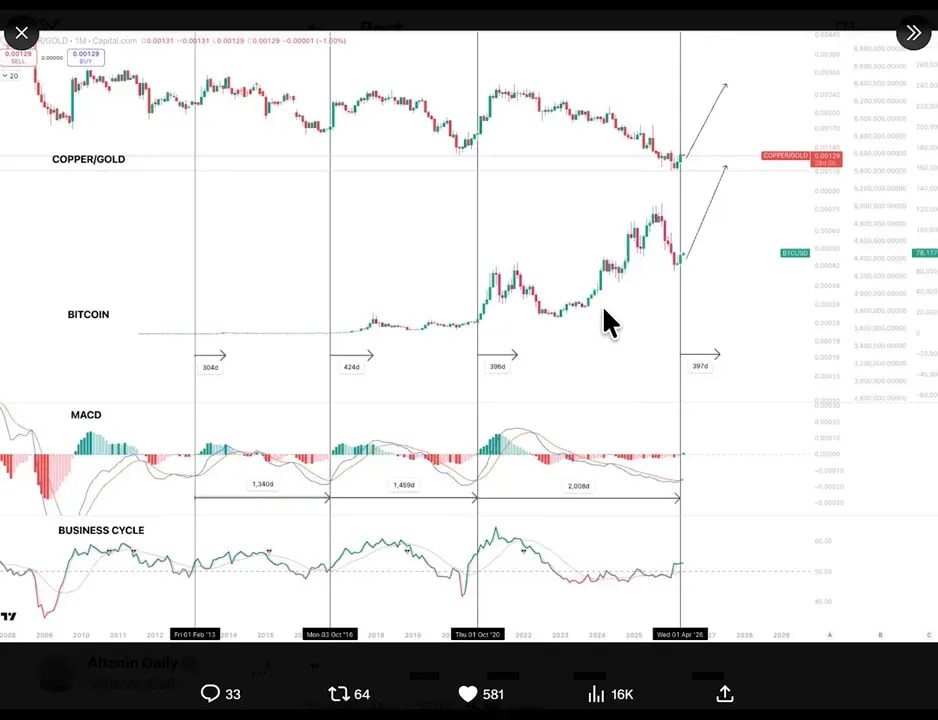
That is a powerful claim because it shifts the focus away from noisy daily headlines and toward a higher-level framework. Copper outperforming gold often reflects improving growth expectations and a stronger risk-on backdrop. Pair that with economic expansion, and you have the kind of macro foundation that tends to support aggressive upside in Bitcoin.
This does not mean volatility disappears. It means the base case changes.
Earnings Growth Is Fueling the Risk Trade
The next part of the bull thesis is corporate earnings.
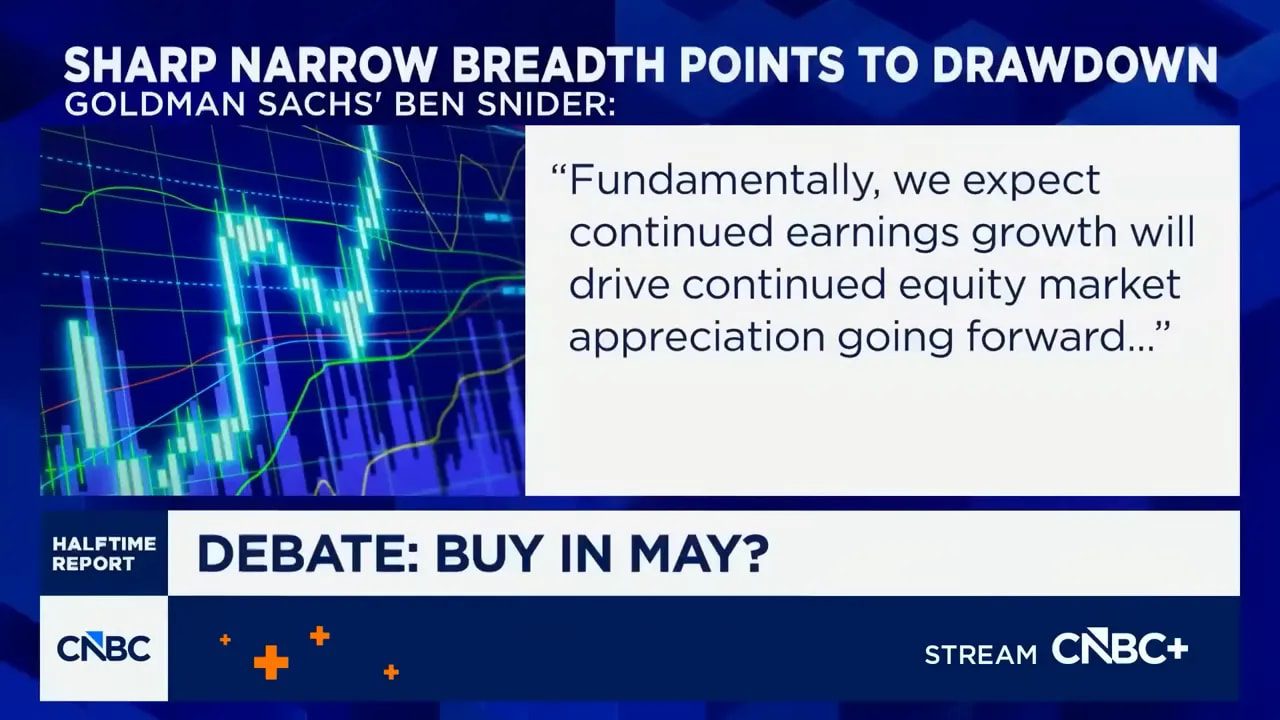
According to the market commentary highlighted here, S&P 500 earnings growth expectations have risen from roughly 15% to 19% year over year. And the sector driving those upward revisions is technology.
That matters because tech has been the engine of this market, and Bitcoin tends to perform best when that engine is running hot.
Markets are going higher, and it is because of earnings growth.
That is the essential argument. If tech earnings continue to surprise to the upside, then the broader equity market can keep grinding higher. And if the Nasdaq remains strong, Bitcoin benefits from the same investor appetite for growth and momentum.
In other words, the midterm catalyst is not some mystical crypto-only event. It may be as simple as this: earnings remain strong, liquidity conditions improve, and investors continue reaching for high-beta assets.
Bitcoin as a Retail Fear and Greed Gauge
One of the more interesting ideas here is that Bitcoin itself acts like a retail fear and greed index, perhaps even more directly than something like the VIX when it comes to reading speculative enthusiasm.
If Bitcoin can rip from the low $60,000s toward $80,000 while tech is strong, that says retail demand is alive. And when retail demand and institutional flows begin reinforcing each other, that is when trends can become much stronger than expected.
For traders trying to capture those momentum bursts, timing and confirmation matter. That is another place where carefully filtered cryptocurrency trading signals can complement broader macro analysis, especially in periods where Bitcoin leads and altcoins lag before catching up.
The Bull Case for Ethereum Is Getting Harder to Ignore
If Bitcoin is building the foundation, Ethereum may be the higher-beta opportunity sitting right behind it.
The thesis is that once the market really gets moving again, this is Ethereum’s cycle to lose.
A major reason is Ethereum dominance. ETH dominance has fallen toward roughly 10% to 11%, which is being framed as a critical support area. Historically, when Ethereum dominance bottoms near that zone, major outperformance can follow.
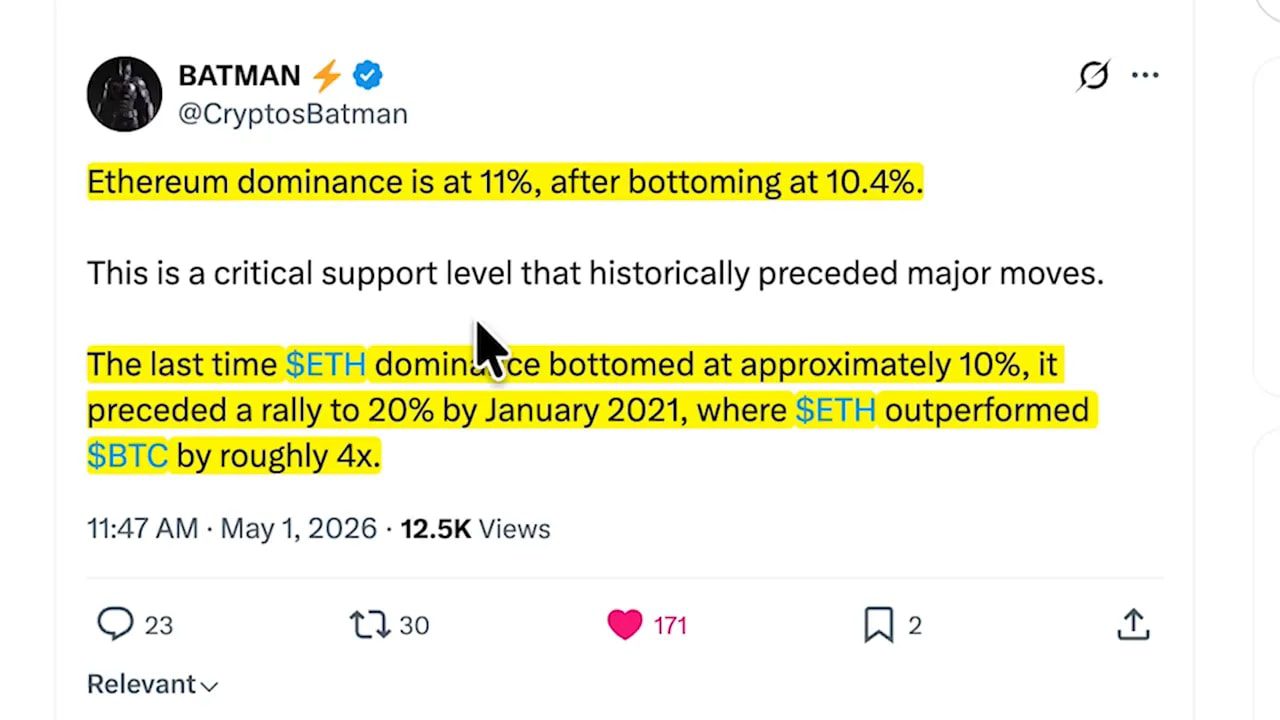
The historical example used here is the January 2021 move, when Ethereum dominance rebounded from around 10% and ETH went on to significantly outperform Bitcoin, by roughly 4x during that stretch.
Ethereum has a habit of surprising people exactly when sentiment is most indifferent. That is what makes this setup so interesting. The excitement is not there yet, which is often exactly when the asymmetry starts to improve.
Why Ethereum Could Be Facing a Supply Squeeze
The bullish Ethereum case is not just technical. There is also a supply-side argument.
One update highlighted is that approximately 83% of Bitmine’s ETH holdings are now staked, up from 70%. The interpretation is that more ETH is being locked up rather than being sold on the open market.
Combined with the idea that major holders are absorbing supply that might otherwise create sell pressure, the result is a potential supply squeeze.
The core point is simple:
- Less liquid ETH available
- More ETH staked
- Reduced immediate sell pressure
That kind of setup can matter a lot if demand starts climbing at the same time.
Short term, the upside target discussed is roughly $3,700 to $3,800. Mid to long term, the suggestion is that the next one to two years could be especially favorable if macro and regulatory tailwinds line up.
The Bigger Ethereum Narrative: Clarity, Rate Cuts, AI, and Tokenization
The long-term Ethereum bull case comes from multiple forces converging at once.
These include:
- Potential passage of the Clarity Act, which could improve regulatory certainty for institutions
- Lower interest rates, which tend to support liquidity and risk assets
- Quantitative easing or renewed liquidity expansion, pushing capital to seek returns
- The rise of agentic AI, where AI systems may need blockchain-based settlement rails
- Tokenization of real-world assets, a trend often associated with Ethereum’s infrastructure
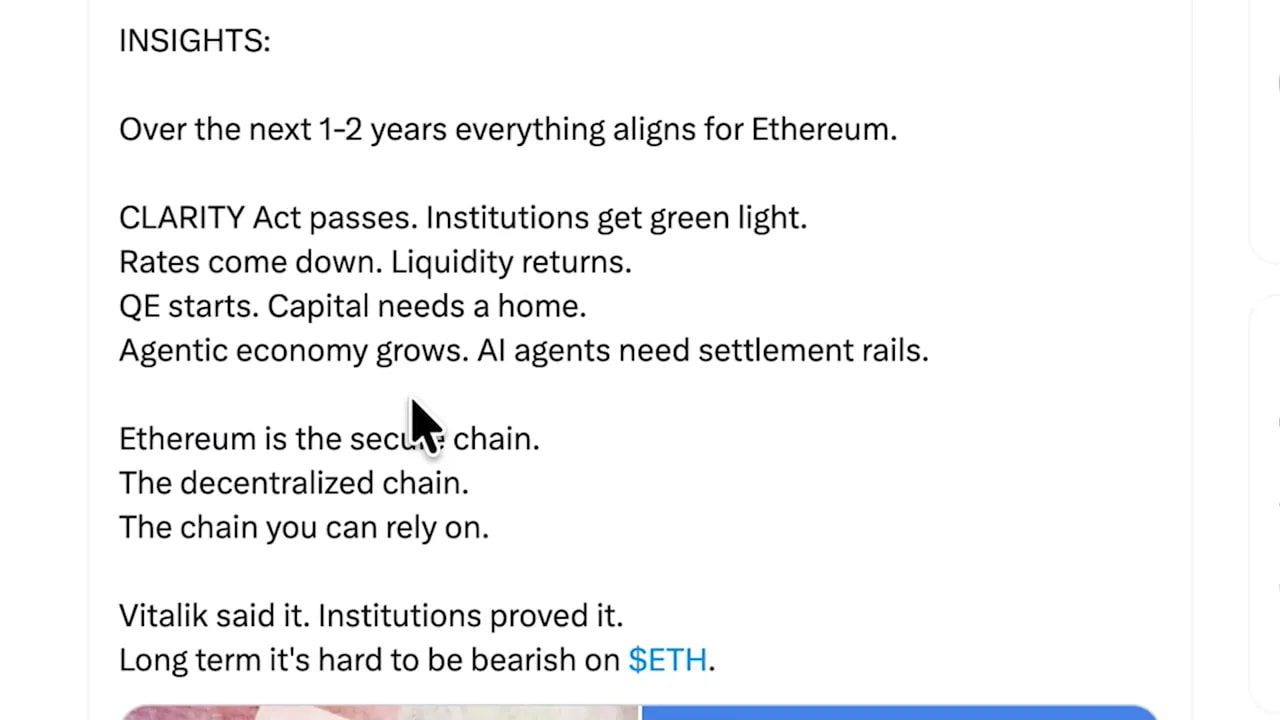
The bullish framing is that Ethereum is positioning itself as a kind of global settlement layer. If tokenization expands and AI-driven systems require programmable, neutral, on-chain settlement, Ethereum is one of the most obvious places that value could accrue.
This is why the current boredom around ETH may be so misleading. Long consolidations often create frustration before they create explosive moves.
The claim here is that Ethereum has never consolidated for this many years, and while long consolidations can feel terrible in real time, they have historically preceded some of the biggest breakouts.
Why Sentiment Matters More Than Most People Think
One of the most useful reminders in all of this is psychological, not technical.
The best time to buy is usually not when everybody is excited. It is often when people have stopped paying attention, when sentiment shifts from fear to boredom to indifference.
That is especially relevant in Ethereum right now. Enthusiasm is nowhere near the mania levels of previous cycles. Yet the underlying narratives around staking, tokenization, regulation, and AI integration are arguably becoming stronger, not weaker.
When sentiment disconnects from fundamentals, that is usually where the most interesting opportunities live.
For active traders, this is also where structured trade planning becomes important. If you are navigating altcoin rotations and momentum setups across Bitcoin, Ethereum, and other ecosystems, good cryptocurrency trading signals can help identify high-probability entries without relying purely on emotion or social media hype.
If that is something you are exploring, resources on the best crypto signals can help compare what actually makes a signal service useful versus just noisy.
So, Is the Bottom In?
No one can guarantee an exact bottom. That is not how markets work.
But if you step back and look at the full picture, the bullish case is real:
- Business cycle expansion has been sustained for months
- Bitcoin monthly RSI is signaling a trend shift
- MVRV is in historical bottoming territory
- Fidelity macro commentary is turning constructive
- Bitcoin may be forming a major cup and handle
- Stocks and tech are strong, not weak
- Copper vs. gold and business cycle data are aligned
- Earnings growth is beating expectations
- Ethereum dominance is near a historically important support zone
- ETH supply dynamics are tightening through staking and reduced sell pressure
- Regulatory clarity, lower rates, tokenization, and AI could all support Ethereum over the next cycle
Put all of that together and the idea that crypto is quietly setting up for a much bigger move does not sound crazy at all. It sounds increasingly plausible.
FAQ
Does “sell in May and go away” still apply to Bitcoin and crypto?
It can apply in some years, but the current setup looks different. Strong tech performance, improving macro conditions, and Bitcoin’s recovery from the low $60,000s toward $80,000 suggest demand remains strong. The case here is that blindly following seasonal sayings may miss a larger bullish trend.
Why is the ISM manufacturing reading important for Bitcoin?
The ISM manufacturing index staying above 52 for four straight months points to business cycle expansion. Crypto typically performs better when the economy is expanding and investors are more willing to take risk.
What does Bitcoin’s monthly RSI signal mean?
A bullish flip in Bitcoin’s monthly RSI has historically appeared around important market bottoms or early bull phases. It does not guarantee immediate upside, but it often signals that downside momentum is fading and trend conditions are improving.
Why are people bullish on Ethereum right now?
The Ethereum bull case combines technical and fundamental factors. ETH dominance is near a historically important support level, more ETH is being staked, potential sell pressure may be decreasing, and long-term themes like tokenization, AI settlement rails, and regulatory clarity could all benefit Ethereum.
How are stocks connected to Bitcoin?
Bitcoin often trades like a high-beta tech asset during risk-on periods. When the Nasdaq and broader equity markets are strong, especially on the back of earnings growth, Bitcoin often benefits from the same appetite for growth and momentum.
Where do cryptocurrency trading signals fit into a market like this?
When markets are transitioning from uncertainty to trend, trading signals can help identify entries, exits, and confirmation zones more systematically. They are especially useful for traders trying to navigate Bitcoin breakouts, Ethereum rotations, and altcoin momentum while managing risk carefully.
Nothing is ever guaranteed in crypto. But if you are waiting for conditions to become obvious before getting interested, history suggests that is usually late. The stronger move often begins while sentiment is still skeptical, while headlines are mixed, and while most people are still anchored to the last cycle.
That is exactly why this moment matters.
