

Table of Contents
- Why one indicator can replace a toolbox
- What’s included (features that matter)
- Best timeframe and market scope
- Entry types and a simple trade workflow
- How to avoid false signals
- Automatic support and resistance — use them as tactical exit and stop points
- Fair value gaps — what they are and how to trade them
- Putting it together — combining tools for higher win rates
- Settings and quick optimization tips
- Final thoughts
- FAQ
Why one indicator can replace a toolbox
After months of development and relentless backtesting, a single indicator can now combine real-time buy and sell signals, optimized take profit targets, automatic support and resistance, a trend metrics table, fair value gap detection, and several popular indicators prebuilt — all inside one chart overlay.
The goal is simple: reduce clutter, speed up decision making, and give traders a reliable set of signals they can tune to their risk profile. The result is an indicator designed for all liquid markets — stocks, Forex, crypto, futures — and built to be both customizable and practical.
What’s included (features that matter)
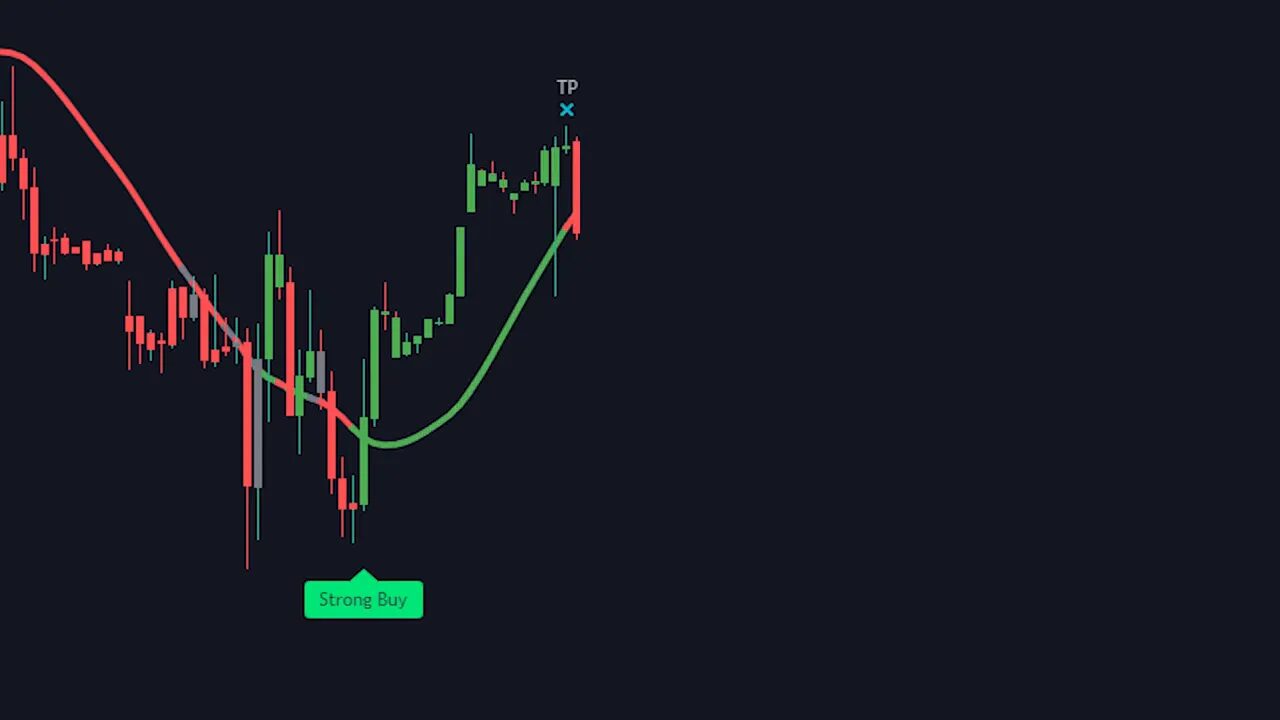
- Real-time entry signals: Strong Buy, Buy, Sell, Strong Sell for clearer probability differentiation.
- Optimized take profit marks: Two take profit targets generated automatically based on your sensitivity setting.
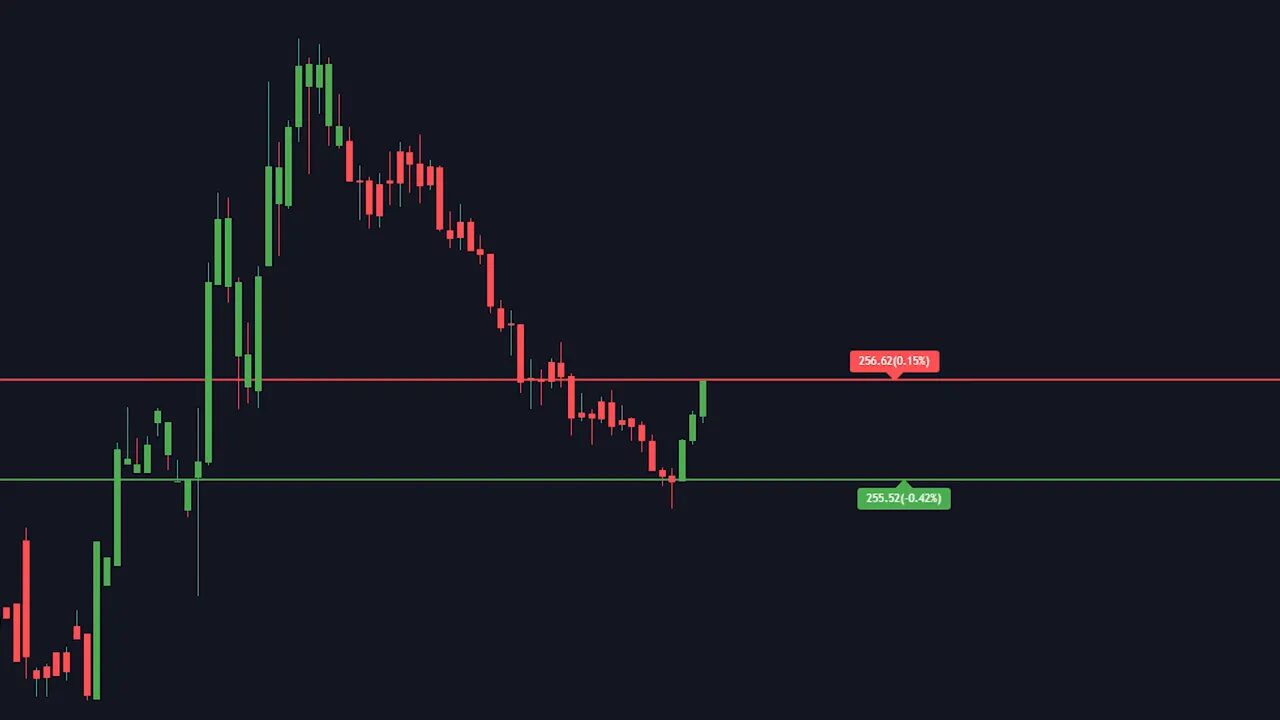
- Automatic support and resistance: The indicator shows the closest support and resistance lines so charts stay clean and actionable.
- Trend table / key metrics: One-glance data including trend, trend strength, momentum, volatility, volume, EMA close, and stock flow to validate signals.
- Fair value gap detection: Auto-draws imbalances (bullish or bearish) so you can trade retracements into those zones.
- Customizable sensitivity: Tune aggressiveness for entries, take profits, and more.
- Extras built-in: Daily pivot points and other common indicators are preinstalled so you do not need separate paid tools.
Best timeframe and market scope
Backtests point to the three-hour timeframe as the sweet spot for this indicator. It performs on any timeframe and market with sufficient volume, but the three-hour chart balanced signal frequency and reliability best in testing.
Entry types and a simple trade workflow
There are four entry classifications: Strong Buy, Buy, Sell, Strong Sell. Strong signals carry a higher probability, but regular signals still provide useful entries when confirmed with additional context.
A recommended trade flow:
- Enter on a Buy or Strong Buy (or short on Sell / Strong Sell).
- Take partial profits at the first take profit mark (suggestion: 25% to 75% depending on risk tolerance).
- Close the remaining position at the second take profit mark.
- If price consolidates or reverses near a pivot or resistance, consider closing early to preserve gains.
How to avoid false signals
No indicator is perfect. False entries are most common during consolidation. Two features help avoid these traps: the trend table and the customizable baseline.
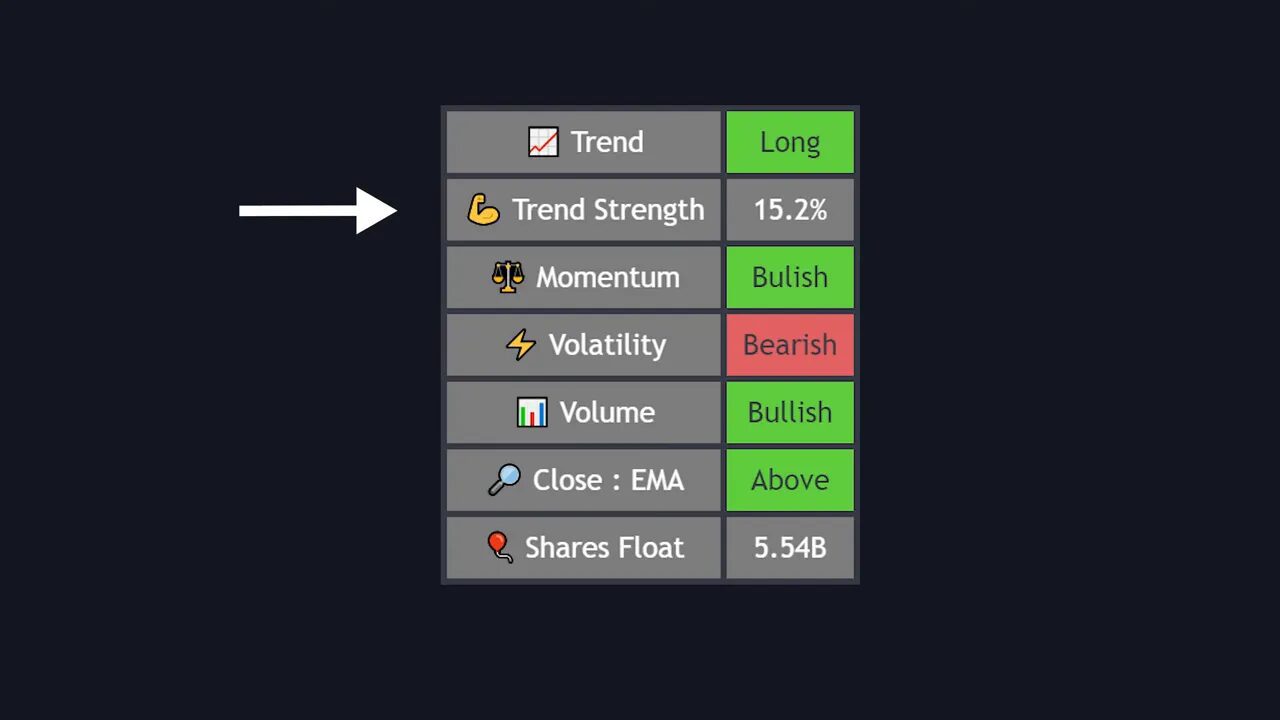
The trend table displays multiple metrics at a glance. For a high-probability long, most metrics should be bullish. For shorts, most metrics should be bearish. If the majority of metrics contradict the entry signal, treat that signal as low probability and skip it.
The baseline acts as a quick filter. Only enter longs when the baseline is green. If the baseline is red or gray, avoid long entries. Some traders even use the baseline color as a standalone signal, though combining it with signal arrows and trend metrics is safer.
Automatic support and resistance — use them as tactical exit and stop points
The indicator automatically draws the nearest support and resistance lines in real time so charts do not become cluttered with dozens of manually-drawn levels. Use these lines as potential take profit points or stop loss anchors.
Practical uses:
- Close a portion of your position when price reaches a nearby resistance even if no take profit signal appears.
- Place stop losses beneath a key support or a daily pivot point.
- If price breaks a daily pivot or major support, consider exiting even absent an exit arrow; a break of a daily pivot is a strong bearish sign.
- Manually mark strong daily turning points for higher-confidence take profit levels when you want extra safety.
Fair value gaps — what they are and how to trade them
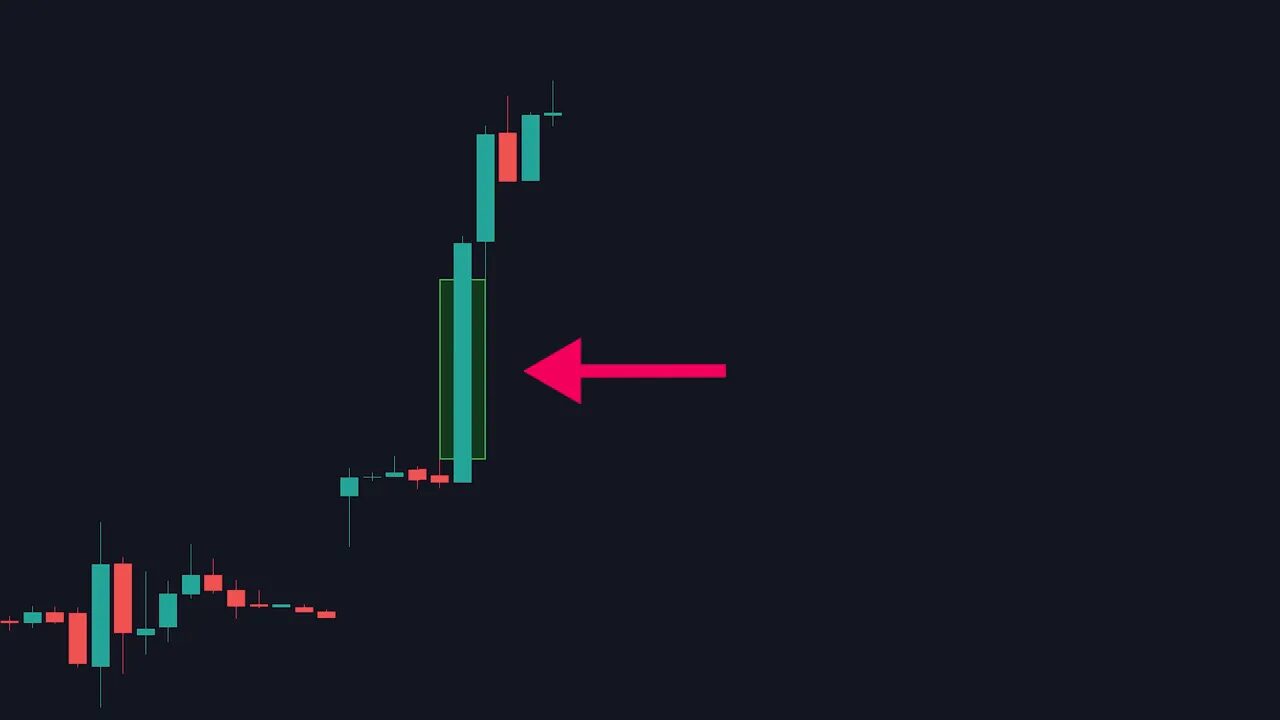
A fair value gap occurs when price moves very quickly in one direction, creating an imbalance where the opposing side did not have time to participate. Market mechanics tend to retrace to these gap areas to fill the imbalance before continuing.
How to trade a fair value gap:
- Wait for the indicator to draw the imbalance rectangle (green for bullish, red for bearish).
- Wait for price to retrace into the rectangle, ideally to the halfway mark for the best risk to reward.
- Enter at that zone, place stop loss below the swing low (for longs), and target the recent high as a take profit.
Notes: higher-timeframe imbalances carry more weight. Be prepared to miss some setups — only take the ones that provide a proper risk/reward and confirmation from volume, price action, or divergence.
Putting it together — combining tools for higher win rates
The indicator is powerful on its own, but it performs best when combined with strong trade management and complementary techniques:
- Volume analysis to confirm moves
- Price action and pattern recognition
- Divergences and momentum confirmations
- Daily pivot points and manual higher-timeframe support/resistance
- Strict position sizing and stop placement
The goal is not to follow arrows blindly. Use the indicator as the backbone of your strategy and layer on your own checks to filter low-probability signals.
Settings and quick optimization tips
- Sensitivity: Raise sensitivity for more signals and tighter take profits; lower sensitivity to reduce noise.
- Timeframe: Try the three-hour chart first based on backtests, then adapt to your schedule and risk tolerance.
- Entry types: Prefer Strong Buy/Strong Sell signals for higher probability trades, but validate regular signals with the trend table.
- Enable key metrics and baseline to reduce false entries significantly.
Final thoughts
A single, well-engineered indicator can drastically reduce decision fatigue and provide high-quality trade setups when used correctly. The real advantage comes from combining automated signals with human judgment: trend context, support and resistance, volume, and disciplined risk management.
If you want to explore more, the indicator is part of a larger toolkit available at tradinglab.ai.
FAQ
What timeframe should I use with this indicator?
Backtests showed the three-hour timeframe providing the best balance of signal quality and frequency, but the indicator works on all timeframes and markets with sufficient volume. Adjust to your trading style and test before committing.
Which markets are supported?
Any liquid market: stocks, Forex, crypto, futures. The indicator relies on volume and clean price action, so thinly traded assets may produce unreliable signals.
How do I avoid false signals during consolidation?
Use the trend table and baseline. If most trend metrics contradict the signal or the baseline color disagrees, skip the trade. Confirm with volume and support/resistance before entering.
What is a fair value gap and how should I trade it?
A fair value gap is an imbalance created by a fast price move where the opposite side did not participate. Trade retracements into the gap, preferably to the halfway mark, place stop loss beyond the swing low/high, and target the recent high/low for exits. Higher timeframe gaps carry more significance.
Can I use the indicator for automated trading?
The indicator provides real-time signals and metrics that can inform automated systems, but any automation should be thoroughly backtested and include proper risk controls. Manual confirmation layers improve robustness.
“You shouldn’t just blindly follow buy and sell entries; incorporate other trading techniques on top of the indicator to improve it that much more.”
