

Altcoins have been underperforming for years and 2025 was supposed to be the year everything changed. Instead many portfolios quietly melted. The headline culprit isn’t always market sentiment or macro capitulation — it’s tokenomics: how tokens are issued, distributed, burned, and repurchased. Properly understood, tokenomics explains why some projects soared on headline buybacks while others collapsed under the weight of massive unlocks and poor issuance design.
This article breaks down the real numbers, the structural shifts that defined tokenomics in 2025, and what to watch in 2026. Read this before you trade or invest in any altcoin — tokenomics can decide whether a project 100x or goes to zero.
Table of Contents
- The 2025 Buyback Wave: $8.1 Billion That Mattered More for How It Was Done Than How Much
- Burn Mechanics: From Hype to Sustainable Value
- TGEs, FDVs, and the Dangerous Lure of Sky-High Valuations
- Major Tokenomics Redesigns: Smoothing, Delaying, and Retargeting Supply
- Unlocks and Dilution: When Supply Increases Bite
- Tokenomics 2.0: What Maturity Looks Like
- How to Factor Tokenomics into Your Research: A Practical Checklist
- Case Studies: Applying the Checklist
- What to Watch in 2026
- Final Thoughts: Tokenomics Decides the Odds
- FAQ
- Closing
The 2025 Buyback Wave: $8.1 Billion That Mattered More for How It Was Done Than How Much
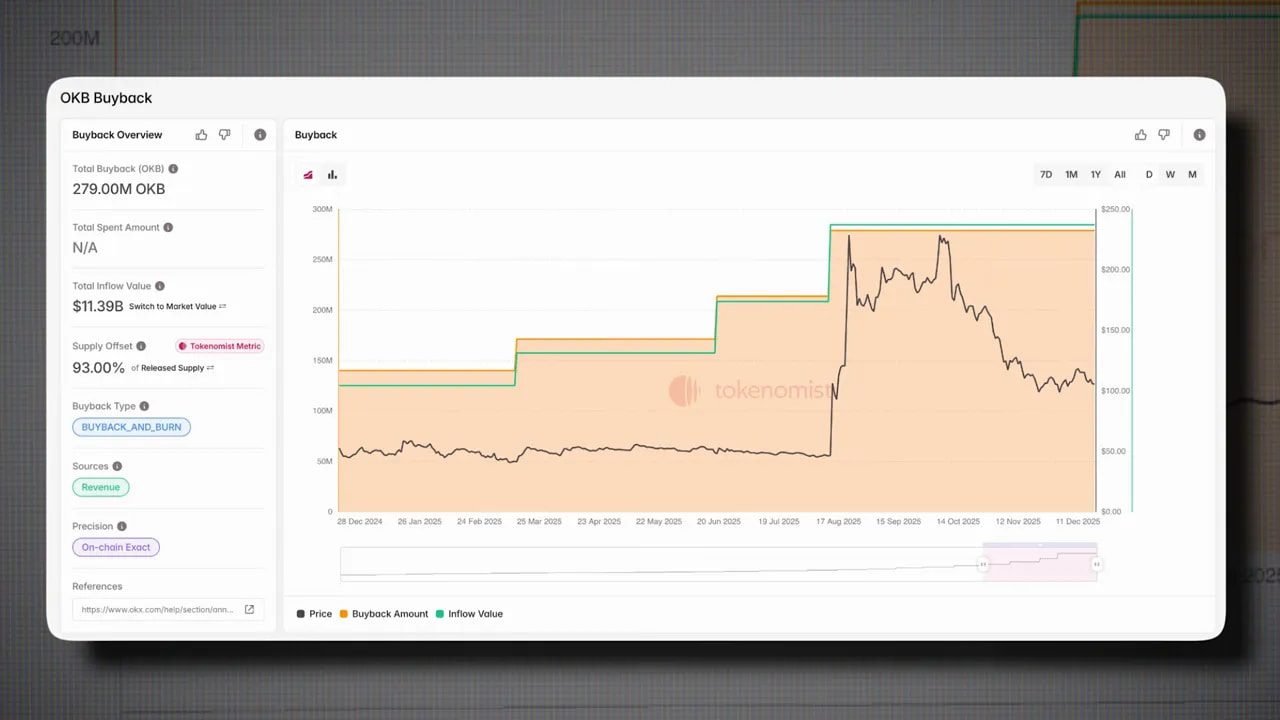
Buybacks exploded in 2025: $8.1 billion in total, up 145% from $3.3 billion the year prior. That headline shocks, but the more important story is concentration and mechanics. OKX’s OKB alone accounted for 79% of total buybacks. Hyperliquid and a handful of DeFi protocols made up much of the rest.
Even when you strip out OKB, buybacks still rose dramatically — monthly buybacks climbed from about $70 million in January to roughly $350 million in October, a near 5x increase. Seventeen of the 25 DeFi projects tracked ran buybacks at some point, often producing sharp, short-lived rallies.
Buybacks clearly matter because they reduce supply or re-allocate tokens, but not all buybacks are created equal. Two identical dollar amounts can have opposite outcomes depending on source and destination. This is the crux: where the money comes from and where the tokens go determines long-term token dynamics.
Buyback models and short-term performance
- Revenue-funded buys and burns — Most effective. Tokens that used protocol revenue to buybacks and burn surged around 73% on average in the first 90 days.
- Revenue-funded buys for treasury — Also strong. These saw roughly 61% gains in the first 90 days.
- Treasury-funded buybacks — Less favorable. Protocols using treasury funds to buy back tokens saw average drops of about 33%.
- Mixed funding (revenue + treasury) — Worst outcome: these tokens fell around 52% on average.
The lesson: buybacks are a tool, not a solution. They make sense when they match a project’s maturity profile — steady revenue, robust treasury, and a long-term plan. Revenue-funded burns are scalable and predictable. Treasury-funded buys are finite and can be perceived as artificial price support if used merely to chase a pump. And when emissions exceed buybacks, all the effort can be undone.
Example: OKB executed $6.4 billion of buybacks funded entirely by protocol revenue and achieved a massive run, including a roughly 300% spike in days. Meanwhile EtherFi bought back 2% of supply while issuing 64%, which still produced 62% inflation despite buybacks. Context and math matter.
There are strategic uses beyond pure price support. Treasury-held tokens can be deployed for airdrops, staking incentives, liquidity management, or ecosystem growth. If used strategically, buybacks signal project maturity and an emphasis on long-term value capture rather than short-term hype.
When evaluating buybacks, ask:
- Is the buyback funded by revenue or treasury?
- Are repurchased tokens burned or held in treasury?
- Does emissions schedule negate the buyback impact?
- Is the buyback part of a broader ecosystem strategy or a shallow price pump?
If you trade altcoins, buybacks can be catalysts. Consider an organized approach: a service that provides timely alerts for buyback announcements, burn events, and treasury moves can give you an edge. A well-run cryptocurrency trading signals offering can notify you about meaningful tokenomic events, helping you align entries with genuine supply shocks rather than noise.
Burn Mechanics: From Hype to Sustainable Value
Burns used to be a pure marketing lever: announce a burn, watch a short-lived squeeze, then fade. In 2025 burns matured into a core product design element. Three dominant burn mechanisms stood out:
- Revenue-driven burns — A fixed portion of fees or revenue is programmatically used to burn tokens. Predictable and transparent, but it can attract regulatory scrutiny because it resembles stock buybacks.
- Algorithmic treasury burns — An on-chain algorithm or smart contract periodically burns tokens from the treasury. Lower regulatory risk because it’s not directly a revenue allocation, but it is typically less predictable.
- Governance-driven burns — Token holders vote on burns. Highly decentralized and transparent, but future votes could reverse burns or increase issuance, so it is the least predictable.
Exchange tokens leaned into these mechanics aggressively. OKB’s $6.4 billion in buybacks and burns was unprecedented, reducing supply by 93% and bringing the total supply down to 21 million — intentionally mirroring Bitcoin. BNB followed with $4.7 billion burned and net deflationary pressure that year. Bitget’s BGB burned over $1.3 billion but added 12% back in emissions, yielding a modest net deflation.
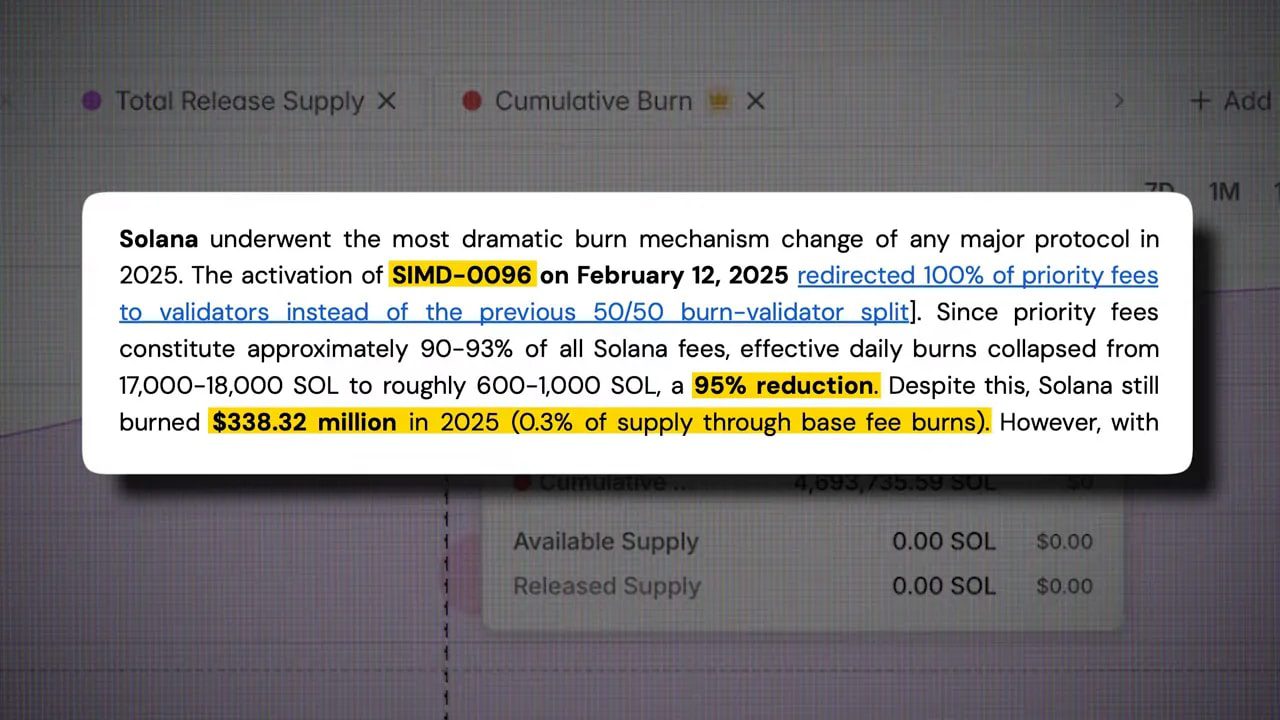
Layer 1 protocols also adjusted their burn logic. Ethereum burned about $280 million of ETH in 2025, yet ended the year slightly inflationary due to network activity shifting toward layer two solutions. Solana implemented a Solana Improvement Document in February that changed priority fee handling and slashed its daily burn rate by about 95%, dramatically altering its burn profile.
Meme coins also surprised the market by embracing large burns. Pengu burned 38% of supply and Bonk burned 12% — both team-driven decisions. These moves, while unconventional, can reduce the risk of team dumps and demonstrate intentional supply management.
Governance in action: when communities decide supply
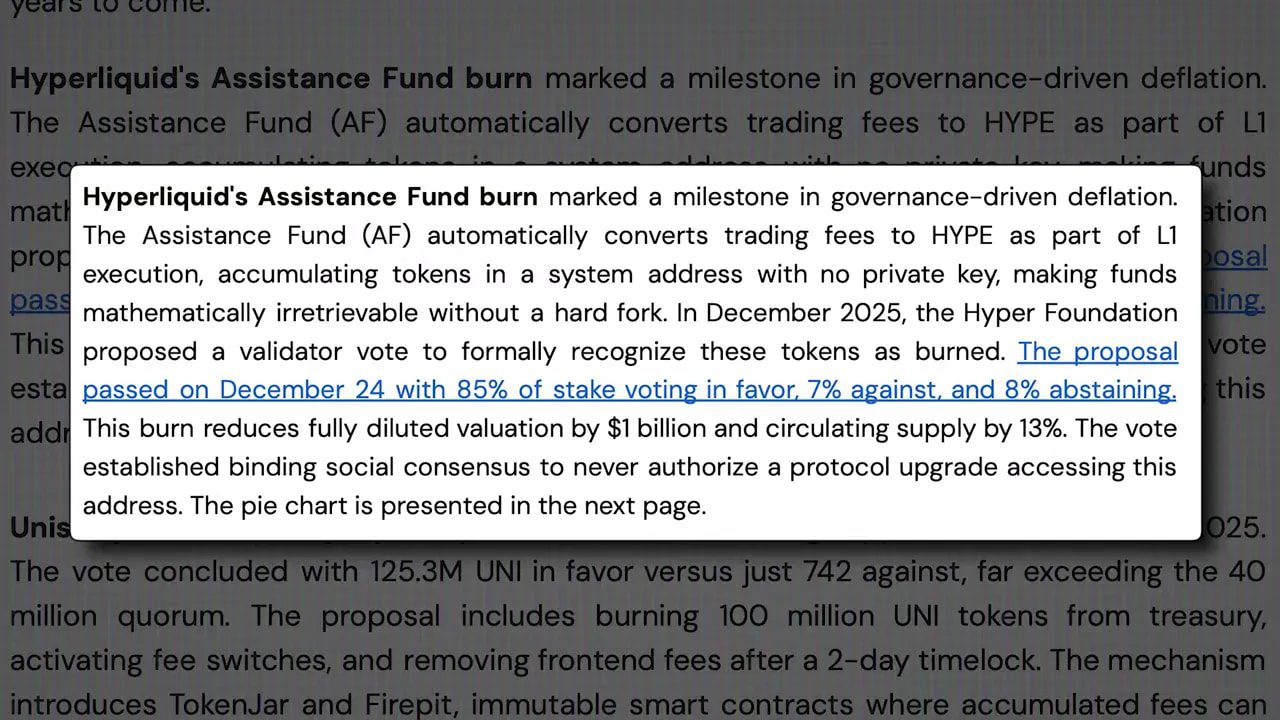
2025 showed that governance can be a decisive force in tokenomics. Hyperliquid’s validator-approved vote to convert trading fees to Hype and send them to a de facto burn address effectively removed the keys and slashed FDV by $1 billion while trimming circulating supply by 13%. The Uniswap unification proposal executed the burning of 100 million UNI from treasury and activated features that make UNI deflationary — a move the report described as the most sophisticated burn mechanism in DeFi.
Investors now value consistent, programmatic burns over one-off headline events. The key metrics to watch in 2026 include:
- Percent of supply burned
- 30-day burn value (fiat equivalent)
- Burn type (programmatic versus discretionary)
- Why the burn happened (revenue allocation, governance decision, defensive action)
Tracking these metrics helps separate PR theater from genuine, ongoing deflationary pressure.
TGEs, FDVs, and the Dangerous Lure of Sky-High Valuations
Token generation events (TGEs) in 2025 taught a painful lesson: fundraising numbers and FDV narratives can be toxic if not rooted in realistic demand or product-market fit.
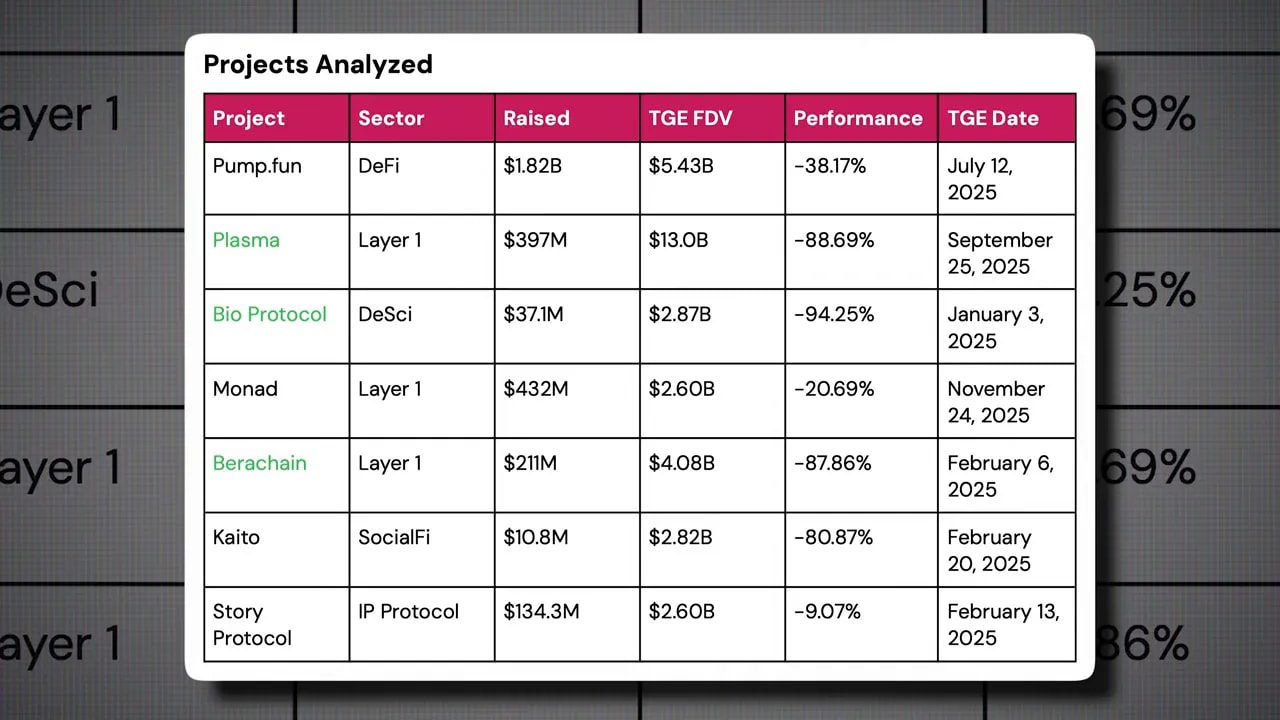
The report tracked seven major TGEs — BioProtocol, Berrechain, Plasma, Kito, Pump.Fund, Story Protocol and Monad. Combined they launched with a market cap of $9.3 billion after raising $3 billion, but all seven plunged in 2025, averaging losses above 60%. Many had lofty FDVs at launch and an avalanche of tokens scheduled to unlock, which magnified selling pressure.
FDV, or fully diluted valuation, is what a project would be worth if all tokens were circulating today. Extreme FDV multiples — when a project launches with a multi-billion dollar FDV after raising only a few million — are a red flag. The market punishes unrealistic valuations quickly.
Examples worth remembering
- Quito raised $10 million but launched at a $2.8 billion valuation — a 261x FDV multiple — and fell roughly 80%.
- BioProtocol raised $37 million, launched at a $2.8 billion FDV (77x) and collapsed 94%.
- Plasma and Berra Chain had similar trajectories — huge multiple launches and near-total losses.
- Pump.Fund raised $1.8 billion but launched at a modest 3x FDV and only fell 38% — still painful, but relatively resilient.
- Story Protocol was the outlier: despite a 19x FDV multiple, it only fell about 9% thanks to strong underlying product quality.
Takeaway: the relationship between capital raised and FDV matters. If a small raise backs a huge FDV, the market can quickly reprice expectations. Also watch unlock schedules. Over half a billion dollars of tokens from those seven TGEs are set to unlock in 2026, creating ongoing supply pressure.
For traders and investors, this is where a research edge can be profitable. A signals service that tracks TGEs, FDV ratios, and unlock calendars can surface asymmetric opportunities: avoid high-FDV launches without on-chain usage or revenue, and watch for projects where strong fundamentals justify the valuation.
Major Tokenomics Redesigns: Smoothing, Delaying, and Retargeting Supply
Mature projects began to change token rules in 2025. These were not marketing tweaks but structural moves meant to smooth supply flow and align incentives with long-term growth.
Examples:
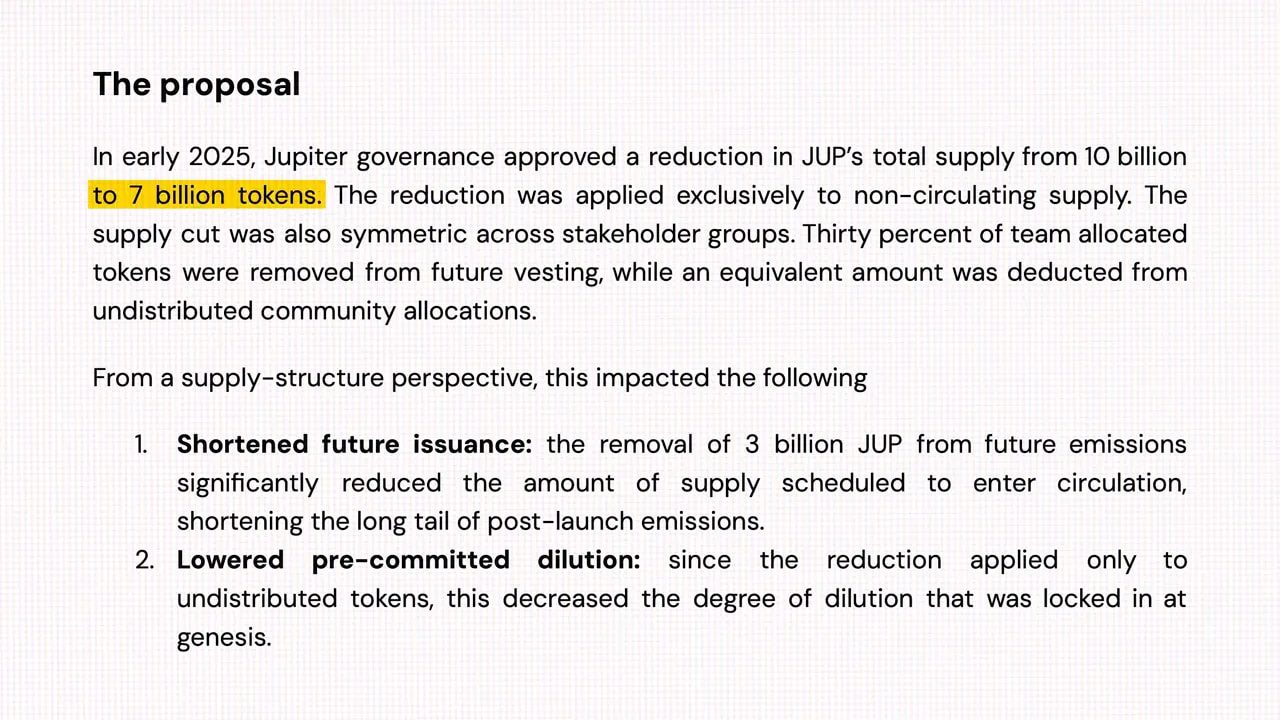
- Jupiter (Jupe) originally had a fixed supply and a clear split between community and team allocations. In early 2025, governance trimmed non-circulating supply by 30%, preventing 3 billion tokens from ever entering circulation, and moved future community airdrops under governance control.
- Wormhole (W token) redesigned vesting. Annual cliffs that produced massive unlocks were smoothed into bi-weekly releases for most allocations. Investor and validator vesting was pushed out, with final unlocks now scheduled for 2028. The amount of tokens didn’t change, but the rhythm of supply entering markets did.
- Solana reduced emissions — its inflation schedule was structured to lead to lower yearly issuance, making staking more attractive and arguably improving long-term token dynamics for validators and holders.
These changes matter because they show projects acting on data rather than assumptions. Smoothing vesting schedules reduces the risk of periodic dumping events and gives markets a clearer line of sight into supply growth. Delaying vesting can align team and investor incentives with product milestones rather than near-term liquidity events.
Yet inflationary issuance remains a double-edged sword. It can incentivize validators, bootstrap ecosystems, and reward contributors. On the flip side, persistent issuance dilutes holders and can depress price if not matched by usage growth or revenue capture.
Unlocks and Dilution: When Supply Increases Bite
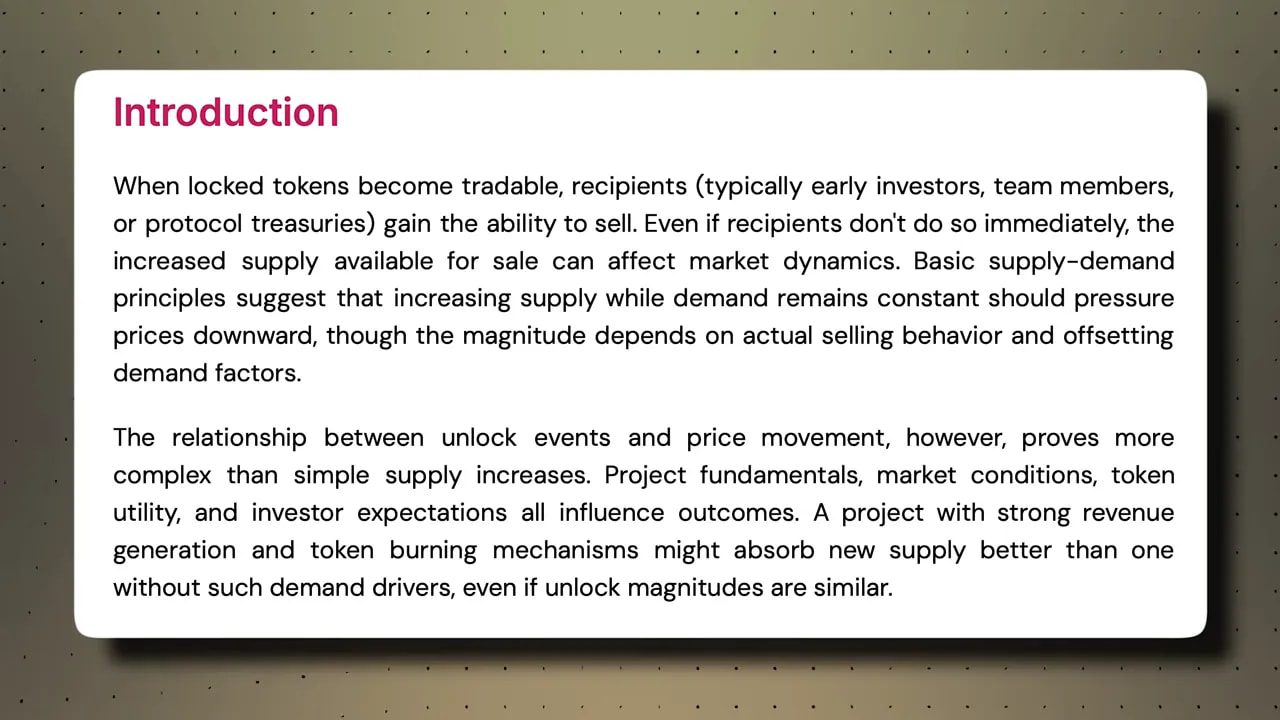
Unlock events dominated price action in many altcoins. Basic economics is simple: if supply rises and demand does not, price tends to fall. But reality is nuanced. A token’s utility, revenue, burn mechanisms, and market conditions all interact with unlocks to produce outcomes that can range from big pumps to utter destruction.
The report tracked large unlocks across ten projects with unlock sizes from $584 million to $2.3 billion. The largest was Whitebit: $2.3 billion in WBT unlocked, increasing supply by 15%. Nevertheless WBT rallied 136% because the token has strong exchange revenue, utility and burn mechanics. It was the only tracked token to register gains despite a major unlock.
Contrast that with Athena, which unlocked $1 billion of ENA tokens and saw supply grow 140% in 2025 — ENA dropped 73%. Ondo unlocked $860 million and grew supply 134%, sliding 67% in price. Even Dogecoin saw significant downward pressure with a modest 3% increase in supply, falling 52% as market sentiment soured.
WorldCoin suffered a huge hit: $1.1 billion unlocked and supply swelled by 76%, sending its price down 71%.
Some projects faced catastrophic dilution. Ten projects had supply increases between 231% and 858%. All of them experienced declines of at least 66%; several went to zero.
Panic selling often worsens unlocks
Unlocks are often preceded by price declines as existing holders panic-sell to front-run the event. Ironically, their selling creates the very downward pressure they feared, turning potential nothing-burgers into significant events. Not all unlocked tokens are immediately sold into the market — many become staking rewards, ecosystem incentives or treasury reserves. The market’s collective fear and pre-emptive selling often do most of the damage.
Key unlock dates to watch in 2026 include:
- WhiteBit — 81 million WBT unlocking on March 13, boosting supply by ~27%
- Pump.fun — 82 billion PUMP unlocking on July 12, inflating supply by ~19%
- Arbitrum — 92 million ARB unlocking on February 16 (~1.8% supply growth)
- Sui — 43 million SUI unlocking on March 1 (~1.1% growth)
- Athena — 171 million ENA unlocking on March 5 (~2.2% growth)
Most of these are minor relative to total supply, but large unlocks deserve attention. A good practice is to monitor unlock calendars, study how tokens have been used post-unlock historically, and check whether the project has built burn mechanisms or revenue-sharing to absorb additional supply.
For active traders, being notified of large upcoming unlocks and the distribution beneficiaries can be critical. A reliable cryptocurrency trading signals offering will include unlock alerts, suggested risk sizing, and context — because front-running an unlock without full context is risky.
Tokenomics 2.0: What Maturity Looks Like
One clear theme emerges from the data: project maturity. Projects that treated tokenomics as a continuous management problem rather than a launch checklist performed better or at least preserved value. Analysts call this trend Tokenomics 2.0 — a shift from speculative issuance models to pragmatic, revenue-driven, and governance-aware designs.
Key features of tokenomics 2.0 include:
- Revenue allocation to holders — airdrops, staking rewards, or automatic revenue burns that directly return value to token holders.
- Programmatic, predictable emissions — smoothing vesting schedules and creating automated burn or buyback algorithms.
- Governance accountability — community votes on emission changes, burn size, and treasury deployment rather than unilateral team control.
- Transparency of funding sources — clear reporting on whether buybacks are revenue-funded or treasury-funded and how repurchased tokens are used.
These features reduce uncertainty, increase investor confidence, and align on-chain incentives with long-term network health. They do not guarantee price appreciation, but they reduce tail risk and make valuation more defensible.
How to Factor Tokenomics into Your Research: A Practical Checklist
Assessing tokenomics can feel complex, but it becomes manageable with a checklist. Use this framework before considering any investment:
- Supply and issuance schedule — Total supply, circulating supply, and future emissions. Look for cliffs, linear vesting, and zero-supply surprises.
- Unlock calendar — Who gets unlocked tokens and when? Large allocations to insiders shortly after launch is a red flag.
- Funding and treasury composition — How much fiat or stablecoin does the treasury hold? Is the treasury diversified or concentrated in volatile assets?
- Buyback funding source — Are buybacks funded by protocol revenue or one-off treasury sales? Revenue-funded buybacks are more sustainable.
- Burn mechanics — Programmatic burns tied to usage or revenue are preferable. Governance burns add transparency but can be reversed.
- Emissions vs buybacks — Calculate net issuance. A buyback that is smaller than ongoing emissions is often meaningless.
- Use cases and token utility — Is the token needed for the protocol (fee payment, governance, staking) or purely speculative?
- Governance power and decentralization — Who controls changes to tokenomics? Centralized control increases execution risk.
- FDV vs capital raised — Compare funds raised with launch FDV. Huge gaps often point to unrealistic expectations.
- Historical on-chain behavior — Past selling events, team transfers, and how the token reacted to previous unlocks.
Combining on-chain data with qualitative analysis of the team and product roadmap gives the best picture. If you’re actively trading, consider alerts for the metrics above; they are often the earliest hints of upcoming moves.
Case Studies: Applying the Checklist
Two short examples to illustrate how tokenomics analysis changes decisions:
- OKB — High buybacks funded by exchange revenue, near-total burns, and meaningful deflation. Result: strong price response and an improved narrative for holders. Tokenomics here directly tied to the exchange’s revenue engine.
- Athena (ENA) — Massive unlocks without offsetting revenue or burns, leading to a 73% drop. A straightforward case where supply shock overwhelmed any speculative demand.
These contrasting outcomes show why the source of buybacks, the destination of repurchased tokens, and overall emissions dynamics determine whether supply-side actions produce value or value destruction.
What to Watch in 2026
Expect tokenomics to keep evolving. The following trends will likely shape altcoin performance:
- Programmatic revenue-sharing and burns will become a baseline expectation for quality projects.
- More governance-driven supply changes as communities mature and demand accountability.
- Heightened regulatory attention on revenue-funded buybacks as they look more like traditional corporate buybacks.
- Increased focus on FDV sanity checks from both retail and institutional allocators.
- Tools and services to monitor unlocks and buybacks — both necessary for proactive risk management.
Active traders and allocators who subscribe to a reliable signals service that tracks these tokenomic events — including buybacks, burns, and unlocks — will likely have an information edge. Such services can highlight where value is being created versus where supply will be dumped, helping you size and time trades more effectively.
Final Thoughts: Tokenomics Decides the Odds
Technical innovation, community, and marketing remain important, but tokenomics is now a primary gating factor. A beautifully engineered protocol with misaligned supply dynamics is a fragile investment. Conversely, a project with modest tech but prudent, data-driven tokenomics can survive and compound value over time.
Think of tokenomics as the financial plumbing of a project. You wouldn’t buy a house without checking the pipes. Same logic applies to tokens.
FAQ
What exactly is a token buyback and why does it matter?
A token buyback is when a protocol repurchases its own token using revenue or treasury funds. It matters because repurchases reduce circulating supply or allow the protocol to control token distribution. The effectiveness depends on the funding source and whether the tokens are burned or held in treasury. Revenue-funded buybacks that are burned are the most powerful since they scale with usage and permanently reduce supply.
How do token burns affect price long-term?
Burns reduce supply which, all else equal, should support price. However, their long-term effectiveness depends on consistency, scale relative to emissions, and whether burns are offset by new issuance. One-off burns can create temporary rallies; programmatic, ongoing burns tied to revenue create durable value capture.
What is FDV and why should I care?
FDV stands for fully diluted valuation — the market cap if all tokens were circulating. High FDV relative to funds raised or current usage implies the token’s price needs large future adoption to justify the valuation. Extremely high FDVs at launch often precede severe re-pricing.
How do unlocks usually impact price?
Unlocks increase circulating supply which can depress price. However, the actual impact depends on who receives unlocked tokens (team vs community), whether tokens are sold, and whether the project has mechanisms (burns, revenue sinks) to absorb added supply. Panic-selling ahead of unlocks often causes more damage than the unlock itself.
Are buybacks manipulative or legitimate?
Buybacks are a tool. Revenue-funded, transparent buybacks that are part of a long-term strategy are legitimate ways to return value to token holders. Treasury-funded buybacks used purely to chase price can look manipulative. Transparency about funding sources and token destinations matters ethically and practically.
Should I use a trading signals service for tokenomics events?
A quality signals service can help by alerting you to buybacks, burns, unlocks, and major governance votes, giving you time to analyze or react. Look for services that provide context, not just alerts — e.g., who benefits from an unlock, whether buybacks are revenue-funded, and the presence of offsetting emissions.
Closing
Tokenomics drove much of crypto’s narrative in 2025. The headline numbers — billions in buybacks, massive burns, and enormous unlocks — get attention, but the structural mechanics behind them determine winners and losers. Look beyond headlines: understand funding sources, emission math, and the rhythm of supply flow. Those who do will trade (and invest) better. Those who don’t may be surprised by how quickly a shiny token loses value.
If you want timely alerts about buybacks, burns, unlocks, and other tokenomic catalysts, consider adding a curated cryptocurrency trading signals service to your toolkit. Signals that include on-chain context and treasury insights can help you spot opportunities and avoid traps driven by supply shocks.
Tokenomics 2.0 is here. Learn it, track it, and make it part of every trade and investment decision.
