

Table of Contents
- Outline
- What a divergence is and why it matters
- Which indicators produce divergences
- How I quantified divergences for backtesting
- Backtest metrics to know
- Key results
- What these results mean
- Applying divergences to crypto trading
- How to use divergences in a real trading plan
- Common mistakes to avoid
- Final thoughts
- Frequently asked questions
Outline
- What a divergence is and why it matters
- Which indicators can generate divergences
- How divergences were quantified and backtested
- Key results and what they mean
- Practical ways to use divergences across markets, including crypto
- FAQ
What a divergence is and why it matters
A divergence happens when price moves one way and a momentum indicator moves the opposite way. For example, price may make higher highs while the RSI makes lower highs. That mismatch tells you momentum is out of phase with price and usually signals the market is losing conviction. That loss of momentum often precedes a reversal or a strong retracement.
Divergences work primarily with momentum indicators. When price swings but the oscillator does not confirm the move, momentum is fading. That simple concept is powerful enough that traders have used divergences to anticipate major turns — from the COVID-19 bounce to large S&P 500 corrections.
Which indicators produce divergences
There is no single “best” momentum indicator for divergences. Common choices include:
- RSI — price-based, very popular for stocks
- Stochastics and CCI — often used in commodity and futures trading
- MACD — widely used and gives different divergence signals than RSI
- Volume-based oscillators like On Balance Volume or Money Flow Index
Different indicators will produce different divergence signals. The only way to determine what works best for your market is to backtest. RSI may shine on equities, while CCI or stochastics could beat it on commodities. The same applies across timeframes.
How I quantified divergences for backtesting
Translating the visual idea of a divergence into a rule a computer can follow is the hardest part. Here is a simple, robust way to quantify a bullish divergence that was used for testing:
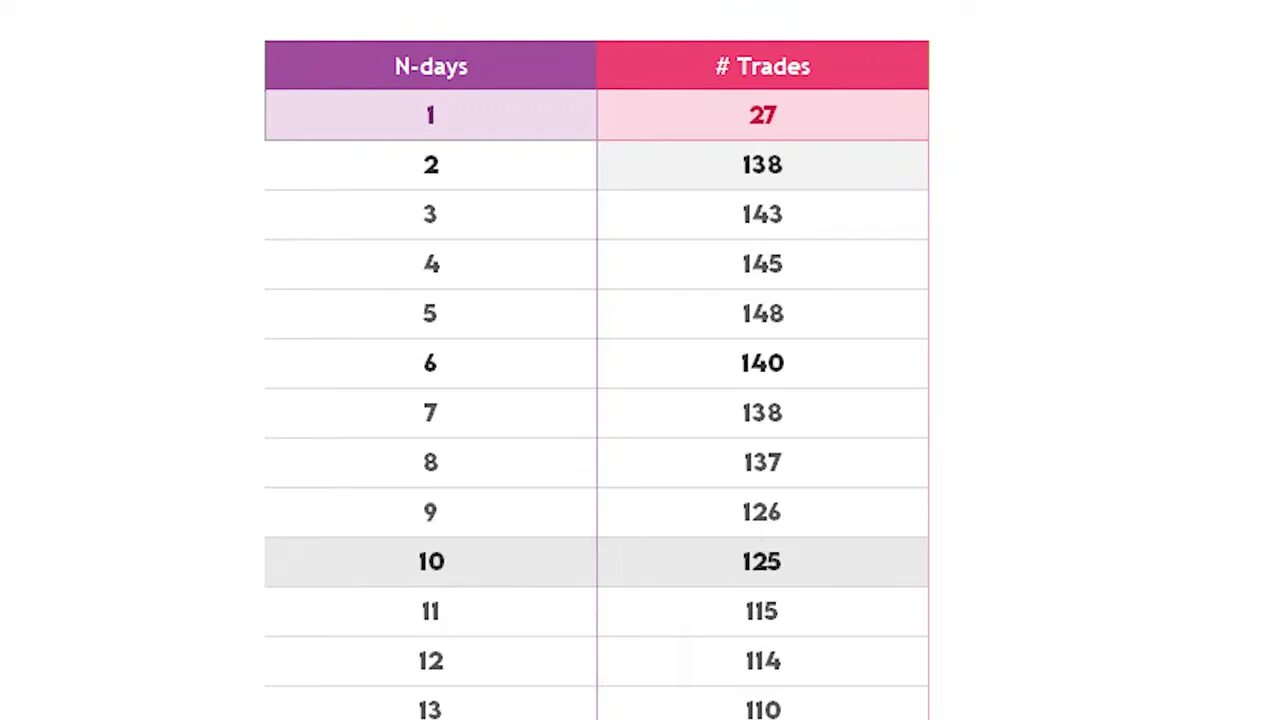
- The close sets a new N-day low.
- The RSI does not set a new low within the same N-day window.
- Exit is at the close on the next bar (mean-reversion exit).
N was tested from 1 to 30 days to see how short-term versus longer-term divergences performed. This method focuses on cases where price makes a fresh low while the momentum indicator fails to confirm the low — a classic bullish divergence setup.
Backtest metrics to know
The backtest used several standard metrics to evaluate effectiveness:
- Profit factor — gross profit divided by gross loss. Values above 1 indicate a profitable system; 1.75 is a strong target.
- Sharpe ratio — return adjusted for volatility. Higher is better.
- Win rate — percent of trades that closed profitable.
- Average return per trade — how much each signal returned on average.
Key results
Testing divergences on the S&P 500 ETF (SPY) produced several noteworthy outcomes:
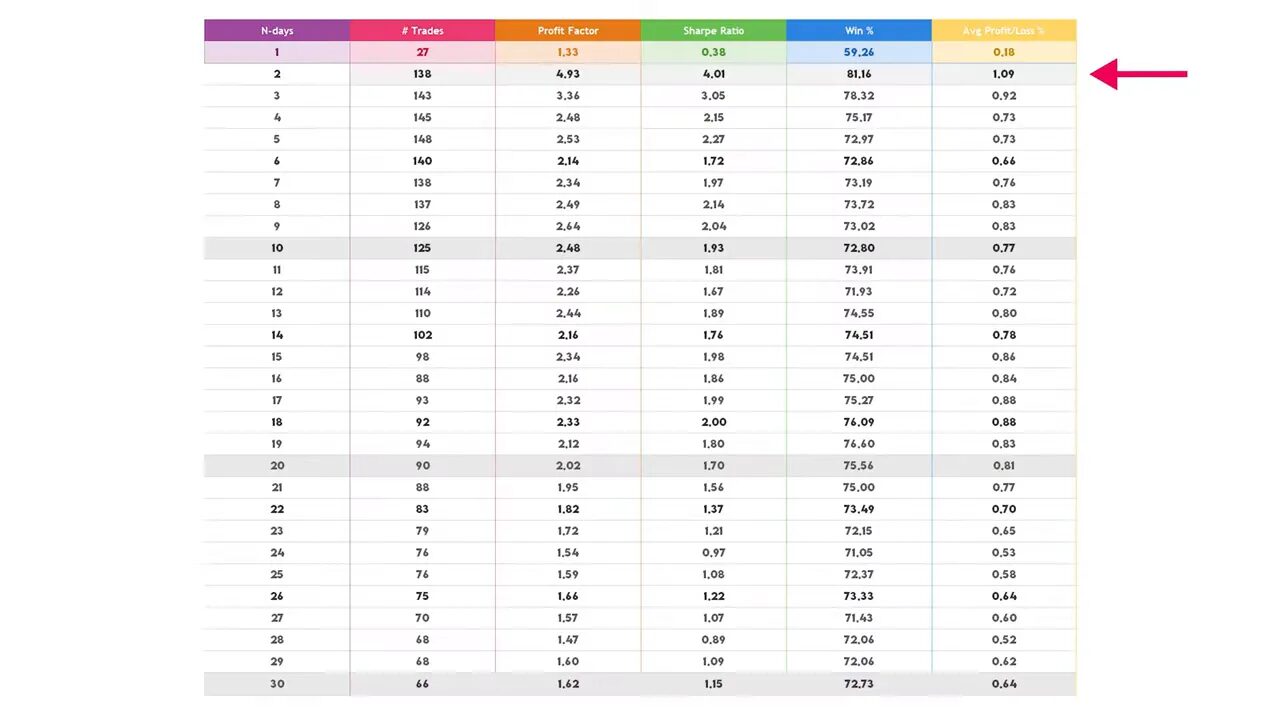
- Divergences were correct a very high percentage of the time. Short-term divergences (two-day setups) had the highest win rates — over 80% in the tests.
- Profit factor and Sharpe favored short windows. The two-day divergence posted a profit factor near 4.9 and a Sharpe around 4.0, which is exceptionally strong.
- Average profit per trade was modest. The best average return was roughly 1.09% per two-day divergence trade. In plain terms, signals were accurate frequently but individually small in return when using a simple mean-reversion exit.
- No tested divergence window produced an average losing trade using the simple rules above — a sign that the concept is directionally sound, even if exits need work.
What these results mean
The core takeaway is that divergences are a reliable signal that momentum is shifting. They tell you “something is wrong” with the current price move and often flag reversals or retracements early. That said, raw divergence signals are not a complete trading system by themselves.
The backtest used a naive exit (sell at the close), which explains why average returns were modest. The divergence idea appears correct, but profit taking and trade management need to be optimized. Combining divergences with price action, support and resistance, trend lines, volume profile, and level two data can convert a high-probability signal into a profitable strategy with larger average returns.
Applying divergences to crypto trading
Cryptocurrency markets are volatile and often exhibit strong, rapid momentum swings. Divergences can be particularly useful for spotting early exhaustion in an uptrend or downtrend across different blockchains and tokens. Because crypto moves fast, short-term divergences (1 to 5 days or intraday equivalents) tend to produce the most actionable signals.
A practical approach: pair divergence signals on your preferred oscillator with confirmation from on-chain metrics or order flow. For traders who prefer a quicker route to tradeable setups, using a reliable service like cryptocurrency trading signals can help surface high-probability divergence setups across major blockchains. These signals can be used as an additional layer of screening before committing capital.
How to use divergences in a real trading plan
Here are practical ways to turn divergence signals into a working edge:
- Choose and backtest one momentum indicator for the market you trade. Stick to it long enough to gather meaningful statistics.
- Filter divergence signals with price action. For bullish divergences, look for support zones, bullish candles, or trendline touches. For bearish, combine with resistance or prior highs.
- Use multiple timeframes. A divergence on a higher timeframe has more weight, while intraday divergences can be used for scalps.
- Improve exits. Try fixed targets, trailing stops, or confluence-based exits (structure break, moving average cross, or a second indicator confirmation) rather than an automatic close the next bar.
- Size for expectancy. High win rate with small average returns can still be profitable — but position sizing and risk management must match the edge.
Common mistakes to avoid
- Over-optimizing on one historical period without forward testing.
- Ignoring the choice of indicator. Different oscillators tell different stories.
- Using divergences in isolation. They are powerful signals but perform best when combined with other technical context.
- Assuming a divergence always leads to a full trend reversal. Often it produces a retracement only.
Final thoughts
Divergences are a legit tool in the trader’s toolbox. They show loss of momentum and predict reversals or retracements frequently. The edge comes from consistent rules, market-specific backtesting, and thoughtful trade management. With the right filters and exits, divergences can be a high-probability component of a broader trading strategy across stocks, futures, and crypto.
Frequently asked questions
Do divergences actually make money?
Divergences have a high probability of being directionally correct, but raw signals often produce modest average returns. They can make money when combined with sound trade management, exits, and additional filters like price structure or volume confirmation.
Which indicator should I use for divergences?
There is no universal best indicator. RSI is popular for stocks, MACD is common for trend analysis, and stochastics or CCI may work better for commodities. Backtest each indicator on the specific market and timeframe you trade to find what performs best.
How should I exit divergence trades?
Avoid a single naive exit. Test fixed profit targets, trailing stops, exits at structural breaks, or multi-indicator confirmations. The backtest results suggest exits are the weakest link — improving them increases average trade size and overall system returns.
Are divergences useful for crypto trading?
Yes. Crypto’s volatility often creates frequent divergence opportunities. Short-term divergences are useful for quick setups, while higher-timeframe divergences signal more significant exhaustion. Pairing divergences with on-chain metrics, volume, and curated cryptocurrency trading signals can help identify cleaner, higher-probability trades across blockchains.
How do I start backtesting divergences?
Define a quantifiable rule for a divergence, pick a timeframe and indicator, and test across historical data. Track profit factor, Sharpe, win rate, and average return per trade. Iterate on entry and exit rules, and forward-test on unseen data before trading live.
