

Table of Contents
- Survived the Sell-Off? First, breathe.
- How bad was the move? The raw stats that matter
- 200-week SMA: Why everyone cares about this single line
- Three clear paths: The Good, The Bad, The Ugly
- Was this mechanical selling or a fund blow-up? The silver correlation angle
- Unknowns that will determine how this plays out
- Trading opportunities in volatile markets (and a practical tool)
- Action plan: what to actually do with your BTC right now
- Risk management rules that actually work
- FAQ
- Final thoughts: keep calm and stack sats
Survived the Sell-Off? First, breathe.
This week was one of those moments that leaves you staring at a chart, wondering if the world has tilted. Bitcoin dropped hard and fast. If your portfolio is still breathing, give yourself a quiet nod — you did better than a lot of people. The market served up historically oversold readings, panic-level fear-and-greed numbers, and one hell of a WTF candle.
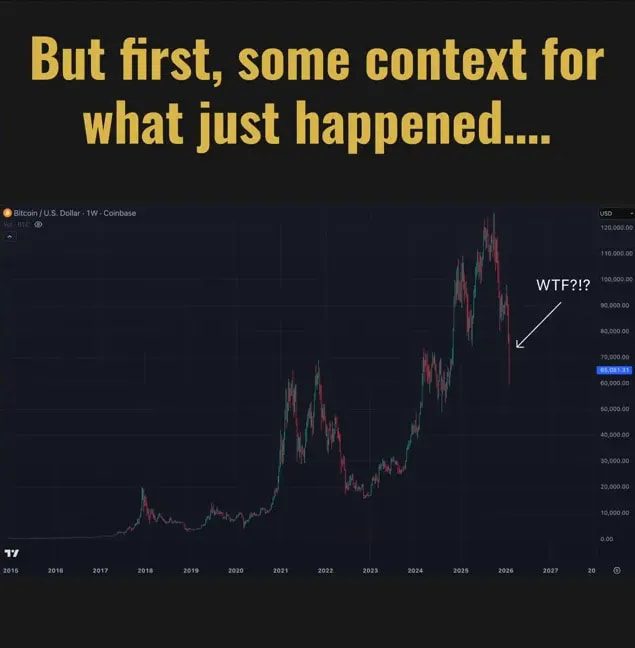
Big, mechanical selling. Record volumes. A $10,000 daily candle that will be referenced in cycle textbooks — or at least in dozens of Twitter threads. That kind of volatility tears through weak hands and forces decisions. The important thing is to treat the moment like data, not destiny.
How bad was the move? The raw stats that matter
A 24% weekly drop. A 12.6% single-day slide on the sixth — the largest daily decline since November 2022. Exchange-traded products hit record volumes (IBIT went over $10 billion, 169% above the previous daily record). The weekly Relative Strength Index (RSI) printed near the second-lowest reading in Bitcoin’s history; daily RSI matched the COVID crash.
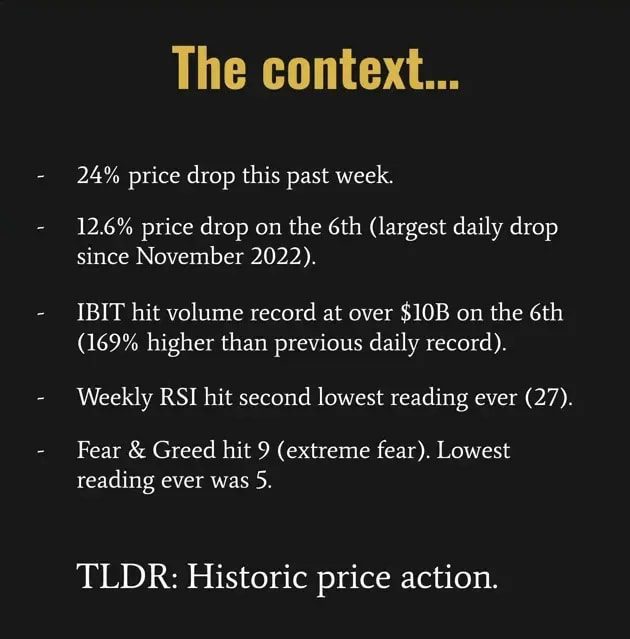
Fear and Greed bottomed out near nine — practically the panic zone. From a technical perspective, Thursday’s move was on par with the COVID crash in sheer brutality. These are not normal pullbacks. They are market structure events.
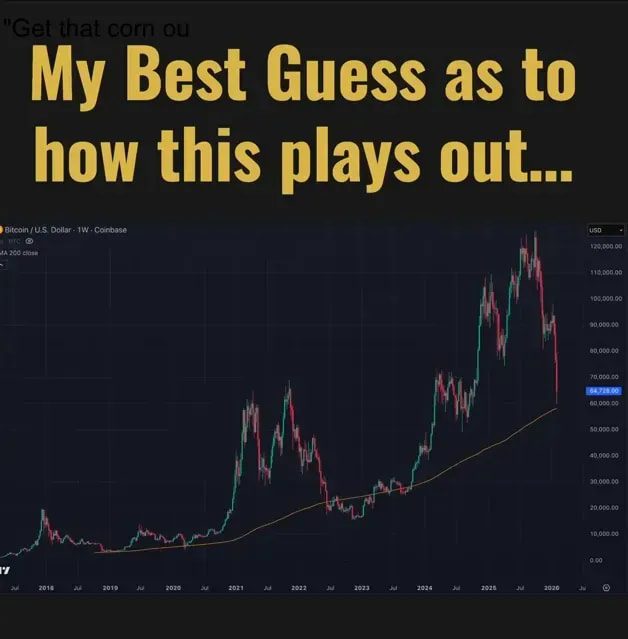
200-week SMA: Why everyone cares about this single line
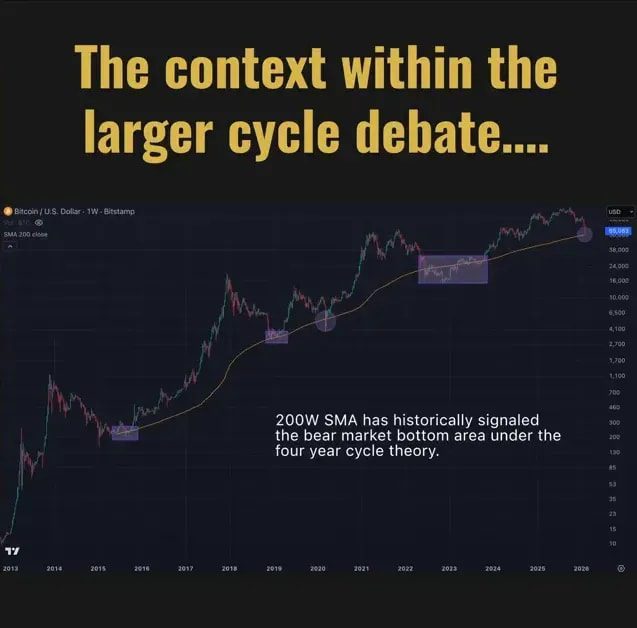
Technical traders love simple, repeatable rules. The 200-week simple moving average has become a widely watched reference for “bear market area” within the four-year cycle framework. Historically, significant bottoms have formed around that line. Sometimes price touches and consolidates there; sometimes it dips beneath briefly and recovers.
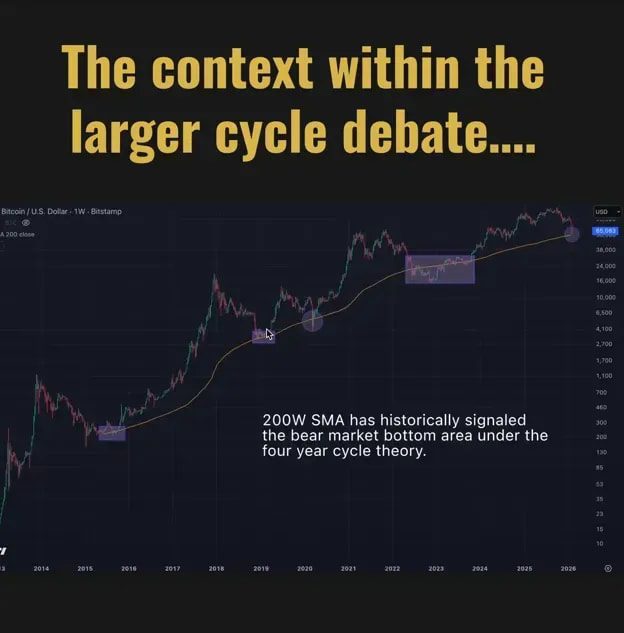
What made this move notable was the speed. Bitcoin took only 19 weeks to reach the 200-week SMA from its high — versus 51 weeks after the 2018 peak and 31 weeks after the 2022 peak. That speed can mean two very different things: either cycles are speeding up, or this is the start of an exceptionally brutal bear market.
Three clear paths: The Good, The Bad, The Ugly
When the market is chaotic, it helps to frame outcomes into scenarios. That doesn’t predict the future — it clarifies what to look for and how to act.
The Good
The optimistic case is simple: ETF buyers and institutional holders proved stickier than expected. During the collapse, Bitcoin ETFs only recorded about half a billion dollars of outflows on that wild Thursday. That’s a lot of selling, yes, but also a lot of buyers stepping in to hold the line.
Combine sticky ETF demand with historically oversold technicals and a fast retest of the 200-week SMA, and you have a textbook bottom scenario: tag the moving average, consolidate for a bit, then start the next leg up. If that happens, this violent sell-off will be the painful flush that sets the stage for a multi-year bull run. Possible? Absolutely.
The Bad
The more cautious case recognizes one hard truth: bear market bottoms usually take time. They often grind sideways or bleed lower for months. If you’re hoping for a clean V-shaped recovery like the COVID crash, you might be setting unrealistic expectations.
In this scenario, Bitcoin retests below the 200-week SMA and grinds down toward the mid-range targets around $50,000. That’s well within the realm of possibility — we already tagged near $58k–$59k. If macro risk or a broader equities drawdown accelerates, those lower targets become more likely.
The Ugly
The brutal scenario extrapolates historical bear depths. Prior bear markets saw collapses of roughly 87%, 84%, and 77%. If this cycle follows the diminishing-returns pattern and we take a roughly 73% hit from the peak, we’re looking at the low $30,000s — about $34,000.
That outcome would be ugly, but it would also be one hell of a generational buying opportunity. Buying at those prices and riding the next multi-year cycle could still return multiples, even with “diminishing returns” between peaks.
Was this mechanical selling or a fund blow-up? The silver correlation angle
One interesting thread tying this crash together is the simultaneous downturn in silver. Some traders are theorizing that a few big funds were heavily long silver and used leverage across multiple strategies, including Bitcoin positions. If those funds got margin called on silver, they might have liquidated Bitcoin to meet those calls. The correlation between silver’s drop and Bitcoin’s dump was striking.
This is a plausible narrative: mechanical liquidation events can cascade. They force sellers to find liquidity wherever it exists, and Bitcoin’s deep order books make it a prime candidate. Caveat: it remains a correlation-based theory until on-chain or institutional evidence emerges. But it helps explain the ferocity and structure of the selling.
Unknowns that will determine how this plays out
There are three variables that matter more than chart patterns right now:
- Who is selling? Are these liquidations from a handful of highly leveraged funds, or broad-based profit-taking? The answer changes the probability of further cascades.
- ETF flows. Public funds hold tens of billions in Bitcoin. Even a 10% outflow would be a market-moving event. So far ETF demand has been surprisingly resilient — that’s a bullish data point.
- Macro market health. If equities begin a deeper correction (say a 20% drop in indices), Bitcoin’s lower targets become much more likely. Crypto rarely decouples fully from the broader risk-on/risk-off environment.
There’s also a smattering of FUD — from quantum computing doomsayers to wild claims about liquidation thresholds for large buyers. Most of that chatter is noise. Businesses like the big trusts don’t operate like a leveraged retail trader that gets margin-called at a specific price.
Trading opportunities in volatile markets (and a practical tool)
Volatility equals opportunity. When markets swing this hard, there are setups on both sides: shorts, longs, hedges, and options plays. Professional traders use a mix of technical levels, liquidity profiling, and flow analysis to find edges. For retail traders, that looks like careful sizing, clear stop management, and a repeatable process.
If you want to blend long-term conviction with tactical opportunities, consider a disciplined approach that mixes dollar cost averaging for your core position and smaller, active trades around macro and technical inflection points. For people who prefer a guided approach, cryptocurrency trading signals can help highlight high-probability setups across markets — crypto, stocks, and even metals. A trusted signals service provides entry and exit levels, trade rationale, and risk sizing suggestions so you aren’t navigating these storms entirely alone.
That kind of service is not a shortcut or a guarantee; it is a practical tool that can save time, reduce emotional trading, and point you toward opportunities you might otherwise miss. Use it to augment your own research and risk rules, not replace them.
Action plan: what to actually do with your BTC right now
Here’s a pragmatic, no-nonsense playbook you can follow, inspired by long-term traders who weather multiple cycles.
- Keep the long-game allocation. If you plan to hold into the 2030s, don’t let short-term noise derail your allocation strategy. The core thesis for long-term holders hasn’t vanished overnight.
- Dollar cost average aggressively on weakness. When markets get truly disgusting, add to the stack. DCA reduces timing risk and smooths your average cost.
- Size active trades small. If you’re trading the volatility, treat it as a separate bucket with defined risk capital and position sizing rules.
- Use take-profits and stop-losses. The last thing you want is to watch gains evaporate or to be forced into panic selling.
- Secure your crypto. Cold storage for long-term holdings. Multisig and hardware wallets reduce existential risk from hacks and custodial failures.
- Prepare a buying plan for lower levels. Decide in advance how you’ll scale into lower price bands (for example, allocations at $50k, $40k, $34k). A plan beats panic.
Risk management rules that actually work
Risk management is the boring superpower. It separates survivors from martyrs.
- Never have all your eggs in one basket. Even if Bitcoin is your conviction, diversify position sizes and maintain exposure to other assets.
- Know your worst-case loss. If you can’t stomach a 50–70% drawdown, reduce position sizes now rather than getting forced into exits later.
- Maintain liquidity for opportunistic buys. Volatility creates windows — cash reserves let you act without selling at the worst prices.
- Don’t chase narratives on social media. Noise amplifies fear and greed. Base decisions on evidence and a repeatable plan.
FAQ
Where will the Bitcoin bottom be?
There is no single answer. Three plausible zones exist: a near-term bottom around the 200-week SMA if ETFbuyers hold the line; a lower-range consolidation toward $50k in a slow-bleed scenario; or a deep washout near $34k if we see a full-blown, 73% drawdown consistent with historical bear depths. Prepare for all three, but plan your allocations ahead of time.
Is this the COVID-style V-shaped recovery?
Probably not. V-shaped recoveries historically required extraordinary macro backstops or sudden resolution of major risk events. This sell-off was largely mechanical and correlated with other asset moves. A prolonged consolidation is more likely than an instant rocket back up.
Are ETFs safe? Could they get liquidated?
ETFs operate differently than levered trading accounts. Large public funds aren’t subject to the same margin liquidation mechanics as highly leveraged traders. That said, a substantial shift in investor sentiment could cause meaningful outflows, which would increase downside pressure.
Should I be trading right now or just HODL?
Both approaches can work if executed with discipline. If your horizon is multi-year, keep a core HODL position and use margin capital for tactical trades. If you prefer to trade, use strict risk rules, small sizes, and a reliable source of trade ideas and levels. Cryptocurrency trading signals can help identify short-term setups while you maintain your long-term core.
What happens if stocks crash hard?
A deep equities correction would increase the likelihood of Bitcoin testing lower targets. Crypto is still somewhat correlated with risk-on assets. Manage exposure and consider stop-loss or hedging strategies if your portfolio is concentrated in risk assets.
Final thoughts: keep calm and stack sats
Market extremes are terrifying and, simultaneously, where generational positions are made. This week’s crash was painful and historic, but neither unprecedented nor fatal to the long-term thesis for many BTC believers. Stick to a plan: secure your holdings, DCA into core positions, keep a tactical bucket for trades, and prepare to add if prices become truly compelling.
Use tools that reduce friction and emotional mistakes. A well-run cryptocurrency trading signals service can supply trade ideas, risk parameters, and timing cues so you can act calmly rather than react wildly. The worst moments create the best opportunities — if you’re prepared. Stack sats and stay chill.
The market always moves. You control how you respond.
