

Table of Contents
- Outline
- Why day trading is difficult — and why it can still pay
- Liquidity: the heartbeat of large traders
- Where to enter: supply and demand zones on the 4-hour chart
- Narrative: the third confirmation
- Example trade: how the plan was built
- Practical trading checklist
- Key lessons
- FAQ
- Final note
Outline
- Why day trading is hard (and why some still do it)
- The core idea: liquidity and how institutions use it
- Finding entries with supply and demand zones
- Adding a narrative for confirmation
- Risk management, position sizing, and an example trade
- Practical checklist and common questions
Why day trading is difficult — and why it can still pay
Day trading looks glamorous in short clips, but the reality is blunt: most people lose money. Only a small percentage of traders make consistent profits. That gap exists because profitable trading requires discipline, patience, and a repeatable edge. The edge I focus on is not about guessing price direction; it is about understanding how liquidity works and trading where institutions play.
Liquidity: the heartbeat of large traders
Big institutions trade with millions or billions of dollars. They cannot simply place orders at a single price without moving the market. Instead they hunt for liquidity — pools of buy or sell orders they can execute against. That hunting often looks like manipulation from the outside.
Typical retail behavior creates natural liquidity traps. Retail traders place stop losses just beyond obvious support or resistance. Institutions exploit that. They will push price through a support low to trigger retail stops, creating a wave of sell orders they can buy into. The move reverses once the institutions have filled their size, and price heads back the other way.
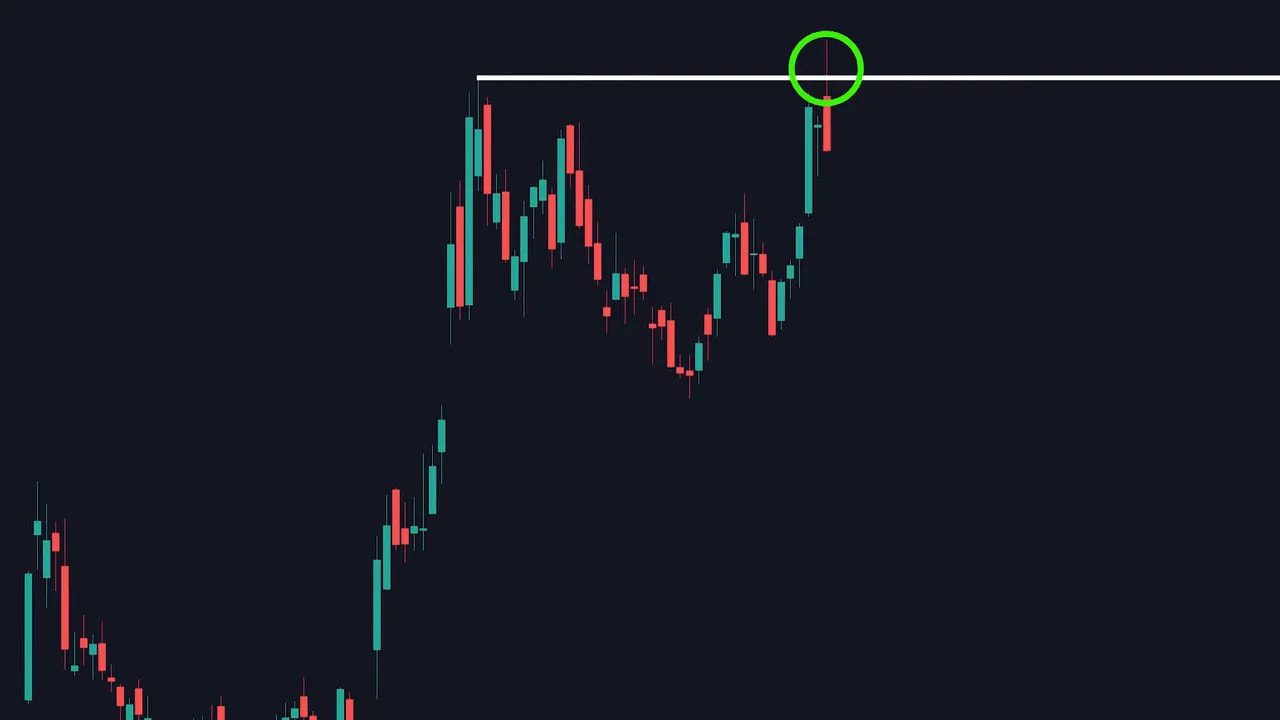
That exact process applies in reverse for buy-side liquidity. An aggressive break above an all-time high can attract buyers, pull in stops and limit orders, and leave a large liquidity pool above that high. After the liquidity event, price often reverses, leaving a clean opportunity for a short trade.
Where to enter: supply and demand zones on the 4-hour chart
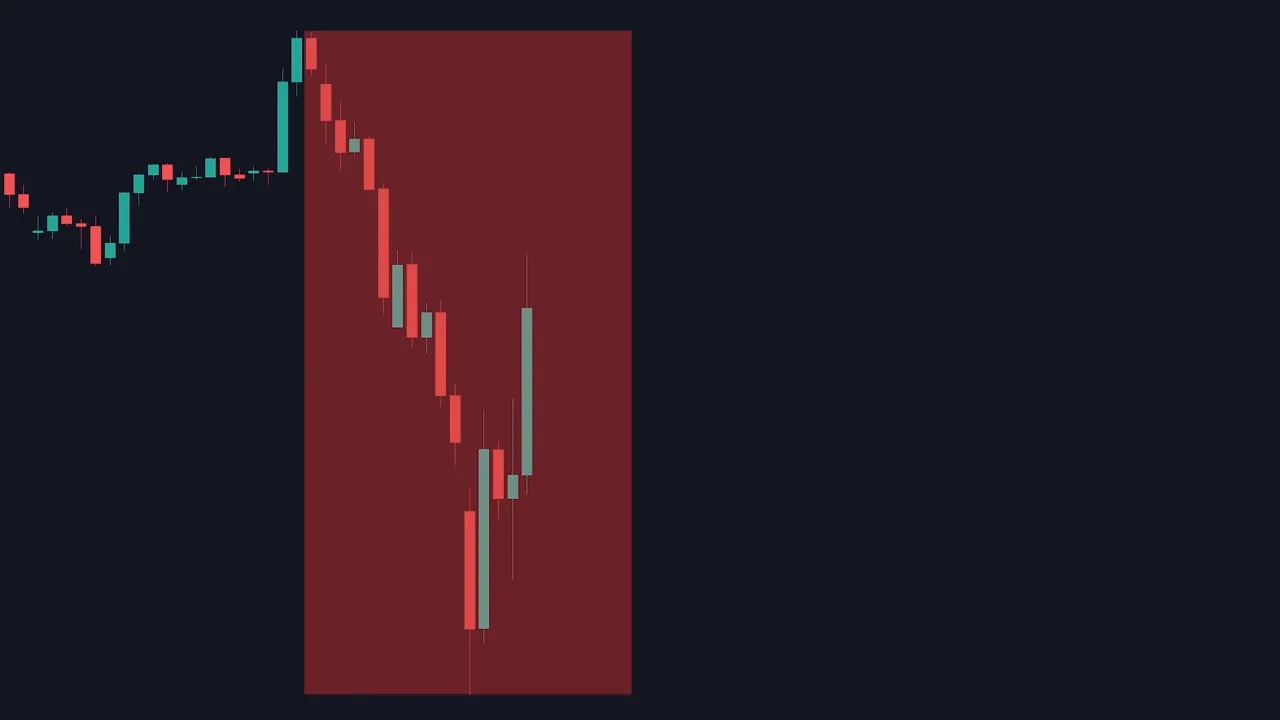
Institutions leave footprints. One reliable footprint is the candle that starts a strong directional move. On a 4-hour chart, locate the first candle that kicks off a big run up or down, then mark its low and high.
- Demand area: low-to-high of the candle that started a strong upward move.
- Supply area: low-to-high of the candle that started a strong downward move.
These rectangles are not exact lines. They are zones where institutions likely accumulated or distributed shares. Waiting for price to return to those zones offers higher-probability entries because you are buying or selling near where the big players did.
Narrative: the third confirmation
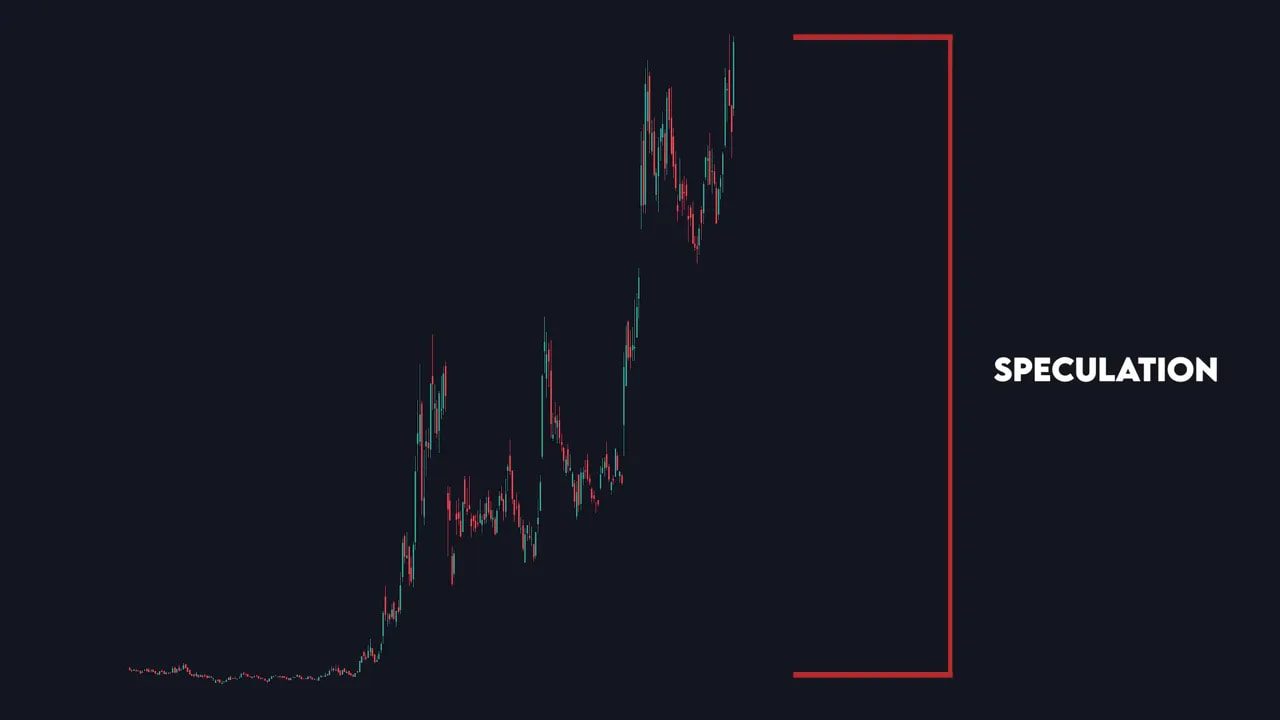
Liquidity plus a supply or demand zone forms the technical base, but a narrative gives the trade conviction. Narratives are sector momentum, hype cycles, earnings, macro tweets, or anything that favors crowd behavior. For example, speculative AI-related names can run hard on hype and correct quickly when sentiment shifts.
A trade with liquidity, a clear supply or demand zone, and a plausible narrative stacks probability in your favor. None of these guarantees success, but together they produce a coherent thesis you can size and manage.
Example trade: how the plan was built
Example setup in brief:
- Instrument showed a liquidity grab at all-time highs (buy-side liquidity).
- An area of supply was marked using the first candle that started the downward move on the 4-hour.
- A narrative (speculative AI/quantum hype) suggested buyers could panic or fade quickly.
Plan:
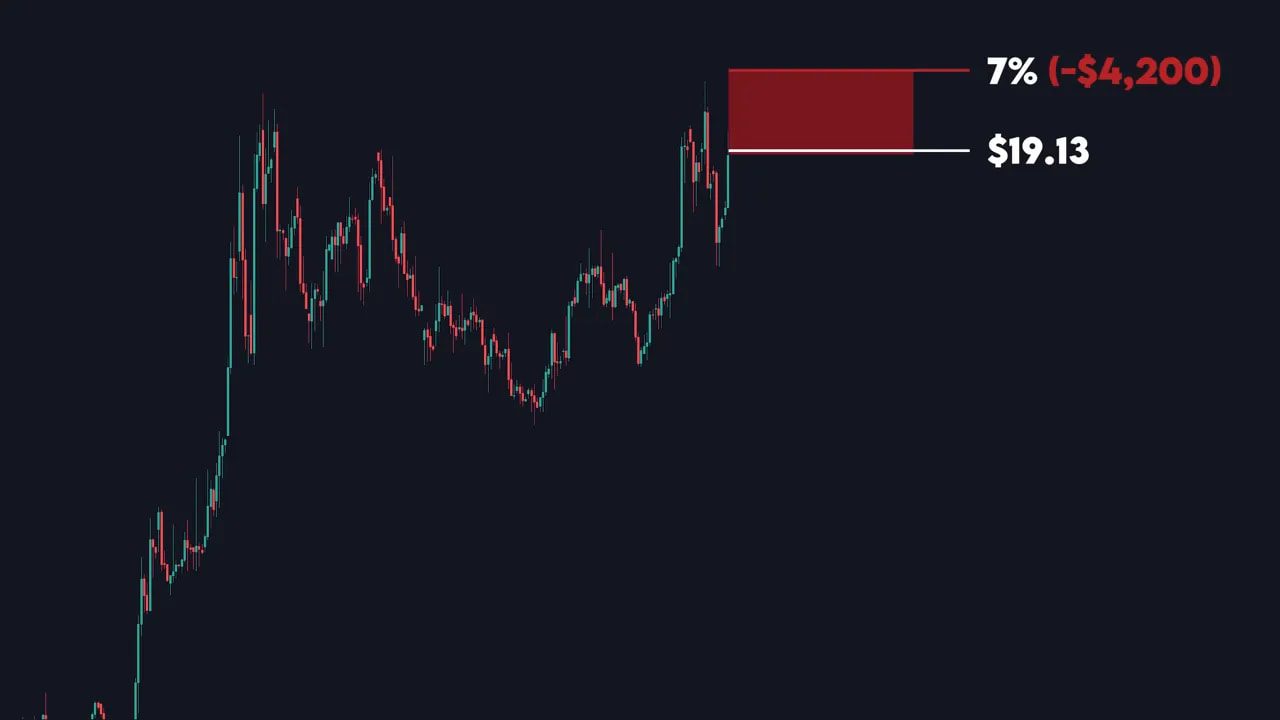
- Enter a short at $19.13 with a stop loss above recent highs.
- Position size: $60,000 notional short.
- Risk if stopped: roughly 7% or about $4,200.
- Take profits in two halves: sell 50% at the first demand zone and the remaining 50% at a lower target.
Outcome (example): the first target was hit, selling 50% produced ~24% on that half (~$7,500). If the second target hits, the total profit could reach ~27.5% on the full position (~$16,500). The point is not the exact dollar amounts. It is the disciplined framework: defined entry, defined stop, and staged exits.
Practical trading checklist
- Scan for liquidity events: breaks of all-time highs or lows, aggressive moves that leave obvious order flow footprints.
- Switch to the 4-hour chart and mark the candle that began the strong move. That area is supply or demand.
- Confirm there is a supporting narrative that could push sentiment quickly in your direction.
- Set a clear entry and a stop loss above or below the zone depending on direction. Calculate risk before entering.
- Size the position so a stop loss is an acceptable dollar loss relative to your account.
- Take profits in partials. Lock gains and let the remainder run to the next logical target.
- Record the trade, why it worked or failed, and iterate the process.
Key lessons
- Patience beats impulsiveness. Wait for price to return to the zone rather than chasing.
- Trade structure matters more than direction. Liquidity + supply/demand + narrative = higher probability.
- Risk control is the edge. Consistent sizing and defined stops prevent a single loss from wiping gains.
- Most traders are predictable. Doing the opposite of the crowd at the right time often produces opportunities.
FAQ
What exactly is liquidity in trading?
Liquidity is the availability of buy and sell orders at certain prices. Institutions look for concentrated orders (stops, limit orders) so they can execute large trades without moving the market too far. Liquidity events happen when price moves through these clusters, triggering orders and creating the flow institutions need to fill large sizes.
How do I find supply and demand zones?
Use a higher timeframe, such as the 4-hour chart. Find the very first candle that started a strong directional move and mark its low and high. That rectangle is a supply zone for a move down or a demand zone for a move up. Price often returns to those zones and reacts.
Why add a narrative? Isn’t technical analysis enough?
Technicals show where orders are likely to be; narratives explain why those orders might flood the market. Momentum, hype, earnings, macro events, or sector rotations can accelerate moves and make technical setups more likely to succeed.
How much should I risk per trade?
Risk tolerance varies by trader, but the goal is to make each loss small and manageable. Many professional traders risk 0.5 to 2% of their account per trade. Define your stop first, then size the position so the dollar loss equals that target risk.
Is shorting riskier than going long?
Shorts carry unique risks because, in theory, the price can rise indefinitely. That makes strict stops and position sizing even more important. With the right setup, shorting can be a high-probability play — especially after liquidity grabs above highs — but risk control is essential.
Final note
Trading is a probability game. You will never be right every time, but you can put the odds in your favor by understanding how big players create liquidity, by entering where institutions likely did, and by using a narrative to reinforce your thesis. Discipline, defined risk, and staged exits transform speculation into a repeatable process.
