

This article expands on that discussion, explains the fundamentals and technical factors behind my view, and delivers a practical LINK Price Prediction based on real-world adoption, oracle dominance, and market structure. If you follow crypto utility plays, this is a detailed look at why I believe LINK is significantly undervalued and why a $100+ target is realistic during the next bullish cycle.
Table of Contents
- Introduction: The Case for LINK Price Prediction
- Quick Price History and Market Metrics
- Technical Setup: What Price Action Is Telling Us
- Fundamentals Behind My LINK Price Prediction
- Key Partnerships and Real-World Adoption
- Oracle Dominance, TVS, and Number of Protocols
- How Chainlink Generates Value — Beyond the Token
- Comparative Valuation and Price Targets
- Risks & Timeline
- Practical Investment Considerations
- What to Watch Next
- FAQ — LINK Price Prediction and Common Questions
- Conclusion: Why My LINK Price Prediction Matters
Introduction: The Case for LINK Price Prediction
Let me be blunt: I’m surprised Chainlink isn’t treated like a top-5 crypto by market cap given what it actually secures and enables across DeFi and TradFi. This isn’t hype. Over the past several years Chainlink has established itself as a critical infrastructure layer — the dominant oracle network — and that dominance is reflected in metrics like total value secured, number of protocols protected, and marquee institutional relationships.
My LINK Price Prediction starts from two simple observations: (1) Chainlink is deeply embedded across DeFi and emerging TradFi tokenization workflows; and (2) price has not yet priced in the level of institutional and infrastructure adoption visible today. Put those together and the probability of a sizable bullish move is materially higher than the market currently implies.
Quick Price History and Market Metrics
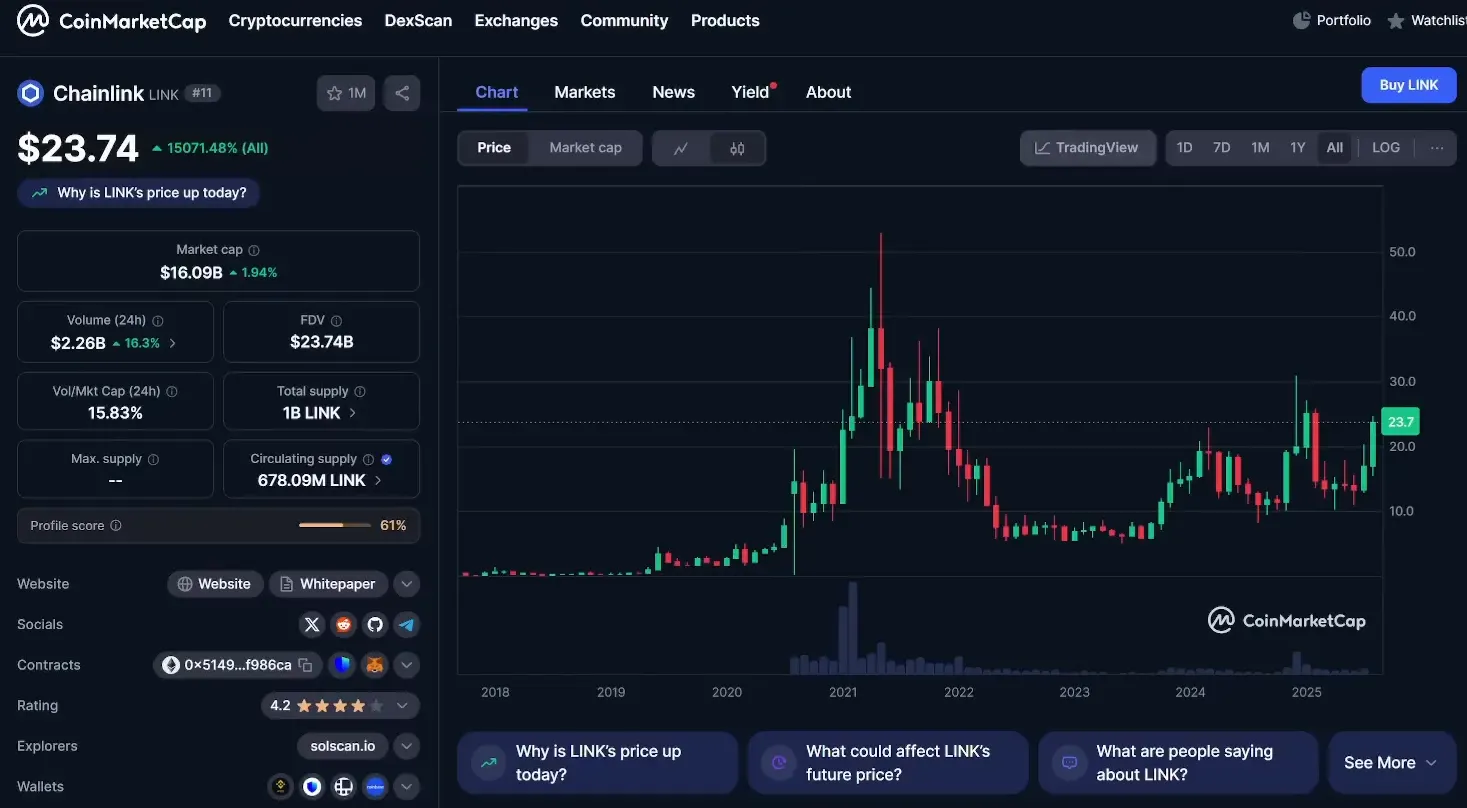
Understanding the current setup begins with context. LINK surged dramatically during DeFi summer 2020 and continued to power higher into 2021, hitting all-time highs above $50 per LINK. As of this analysis, price sits roughly half that ATH — in the low-to-mid $20s at the time I recorded. That’s a deep disconnect between fundamental adoption and price.
- Total supply: 1,000,000,000 LINK
- Circulating supply (approximate): 678,000,000 LINK
- Fully diluted valuation (FDV) at current price: ~$23.7 billion (variable over time)
- Market cap at current prices (approximate): ~$16.2 billion
From these numbers, a $100 LINK price implies a market cap in the neighborhood of tens of billions more than today — not inconceivable when you consider what LINK secures and which institutions are already building with Chainlink tech.
Technical Setup: What Price Action Is Telling Us
On the charts the short- to medium-term thesis is straightforward: LINK is breaking above the initial 2024 highs and is targeting the December 2024 highs next. There’s a clearly defined resistance zone that dates back to 2021 — a “red zone” made up of November and February 2021 highs and even September 2021 — that must be cleared decisively.
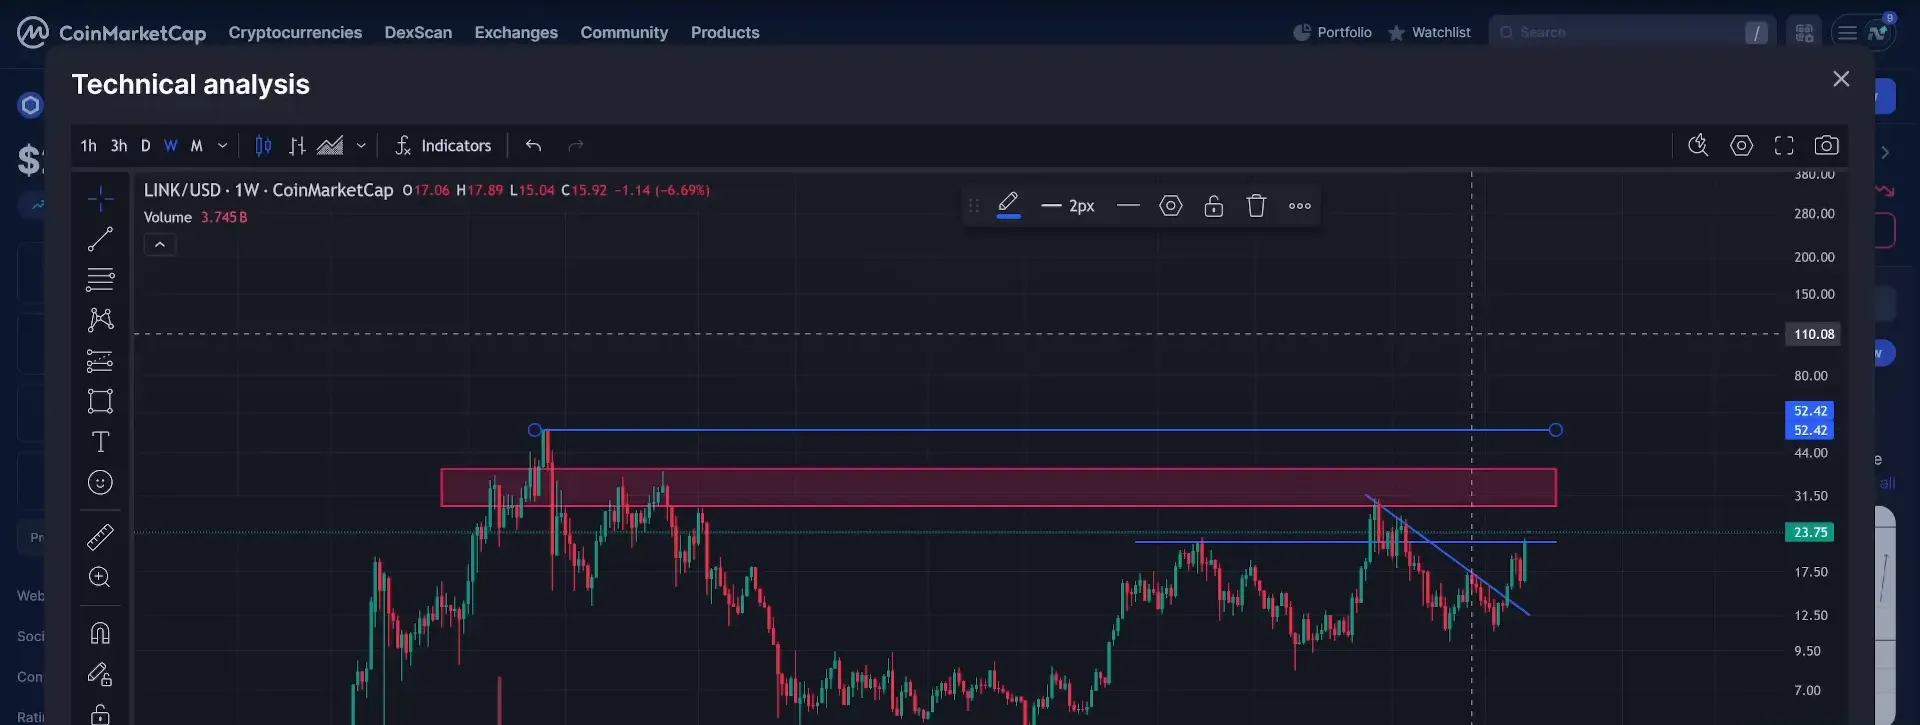
Key technical levels and outcomes I’m watching:
- Weekly close above 2024 highs: confirmation for a higher timeframe breakout.
- Clearance of 2021 red zone: once cleared, the logical target is the all-time high (~$52.50), which then opens price discovery.
- Rejection risks: a failure at the red zone can lead to consolidation or deeper pullback — discipline required.
If LINK closes weekly above those 2024 highs and then clears 2021 resistance, price discovery could push valuations aggressively toward $100 — the basis of my LINK Price Prediction. That’s not a guaranteed path, but it’s a mapped technical scenario that aligns with the fundamentals I outline below.
Fundamentals Behind My LINK Price Prediction
Technicals alone don’t drive long-term price appreciation. The fundamental picture for Chainlink is compelling and includes three pillars that underpin my LINK Price Prediction:
1. Oracle Market Dominance
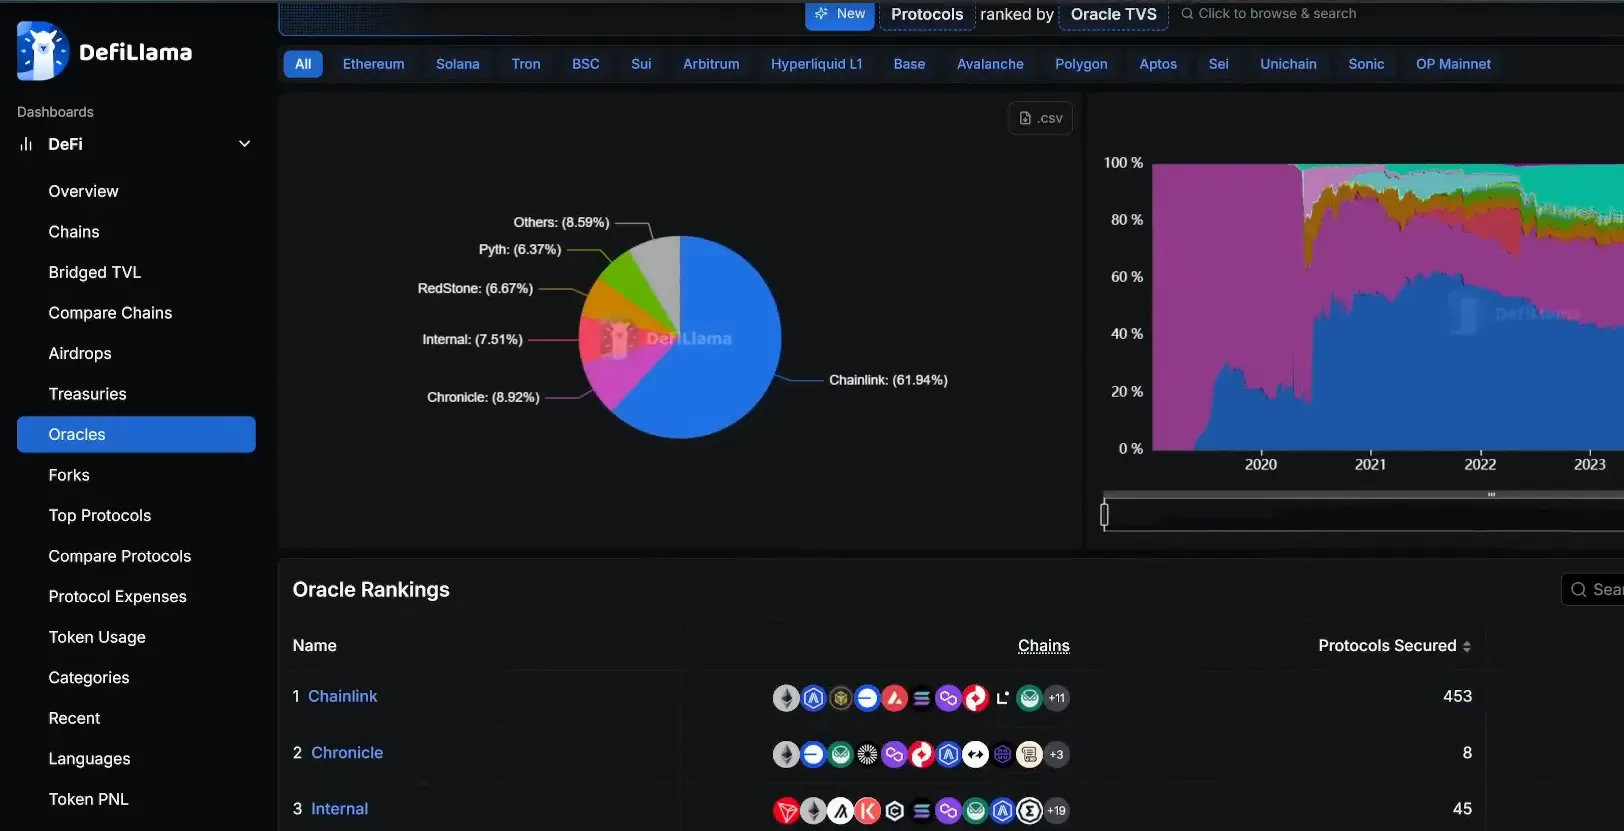
Chainlink secures a disproportionate share of value within oracle services. Recent aggregated data shows Chainlink controls roughly 62% of oracle total value secured — a dominant market share. That sort of network effect is hard for newcomers to displace quickly.
2. Massive Exposure to DeFi TVL and Protocols
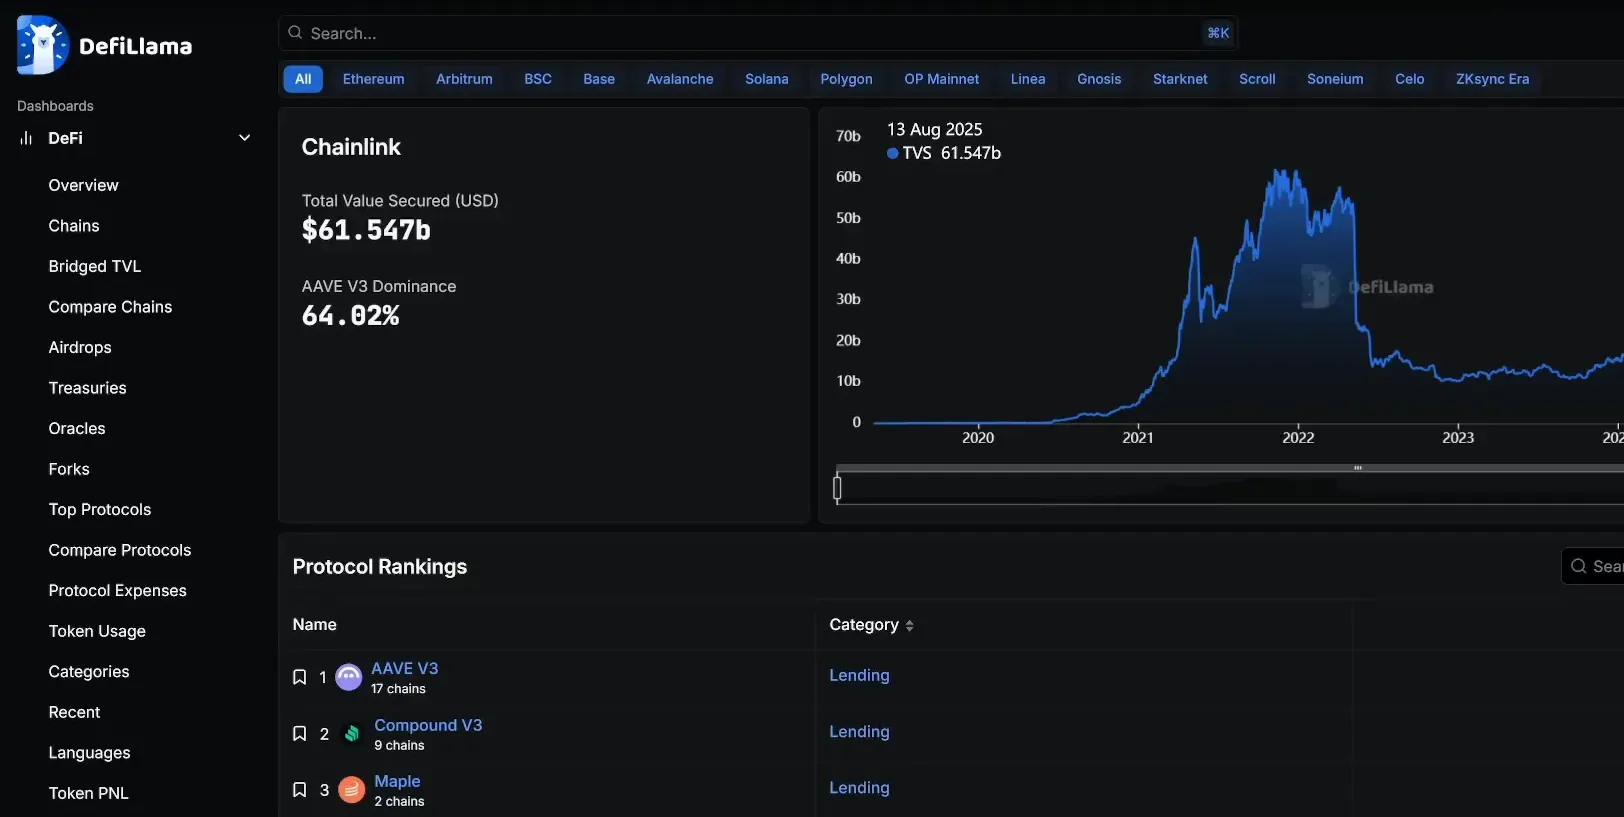
Chainlink secures tens of billions in Total Value Secured (TVS), and a very large portion of Ethereum DeFi TVL relies on Chainlink price feeds and off-chain data delivery. Examples include lending platforms, derivatives, and stablecoin issuers. One analyst snapshot indicated Chainlink secures over $60 billion total value and secures more than 80% of Ethereum DeFi in certain estimates — numbers that dwarf current market cap metrics.
3. Institutional and TradFi Partnerships
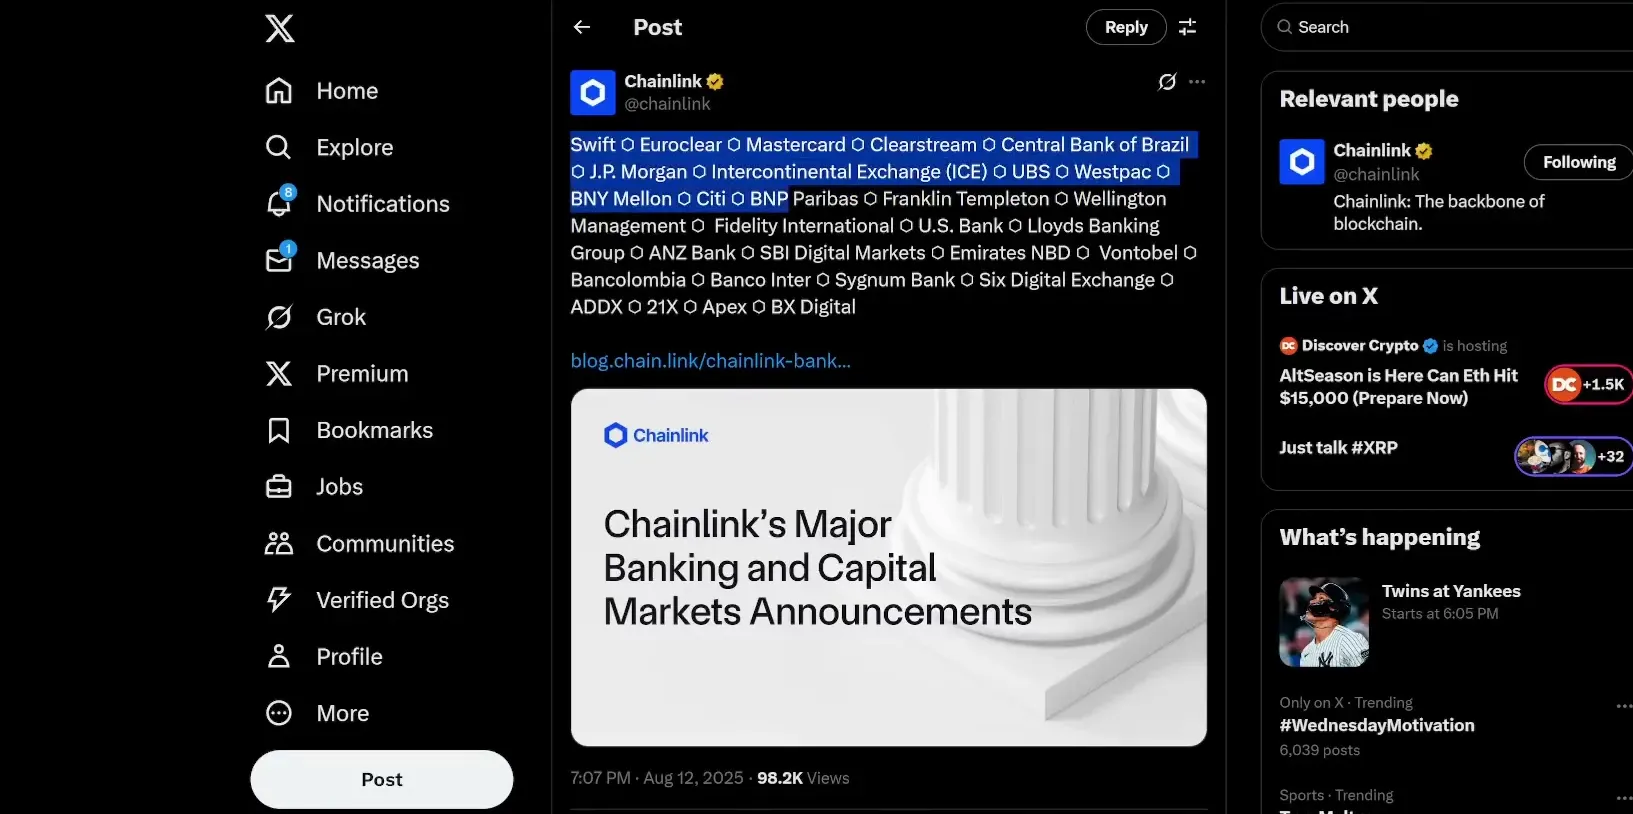
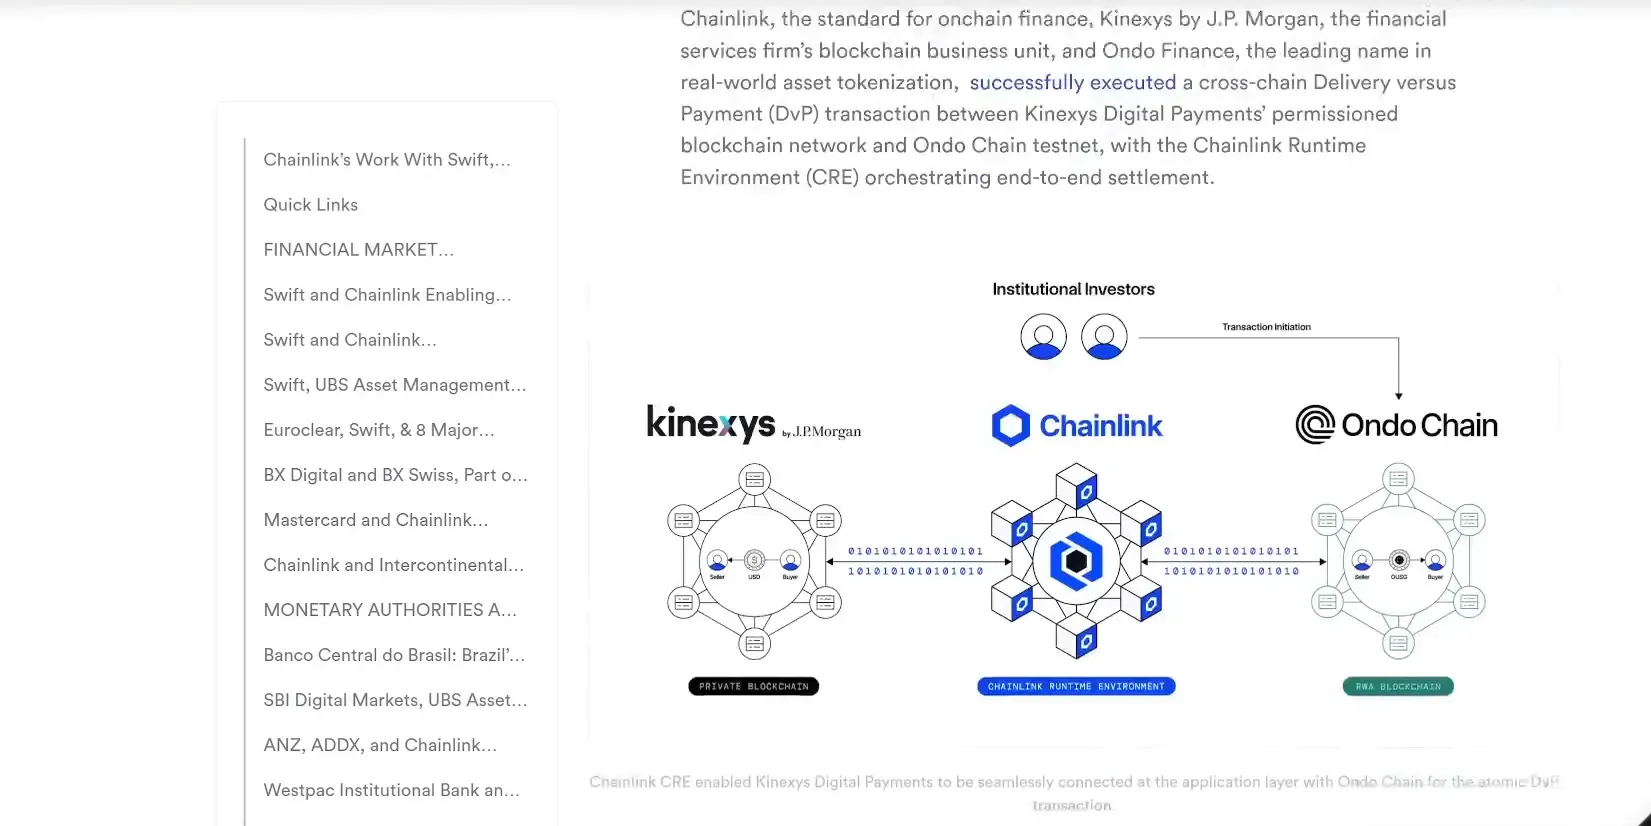
The most convincing argument to me is Chainlink’s list of institutional relationships: banks, market infrastructure firms, payment networks and major asset managers. These are not lightweight logos; they include SWIFT, Euroclear, JPMorgan, Mastercard, DTCC-related pilots, and many others. Each pilot, test, or integration is a real-world endorsement that increases the likelihood of widespread adoption and revenue opportunities.
Key Partnerships and Real-World Adoption
Partnerships are where Chainlink moves from theoretical utility to tangible infrastructure. Here’s why these relationships matter for the LINK Price Prediction.
SWIFT and Euroclear
When systemically important institutions like SWIFT and Euroclear are experimenting with Chainlink for cross-border settlement and secure on-chain data delivery, you’re looking at possible large-scale production use cases for tokenized securities and payments. SWIFT’s network reaches thousands of banks — integrating secure oracle data into that flow is huge.
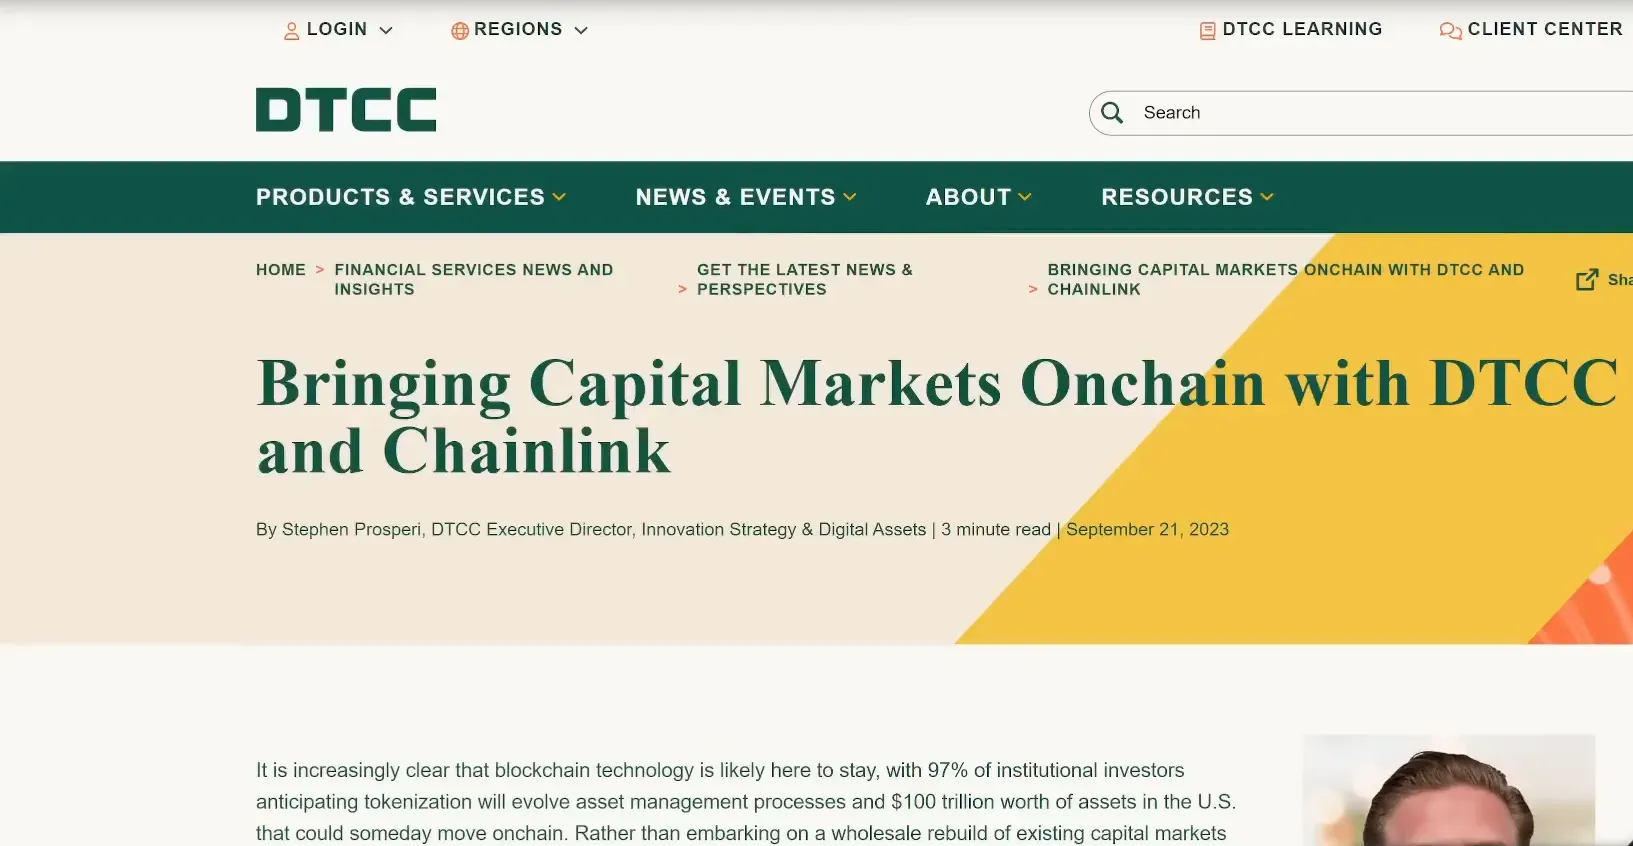
DTCC — Bridging Capital Markets and Tokenization
The DTCC settles quadrillions of dollars in securities transactions annually. Collaboration tests between Chainlink and the DTCC on tokenized assets signal early institutional acceptance of blockchain workflows for capital markets. Tokenization at scale could eventually move trillions of dollars of assets on-chain; Chainlink positioned as an oracle layer would be critical to that transition.
Mastercard and JPMorgan
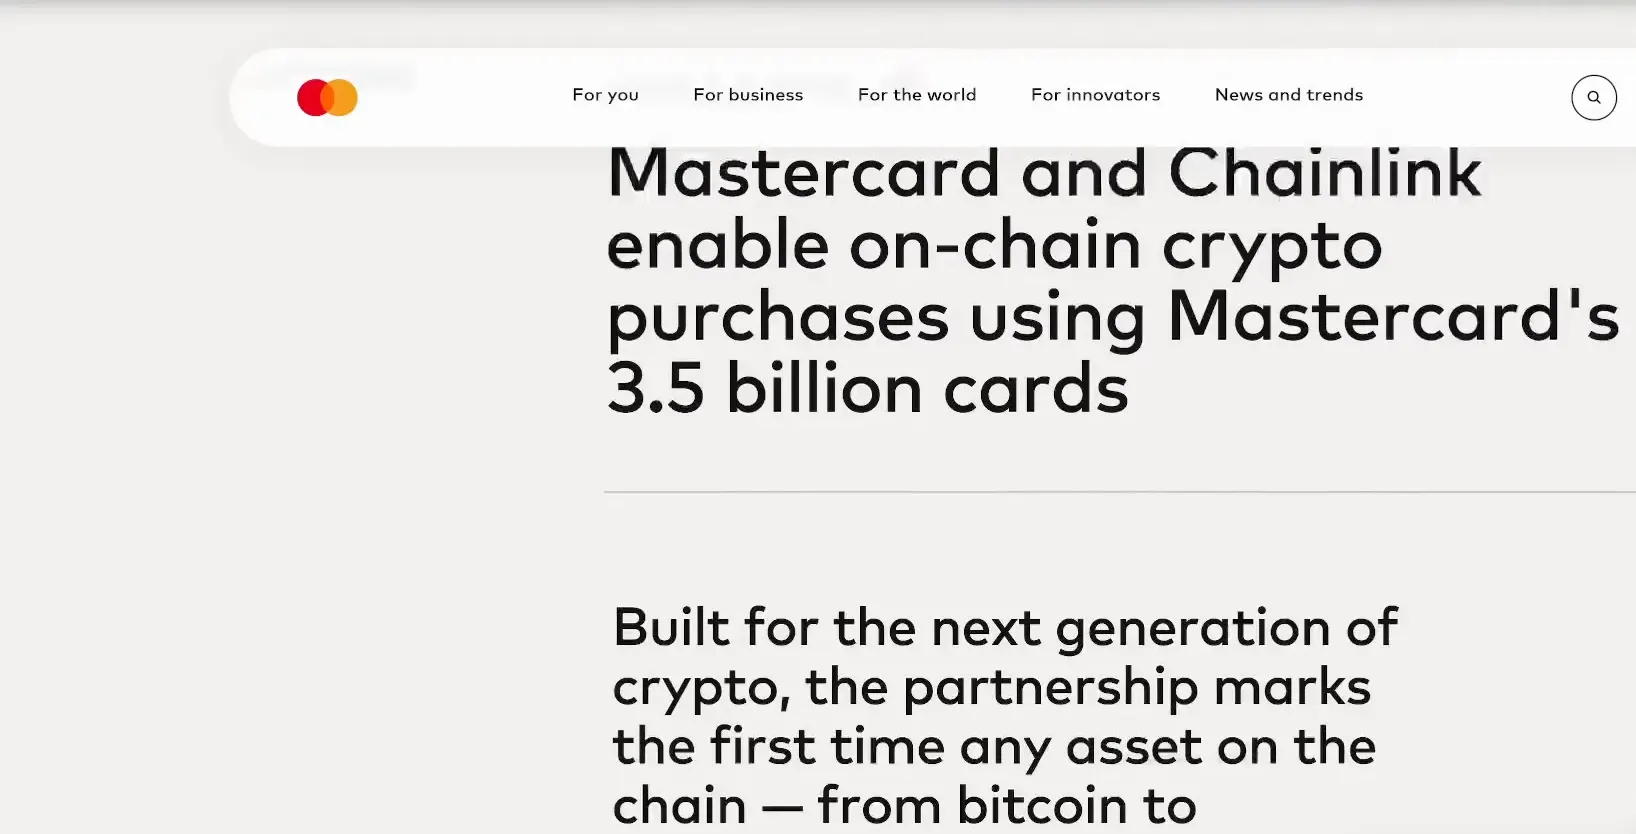
JPMorgan’s Connexus project and Mastercard’s initiatives with Chainlink show both banks and payment processors see value in secure on-chain data. Mastercard enabling on-chain crypto purchases via 3.5 billion cards and pairing with Chainlink highlights mainstream payment rails converging with blockchain infrastructure.
Oracle Dominance, TVS, and Number of Protocols
Let’s be precise: Chainlink’s strength isn’t just name recognition. It’s measurable. Recent snapshots show:
- Around 61–62% of oracle total value secured.
- Hundreds of protocols — roughly 450+ — using Chainlink oracles.
- Billions in total value secured across chains, with significant exposure to Ethereum DeFi.
These metrics create an asymmetric advantage. The more DeFi value depends on Chainlink, the less likely institutional adopters will risk swapping out that oracle layer for an unproven competitor. Network effects here are self-reinforcing.
Why TVS vs Price Disparity Matters
There’s a striking divergence: total value secured is at or near all-time highs in some measures, while LINK price is well below its 2021 ATH. When infrastructure utilization increases but token price lags, it suggests price is discounting future cash flows, monetization options, or broader market rallies. For investors, that’s a setup to watch.
How Chainlink Generates Value — Beyond the Token
Understanding the mechanisms through which LINK accrues value helps make an informed LINK Price Prediction:
- Oracle fees and node operator economics: demand for reliable data drives fees and node operator participation.
- Enterprise integrations: paid services, licensing, and secure data delivery contracts can create revenue streams that increase on-chain demand for oracle services.
- Network effects: as more protocols rely on Chainlink, demand for LINK (for staking, node services, or security bonding) increases.
While monetization models for open-protocol infrastructure differ from centralized business models, token demand tied to usage, staking, and security has historically driven token valuation as adoption grows.
Comparative Valuation and Price Targets
Comparing LINK to other infrastructure and utility tokens helps validate the plausibility of a $100+ LINK Price Prediction. Consider market caps of other major altcoins with strong narratives or user bases — large-cap chains trading at hundreds of dollars per token often command market caps many multiples of Chainlink today.
For example, a token with a $100–$150 price and market cap in the low-to-mid hundreds of billions is not unheard of for projects with wide adoption narratives. Chainlink securing tens of billions in TVS plus sizable institutional pilots suggests a path to meaningful multiple expansion if adoption continues.
Risks & Timeline
No prediction is complete without acknowledging risks and a realistic timeline:
- Regulatory risk: increased scrutiny on tokenomics, data usage, and institutional deployments could introduce friction.
- Competition risk: other oracle solutions and interoperability projects may capture pockets of demand.
- Market cycles: even strong projects experience extended sideways or down periods; price moves often lag fundamentals.
- Execution risk: partnerships don’t guarantee production-volume adoption; pilots may remain pilots for years.
Timeline: My LINK Price Prediction for $100+ is not a guaranteed short-term call. The structural adoption of tokenization, TradFi tests, and DeFi growth typically unfolds over multiple years. If market conditions align (macro liquidity, risk-on environment) and Chainlink continues to win enterprise and DeFi integrations, then a multi-year window is reasonable for reaching those price levels.
Practical Investment Considerations
For investors and traders who want to act on this LINK Price Prediction, here are pragmatic approaches:
- Position sizing: treat LINK as a core utility stake if you believe in long-term tokenization trends; keep allocations appropriate to your risk tolerance.
- Layering buys: accumulate on strength and weakness — buy partial positions on pullbacks and add on higher-timeframe breakouts such as weekly closes above 2024 and 2021 resistance zones.
- Use stop-loss discipline for short-term trades and avoid leverage unless you understand the risks fully.
- Follow adoption signals: large enterprise announcements, increases in total value secured, onboarding of new protocols, and public pilots moving to production are high conviction catalysts.
What to Watch Next
Data points and timelines that will validate or invalidate my LINK Price Prediction include:
- Weekly close above 2024 highs and eventual clearance of the 2021 red zone.
- Announcements converting pilots with SWIFT, DTCC, JPMorgan, or major custodians into production-level integrations.
- Acceleration in the number of projects and TVS relying on Chainlink oracles, especially in TradFi-focused tokenization use cases.
- On-chain metrics showing increased fee capture, staking activity, or other token-demand mechanisms.
FAQ — LINK Price Prediction and Common Questions
Q: Will LINK reach $100?
A: My LINK Price Prediction says it’s plausible within a multi-year timeframe if Chainlink continues expanding enterprise and DeFi integrations, clears key chart resistance, and the broader crypto market experiences a meaningful bull cycle. The combination of oracle dominance and institutional pilots makes $100+ achievable if adoption scales.
Q: How does Chainlink differ from other oracles?
A: Chainlink’s advantage is network effects and a proven track record across hundreds of protocols. It secures a majority share of oracle TVS and is deeply integrated in critical DeFi services. Many competitors exist, but Chainlink’s breadth of adoption and enterprise ties make it uniquely positioned for large-scale tokenization workflows.
Q: How does LINK capture value?
A: LINK captures value through demand for reliable oracle services, node operator economics, potential fee models, and staking/security mechanisms. As on-chain and off-chain workflows grow, token demand can increase due to usage and operational requirements tied to secure data delivery.
Q: Is Chainlink a risky investment?
A: All crypto investments carry risk. Chainlink’s risk profile is lower relative to speculative early-stage projects because it’s an established infrastructure layer. However, regulatory changes, market cycles, and competitive threats remain meaningful risks to monitor.
Q: What technical signals should I watch for confirmation of the LINK Price Prediction?
A: Watch for a weekly close above 2024 highs, followed by decisive clearance of the 2021 resistance zone. Those are the chart confirmations that historically precede sustained moves in major altcoins. Also monitor volume and on-chain flows that indicate real buying rather than short-term noise.
Q: How should I allocate to LINK?
A: Allocation depends on risk tolerance. For long-term believers in tokenization and oracle infrastructure, LINK can be a core allocation within the “utility” portion of a diversified crypto portfolio. For traders, treat it as a momentum/structure play and size accordingly.
Conclusion: Why My LINK Price Prediction Matters
Chainlink is not just another altcoin — it is core infrastructure for an on-chain future where price feeds, cross-chain data delivery, payments, and tokenized assets all need reliable, secure inputs. The market has a habit of undervaluing infrastructure when adoption is steadily increasing but not yet fully priced in. That’s where meaningful upside can emerge.
My LINK Price Prediction is based on a straightforward narrative: dominant market share in oracles, deep integration across DeFi and TradFi pilots, and a technical setup that could propel price into new discovery once critical resistance is cleared. While timing is never guaranteed, the structural case for Chainlink is clear and the risk/reward profile looks favorable for patient investors.
Remember: this is my analysis and not financial advice. Do your own research, monitor the technical levels I highlighted, and keep an eye on adoption signals like pilot-to-production moves with major institutions. If Chainlink continues executing and the market cooperates, the $100+ outcome in my LINK Price Prediction becomes much more than just a hopeful target — it becomes a plausible result of structural change.
Final thought: Chainlink has been quietly building the plumbing that will power web3’s interaction with legacy finance. When infrastructure is widely relied upon and its usage metrics climb, the markets eventually follow. That’s the logic behind my LINK Price Prediction.
