

Table of Contents
- Outline
- Why liquidity is the market’s fuel
- Understanding consolidation and why it matters
- How algorithms target liquidity
- Enter where others place their stop loss
- Step-by-step trade example
- How to incorporate liquidity into your setup
- Risk management and cautions
- Final checklist before you enter
- FAQ
Outline
- Why liquidity drives the market
- What consolidation reveals about stop losses
- How algorithms hunt liquidity
- A repeatable entry strategy: enter where others place stops
- Step-by-step trade example with visuals
- How to combine liquidity with your tools
- Risk management and common pitfalls
- FAQ
Why liquidity is the market’s fuel
Algorithms are written to move price to where the orders are. That’s not a conspiracy — it’s simply how market structure and automated trading work. Liquidity means places with lots of open orders: stop losses, clustered buy or sell orders, and therefore, lots of money.
When price reaches those areas it gets “fuel” — stops get triggered, orders fill, and momentum follows. If you understand where liquidity sits, you can start trading with the institutions and algorithms instead of against them.
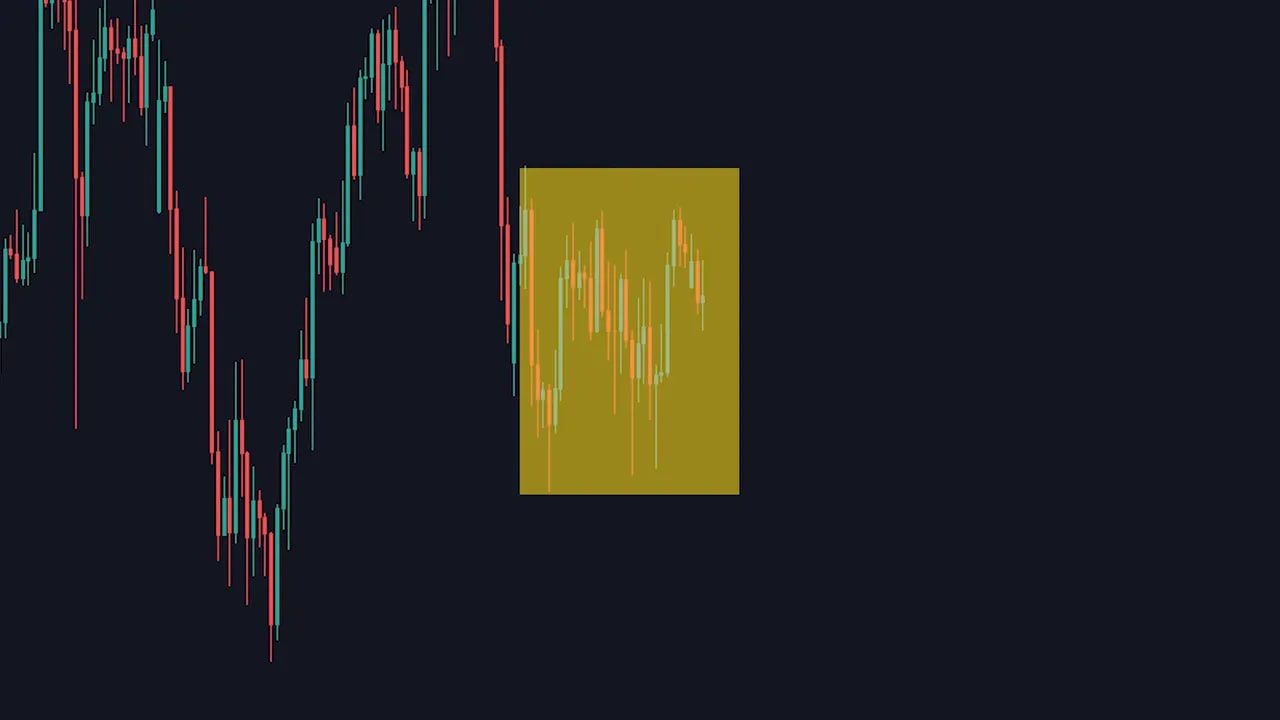
Understanding consolidation and why it matters
Consolidation is sideways price action: a clear high and a clear low where the market is saying, “this is fair value for now.” Most people say avoid ranges. I used to think that too. But ranges are the clearest maps of liquidity.
In a range, stop losses are obvious. Traders who see a break above the highs will often enter longs and place stops below. Traders who see a break below the lows will enter shorts and place stops above. Those stops become targets.
How algorithms target liquidity
Algorithms are programmed to execute, to push price toward obvious pools of orders. When a range forms, the highs and lows are magnets. If price pokes above the top and takes out those late longs, it triggers that liquidity and provides the momentum to sweep to the other side.
The practical result: when a range breaks, the smarter play is often to trade in the opposite direction, using the expected liquidity sweep as your catalyst.
Enter where others place their stop loss
One of the best trading heuristics is simple: put your entry where most people put their stop loss. That flips the common retail move on its head. Instead of being the stop-loss victim, you become the buyer or seller collecting those stops as fuel for a move.
“Write down where you’d buy and where you’d put your stop loss. Don’t buy it, but put an order to buy at where you’d put your stop loss and then watch how many times the market goes to your order.”
That quote captures the idea. If you place your entry at that stop cluster, you will see the market come to you often.
Step-by-step trade example
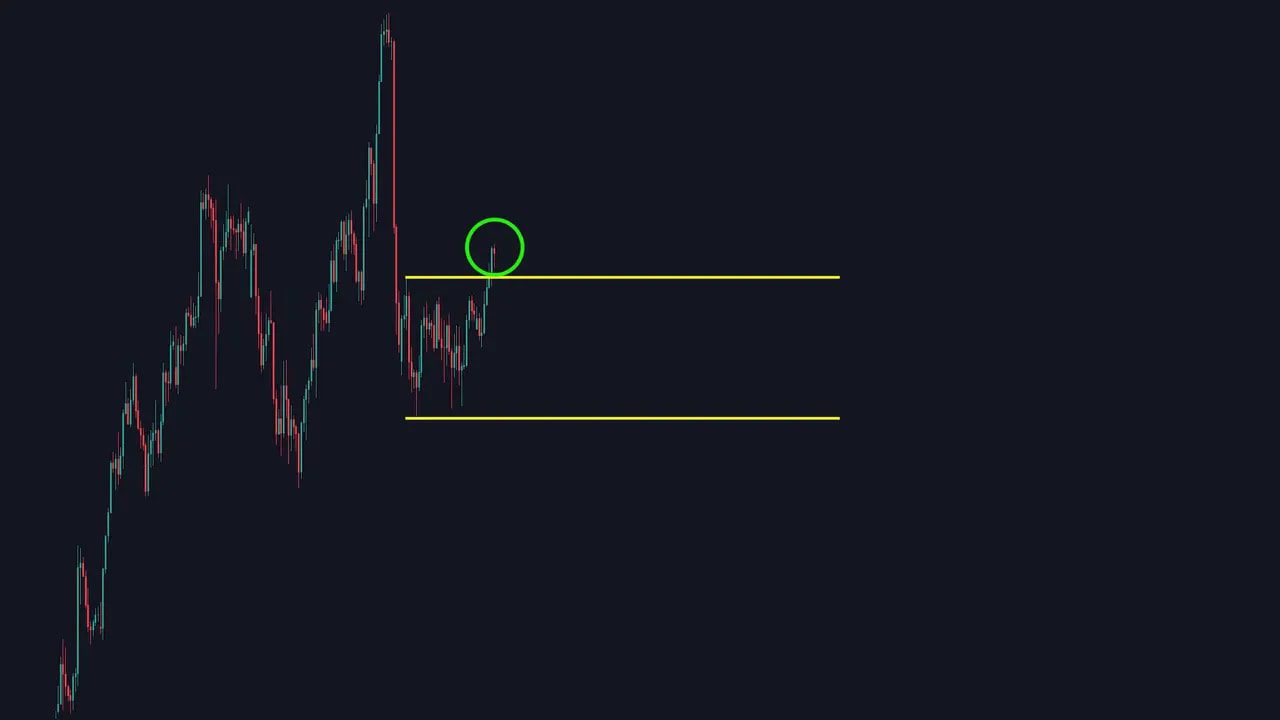
Imagine a clear uptrend: higher highs, higher lows. Suddenly it dumps and then consolidates into a range. Mark the range high and the range low.
The algorithm will try to push price outside the range to grab liquidity. When the price breaks the top of the range, many traders will interpret that as a new uptrend and enter longs, placing stops below the range. If that breakout is a fake, those stops fuel a move down.
The repeatable cycle looks like this:
- Price breaks the range high. Enter short targeting the next liquidity point (the nearby cluster of stops).
- Price moves to lower liquidity and reverses. Enter long targeting the opposite liquidity cluster.
- Price hits that target, breaks, then reverses again—repeat the short/long entries along the range’s liquidity points.
This creates a chain of “easy” profits when the market is oscillating and algorithms are harvesting liquidity from one side to the other. The key is recognizing that the range defines where liquidity sits and algorithms will pursue it.
How to incorporate liquidity into your setup
Liquidity should be part of your edge, not your only signal. Pair liquidity analysis with:
- Supply and demand zones — confirm where big orders are likely to cluster.
- Order flow or volume analysis — see where real market pressure exists.
- Fair value gaps or structural levels — align entries with higher-probability zones.
- Indicators — only as confirmation, not primary drivers.
If you trade crypto, liquidity behavior can vary across exchanges and blockchains. Using reliable market signals can speed up your decision-making and help you spot high-probability liquidity hunts across Bitcoin, Ethereum, and altcoin markets. Crypto trading signals that highlight likely liquidity targets and stop clusters are useful for traders who want to act quickly on cross-chain moves without constantly staring at every chart.
Risk management and cautions
Liquidity hunts don’t always reverse. Sometimes a breakout simply continues in the original direction. That means:
- Never use liquidity as the sole entry trigger.
- Keep stop sizes reasonable and plan your risk-reward before entering.
- Use confluence—structure, volume, and order flow—to increase probability.
Algorithms are efficient at finding liquidity, but so are sudden news events and macro flows. Respect the market and expect losers. The goal is to make the house’s methods work for you.
Final checklist before you enter
- Have I identified the range high and range low?
- Where would the majority place their stop loss?
- Do I see confirmation from volume, order flow, or supply/demand?
- Is my position size and stop appropriate for this setup?
FAQ
What exactly is liquidity in markets?
Liquidity is where large orders reside — clusters of stop losses, market orders, and limit orders. These areas are attractive targets for algorithms because they provide instant execution and movement when swept.
Why do stop losses make the market move?
When stop losses are triggered they convert resting limit orders into market orders, creating a flurry of execution that pushes price. That momentum can then attract more orders and cause larger moves.
Will entering where others put stops always work?
No. It works often during consolidations and classic liquidity hunts, but breakouts that continue can invalidate the setup. Always use risk management and combine liquidity with other confirmations.
How can I use liquidity analysis in crypto markets?
Crypto markets often show clear liquidity clusters around round numbers, previous highs and lows, and across major exchanges. A practical step is to track where stop clusters align across timeframes and use signals that highlight likely liquidity sweeps. If you want a faster path to spotting these opportunities, consider using crypto trading signals that monitor cross-exchange liquidity and flag high-probability setups.
What should I pair liquidity with for a stronger strategy?
Pair liquidity with supply and demand, order flow, fair value gaps, and volume. Indicators can help but should not replace raw price and order-flow context.
