

Table of Contents
- Quick overview
- What is a supply or demand zone?
- Why multiple zones are confusing (and how to fix it)
- The three tools to find the strongest zone
- Combine the three clues into a decision formula
- Real chart examples
- Execution checklist
- Crypto trading and this method
- Final thoughts
- Frequently asked questions
Quick overview
The simplest way to think about trading is to buy where institutions buy and sell where institutions sell. This approach uses supply and demand zones as anchors: demand zones start strong moves up, supply zones start strong moves down. The challenge is not finding zones — it is knowing which zone will hold. This guide walks through a practical, repeatable method to pick the strongest zones using three high-probability clues: inducement/liquidity, breaks of structure, and fair value gaps.
What is a supply or demand zone?
A supply zone is the price range where selling pressure creates a strong downward impulse. A demand zone is the opposite — the area that kickstarts a rapid upward move. Mark a zone by taking the full range of the candle right before the strong impulse: from low to high for demand, or high to low for supply. Those candle ranges often represent institutional activity.
Why multiple zones are confusing (and how to fix it)
Charts typically show several candidate zones after a move. Some of these are genuine institutional zones and others are traps that collect retail orders and stop losses, then feed price toward the real zone. Picking the wrong zone can mean a losing trade.
The three tools to find the strongest zone
Use these three filters together to raise the probability of choosing the correct level.
1) Inducement and liquidity (equal highs / equal lows)
Inducement is anything that persuades traders to act. On charts this often looks like a consolidation with equal highs or equal lows. Those levels hold resting stop losses placed by retail traders. Markets are programmed to hunt that liquidity, take out stops, then reverse toward the true institutional zone.
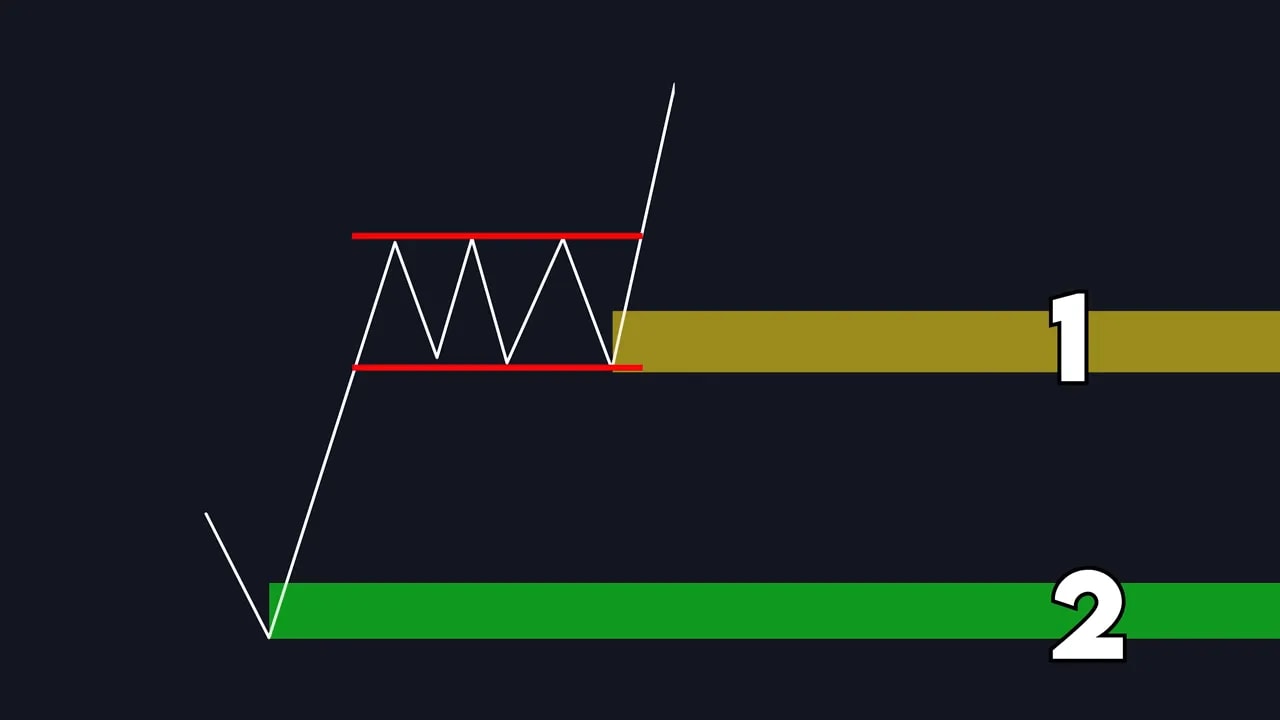
If a candidate zone sits above equal highs or below equal lows, treat it skeptically — price may first take out that liquidity before making the move in the expected direction.
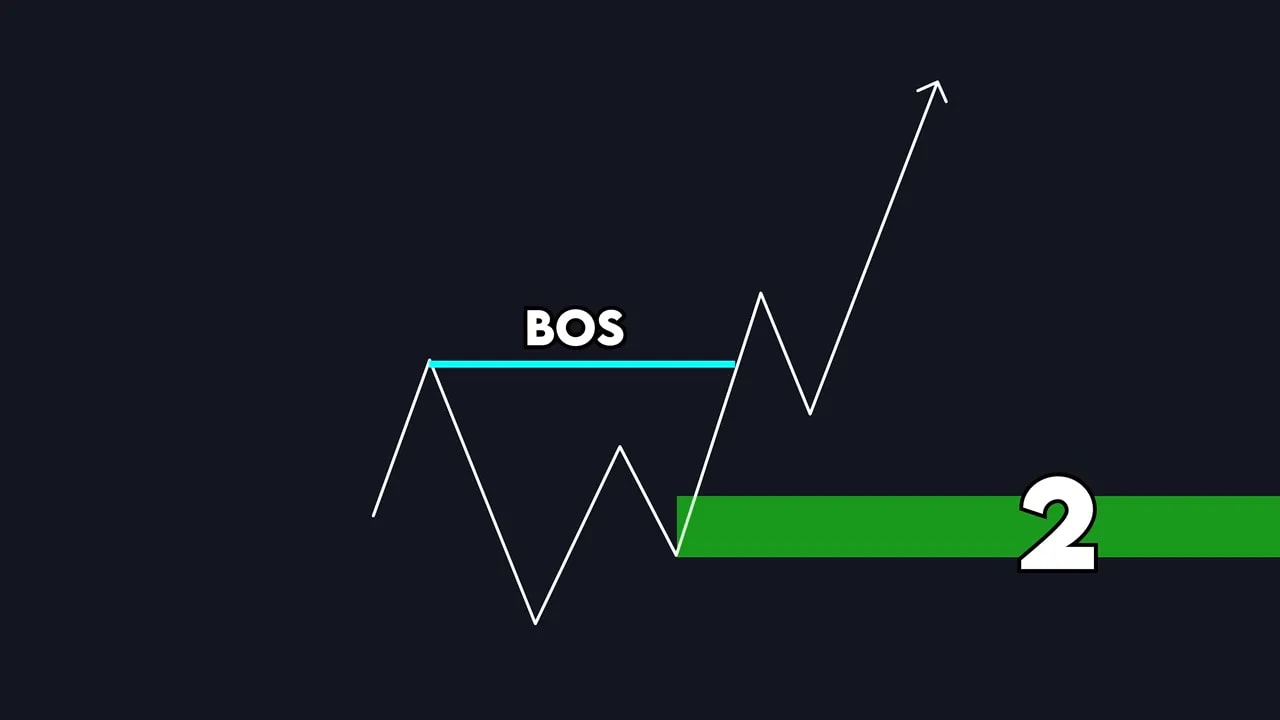
2) Breaks of structure
Zones that provide enough buying or selling power to break a previous structure (previous high or low) demonstrate institutional strength. If a demand zone is the one that breaks the previous high, it has more conviction than a lower zone that fails to do so.
3) Fair value gaps
A fair value gap (FVG) is a three-candle formation where price moves so fast that a gap of untested price appears (no wicks filling that space). Price naturally wants to revisit and fill that untested zone. If a fair value gap sits next to a candidate zone, that bias makes certain zones more or less likely to hold.
Combine the three clues into a decision formula
- Remove any zone that sits behind obvious liquidity (equal highs/lows) because it is likely an inducement zone.
- Prefer zones that produced enough force to break previous structure.
- Consider fair value gaps as magnetic areas price will return to; a zone that blocks access to an FVG is less likely to hold.
Using these three filters together gives you a clean, repeatable way to pick the best zone instead of guessing.
Real chart examples
Here are practical setups where the method is applied step by step.
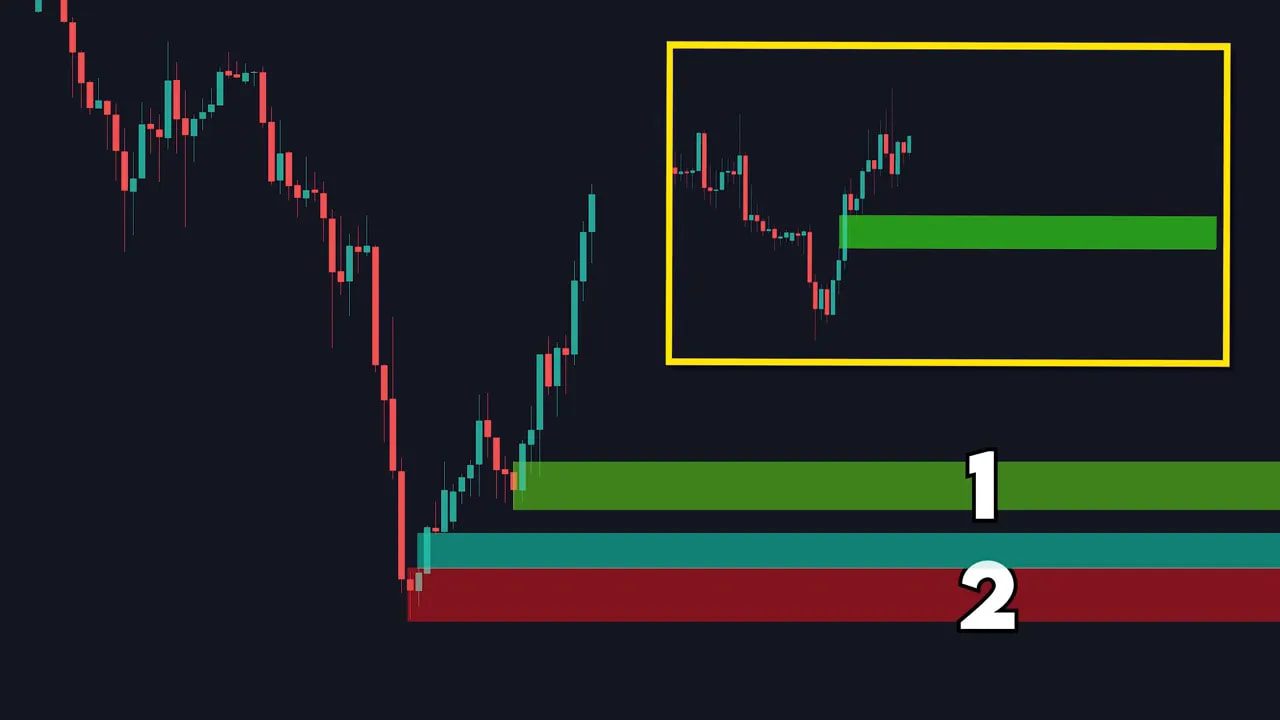
Example 1 — Uptrend demand selection
In an uptrend look only for demand zones. If multiple demand zones exist:
- Cross out any zone that blocks access to a nearby fair value gap.
- Check which zone actually provided the strength to break the previous high — that one is the likely winner.
Trade rules: wait for price to come to the chosen demand zone, enter when it tests the zone, place your stop loss below the zone, and set take profit near the recent high. This keeps risk defined and aligns reward with the visible structure.
Example 2 — Reversal to the downside (supply selection)
For shorts use the same logic but inverted. If a supply zone has equal highs above it or there’s an FVG nearby, it can act as an inducement that fails and hands price to the true supply zone below. Wait for the test, stop above the supply zone, and target the swing low.
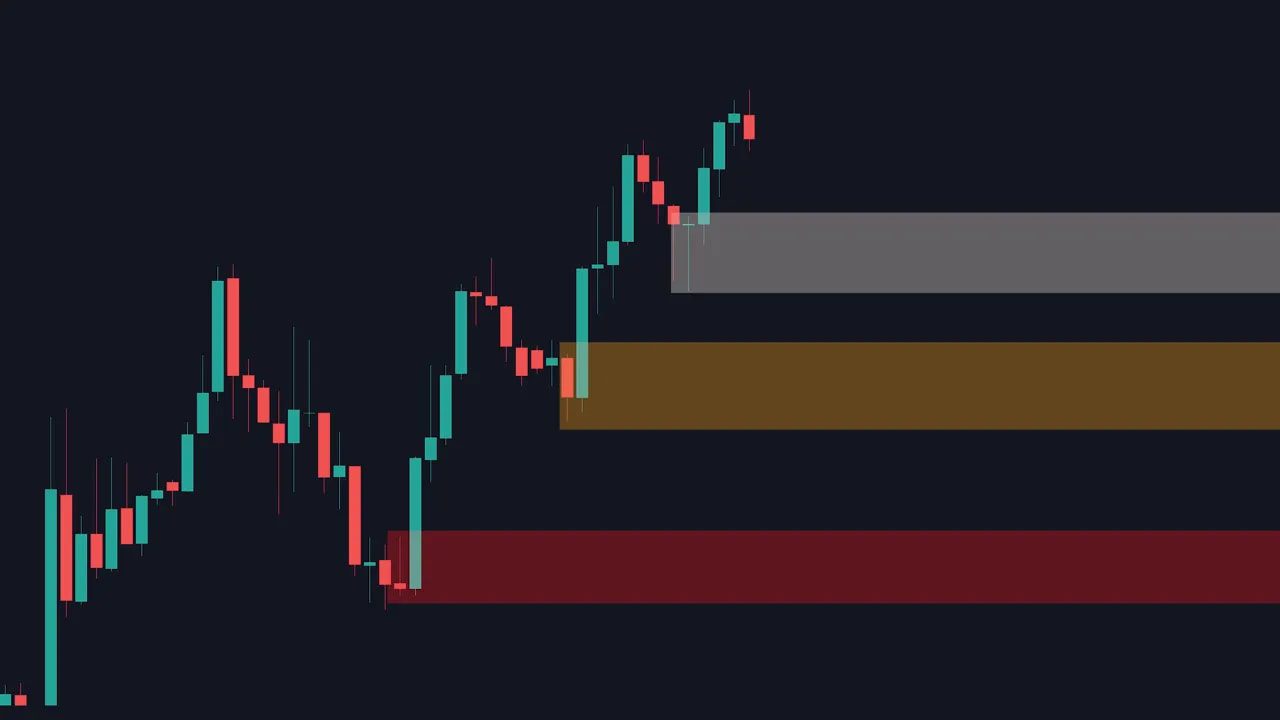
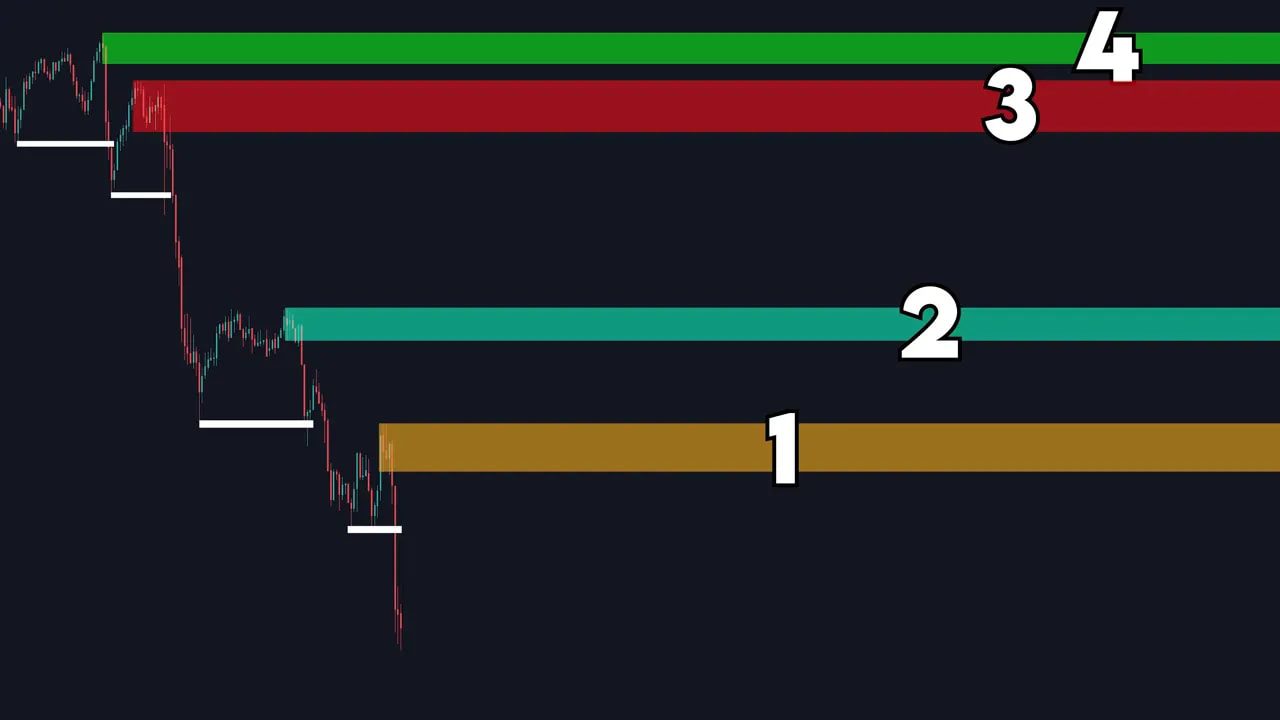
Example 3 — Multiple supply zones in a downtrend
When four supply zones appear in a downtrend, eliminate any that sit behind easy liquidity (equal highs). Traders often get trapped into the higher inducement zones and stops are eaten on the way to the lowest institutional zone. The correct zone often ends up being the one that price reaches after sequential liquidity hunts.
Execution checklist
- Timeframes: Works on all timeframes but 1-hour and daily tend to give the strongest, most reliable zones.
- Entry: Enter when price returns and shows a test of the chosen zone (reaction candle or confirmation candle).
- Stop loss: Place below demand zone or above supply zone — keep it reasonably tight to the zone width.
- Take profit: Use the recent swing high or low as the first target. Consider scaling out or trailing if price continues in your favor.
- Risk management: Never risk more than a small percentage of your account per trade and size positions accordingly.
Crypto trading and this method
cryptosignals.com/blog/category/crypto-signals” target=”_blank”>Crypto markets display the same institutional behavior: liquidity hunts, fair value gaps, and structural breaks happen across blockchains. Because crypto can be more volatile, combining this zone-based approach with reliable market signals helps turn opportunities into consistent entries. If you trade crypto and want additional confirmation, a professional service offering the best crypto trading signals can highlight high-probability setups, show when fair value gaps align with larger timeframes, and reduce time spent scanning multiple chains.
Final thoughts
The core idea is simple: trade where institutions are likely to be. But simplicity without rules is guesswork. Use inducement/liquidity clues, structure breaks, and fair value gaps together to filter candidates. Wait for a real test of the chosen zone, use defined stops and targets, and manage risk consistently. Over time this disciplined approach reduces false entries and increases the chance of catching the big institutional moves.
Frequently asked questions
What timeframe should I use this strategy on?
It works on all timeframes, but the 1-hour and daily charts usually produce the most reliable supply and demand zones. Higher timeframes generally give cleaner institutional footprints and fewer false signals.
How do I identify equal highs and equal lows?
Look for short consolidations where swing peaks line up at roughly the same price level (equal highs) or swing troughs align (equal lows). These are likely places traders set cluster stop losses and are prime liquidity targets.
Are fair value gaps always filled?
Not always, but fair value gaps are attractive targets for price to revisit because they represent untested areas. Treat them as a bias rather than a guarantee. Use them in combination with structure and liquidity to increase confidence.
Can I apply this to Forex, stocks, and crypto?
Yes. The same institutional behavior shows up across markets. Timeframe choice and volatility differ by asset, so adjust position sizing and stops accordingly. For crypto, consider using a reliable signal service offering the best crypto trading signals to help spot cross-chain opportunities and high-probability setups faster.
What if price breaks my chosen zone?
Accept the stop and re-evaluate. A failed zone usually means price is moving to the next liquidity pool or the true institutional zone. Reapply the three filters to the new structure and wait for the next valid test.
