Wednesday, January 7, 2026
Dark Crypto Signals - Get 12+ World-Class Crypto Traders’ Signals
Home Blog

Get Perfect Entries Using Fibonacci Retracement: The Golden Zone Strategy

0

Table of Contents

What this guide covers

  • Why Fibonacci retracement works and what the “golden zone” is
  • Exact TradingView settings to use
  • How to choose the correct start and end points using fractals
  • Layering confluence: retests, 200 EMA, and anchored VWAP
  • Step-by-step trade setup, risk placement, and targets
  • How to apply this across markets, including crypto — and a subtle way to scale with crypto trading signals

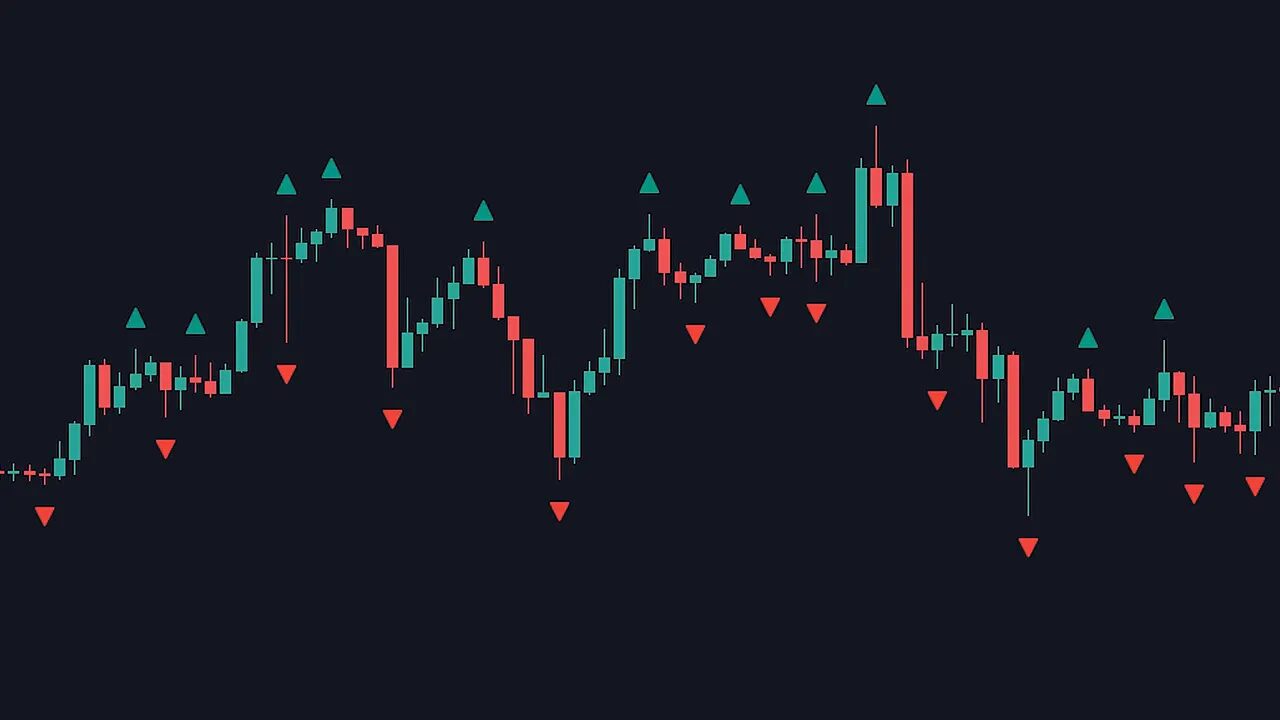
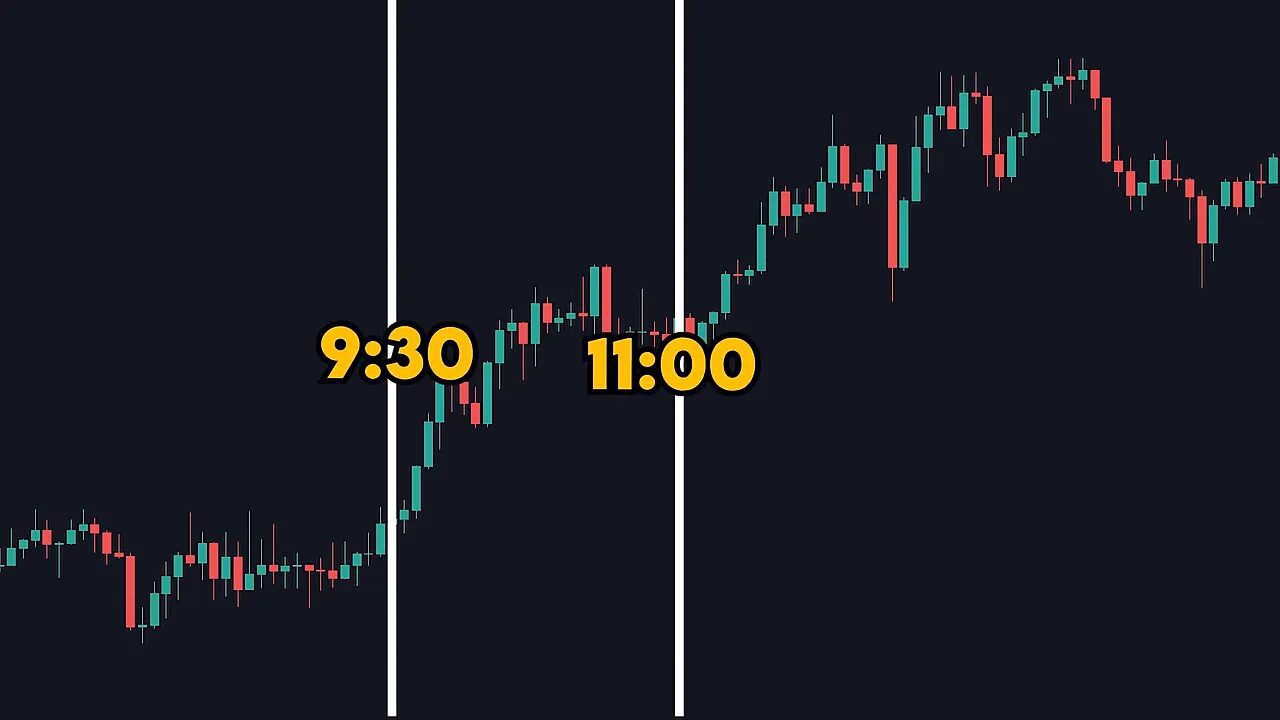
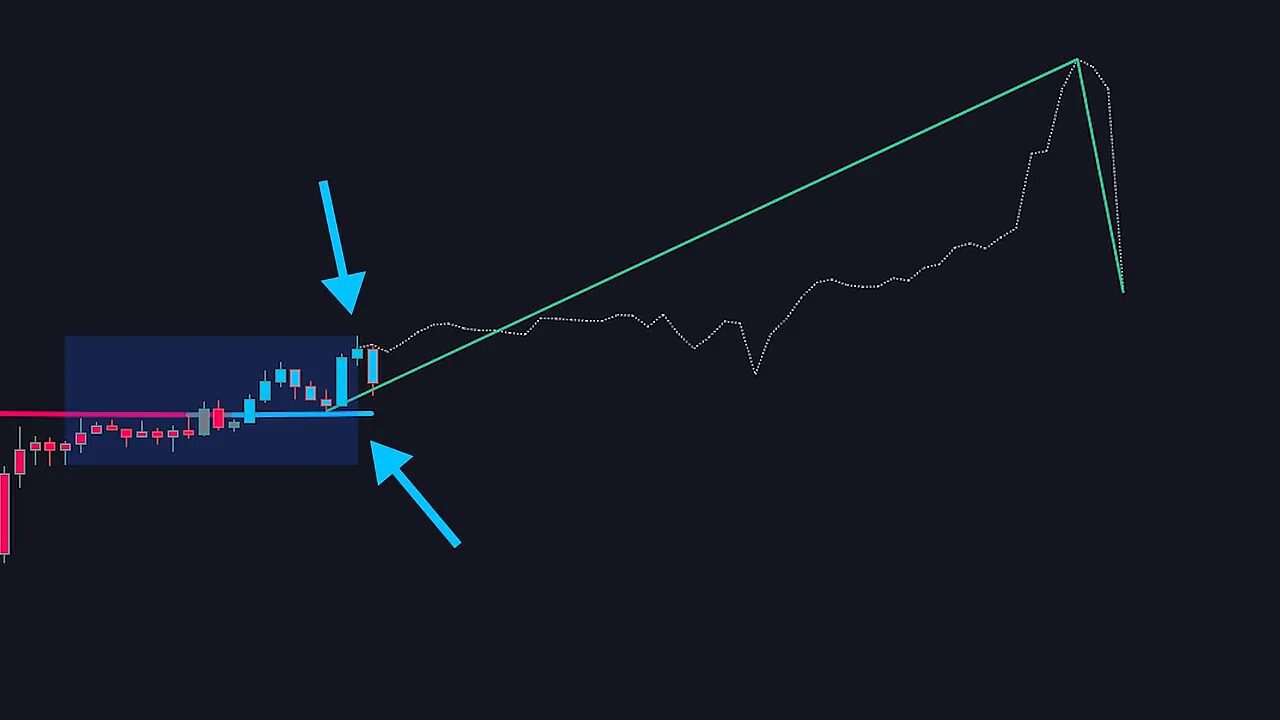
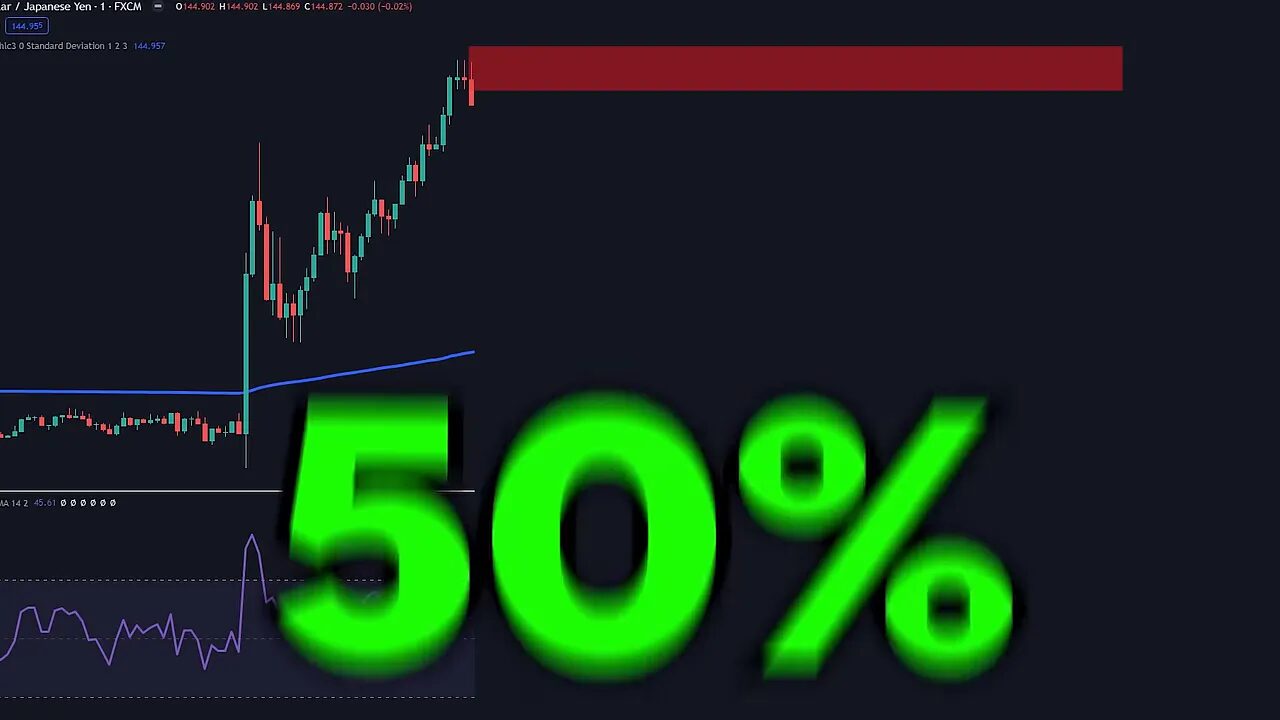
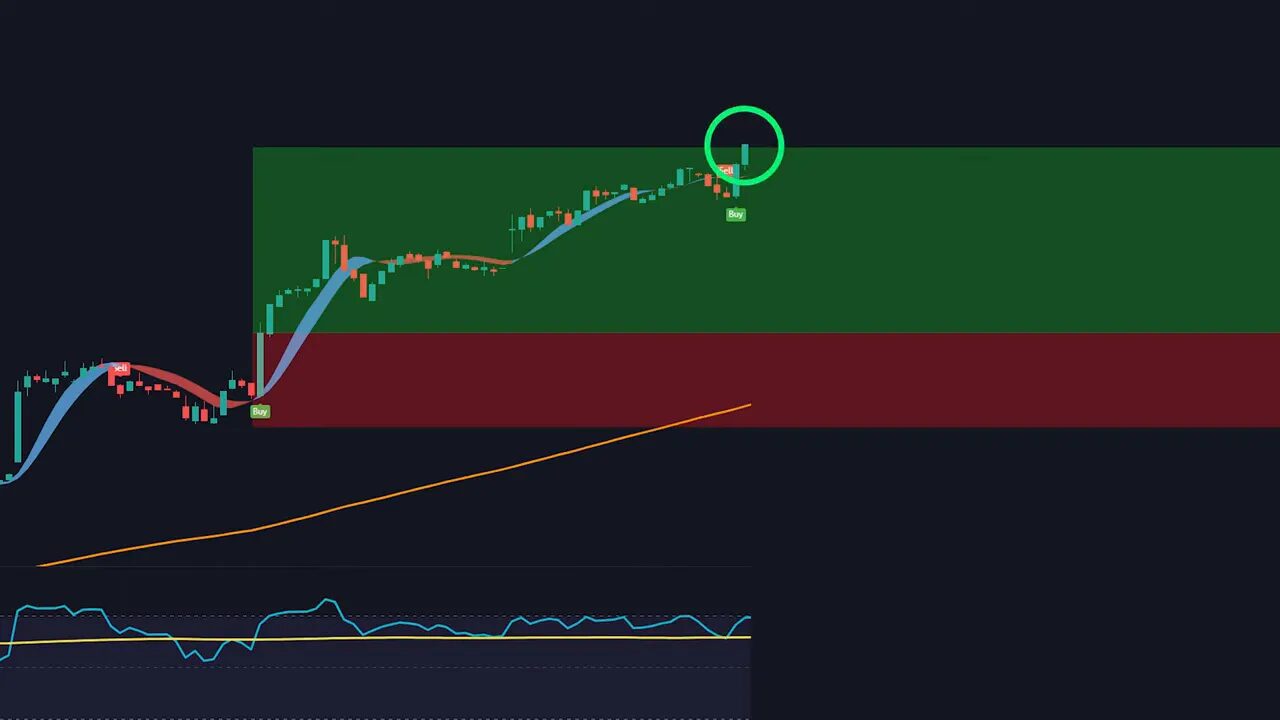
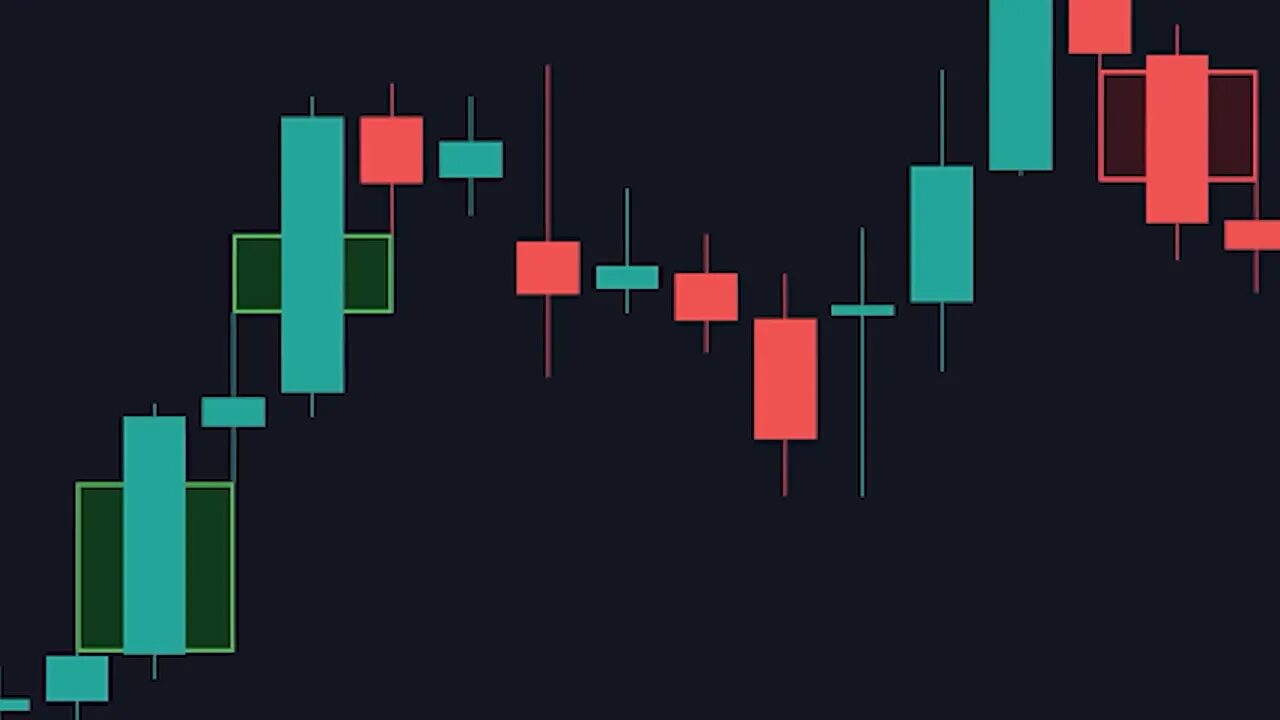
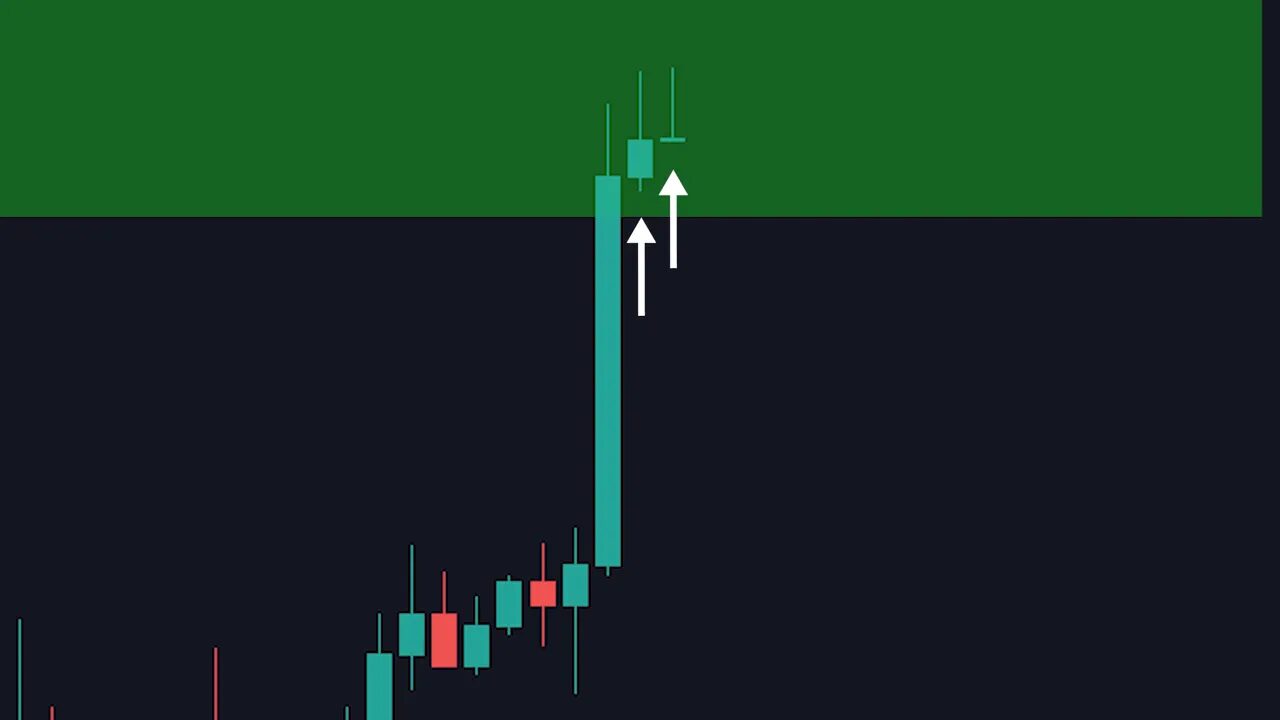
How price actually moves (and why retracements are predictable)

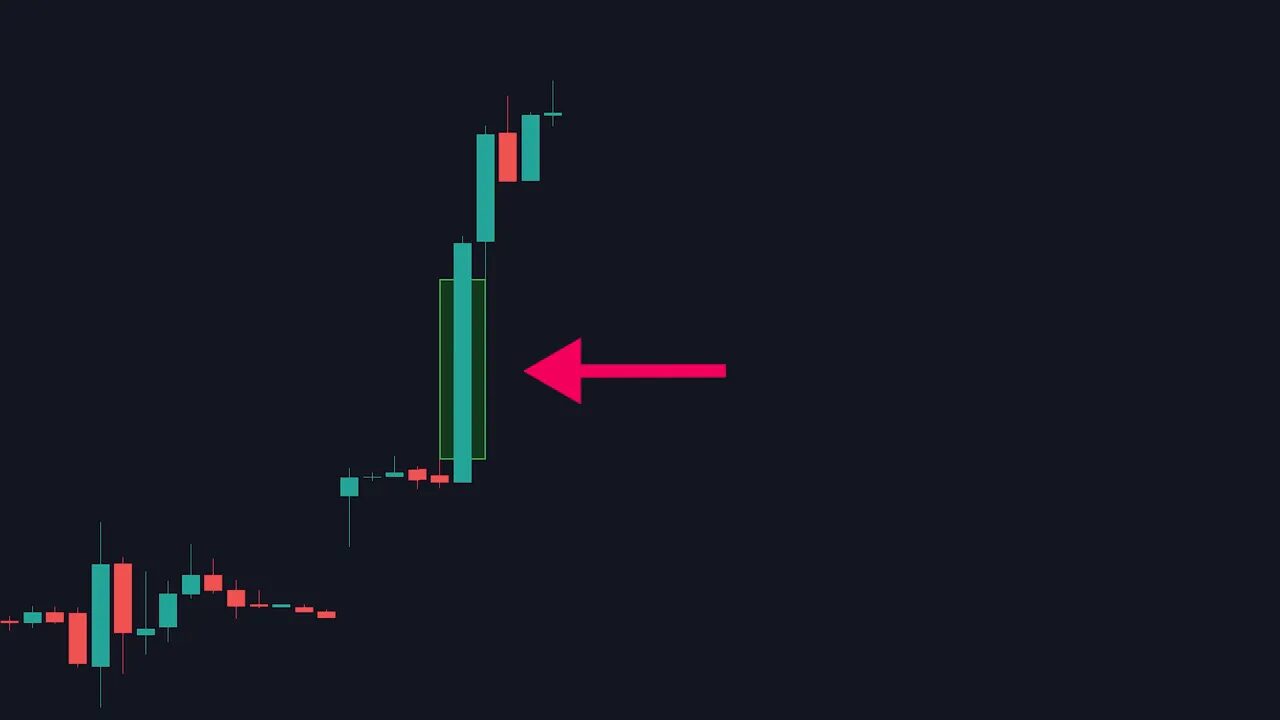
Markets rarely move in a straight line. They trend, then they pull back, then they resume the trend. That pullback is your opportunity.

The aim with Fibonacci retracement is simple: predict where the pullback will end so you can take a low-risk, high-reward entry near the end of the retrace and ride the next leg of the trend.

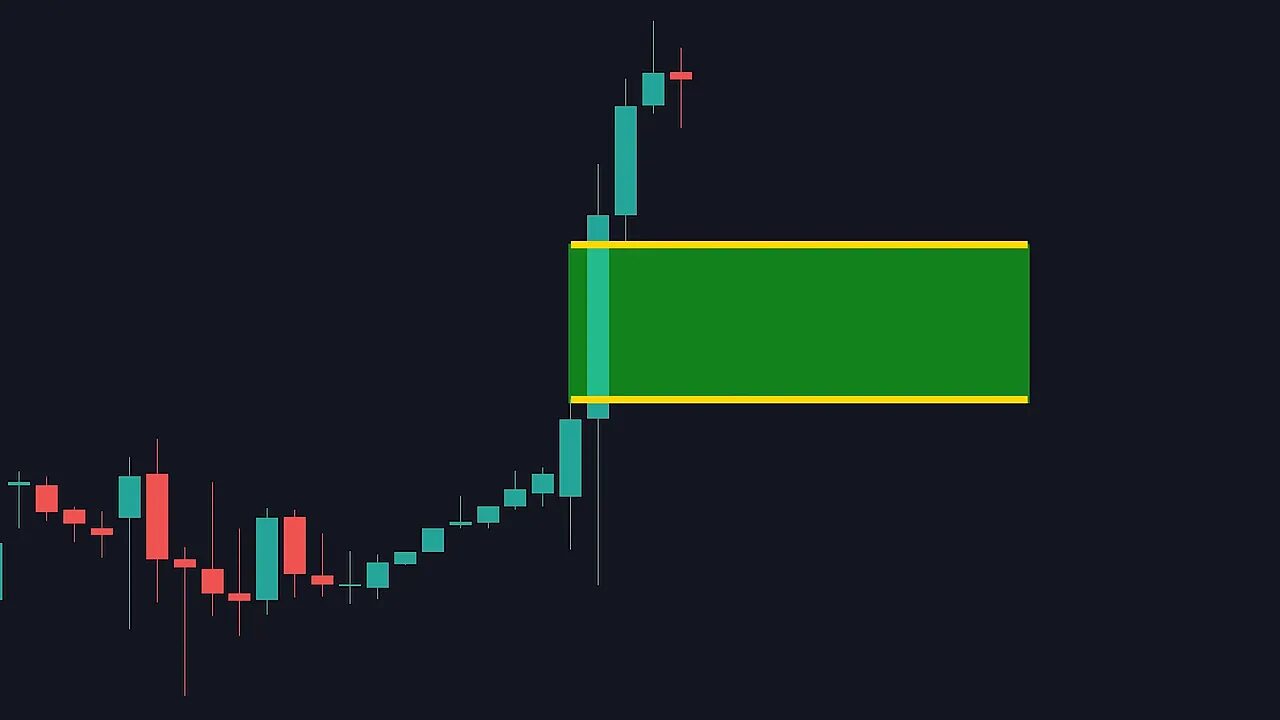
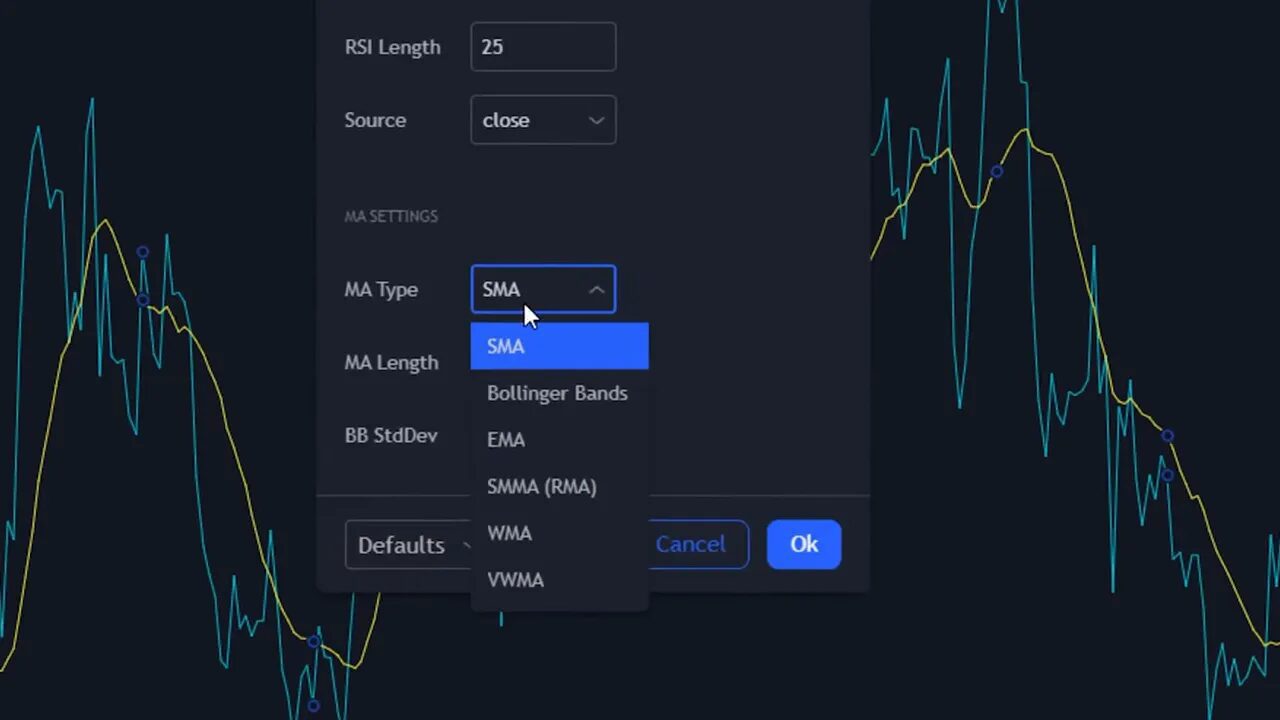
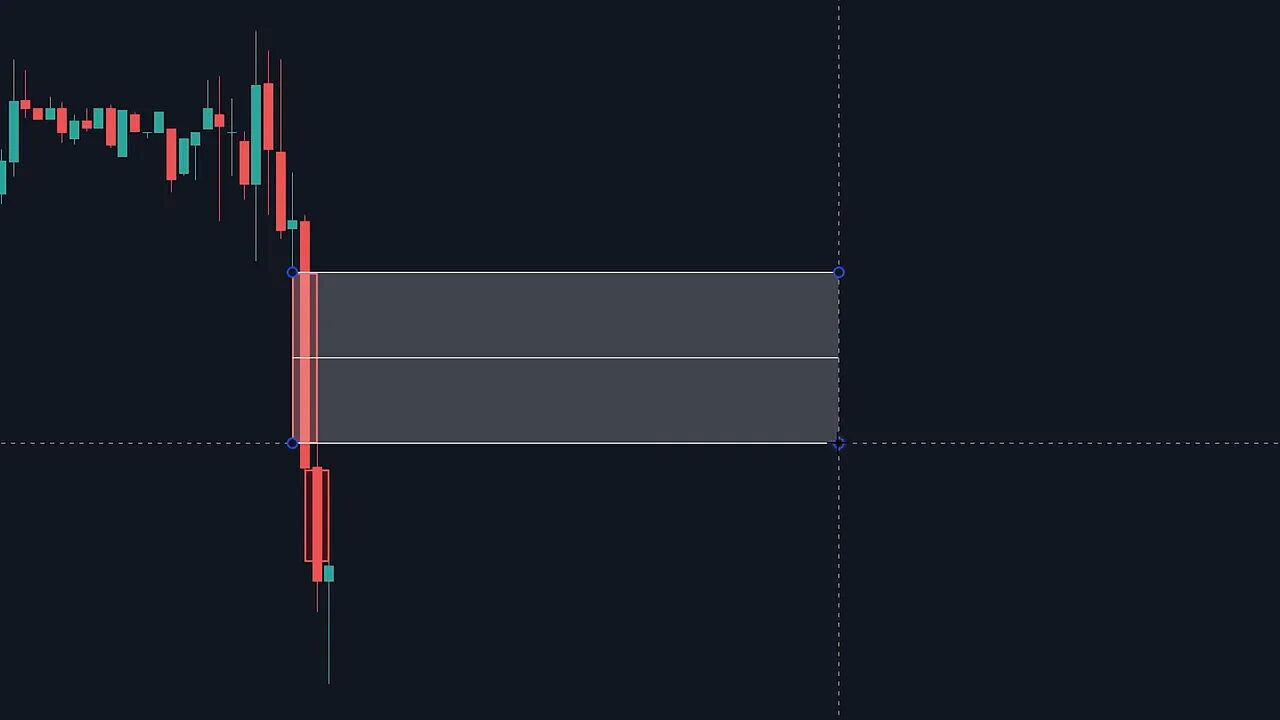
Fibonacci settings and the golden zone

Not all Fibonacci levels are equal for every strategy. For this approach I use the following levels in TradingView: 0, 0.382, 0.5, 0.618, 1. The area between 0.382 and 0.618 is what I call the golden zone. That is the most likely region for a high-probability retracement reversal.

These three levels give a clear “zone” rather than a single line. Treat the golden zone as a target area to wait for additional confirmation instead of mechanically entering the instant price touches a single level.

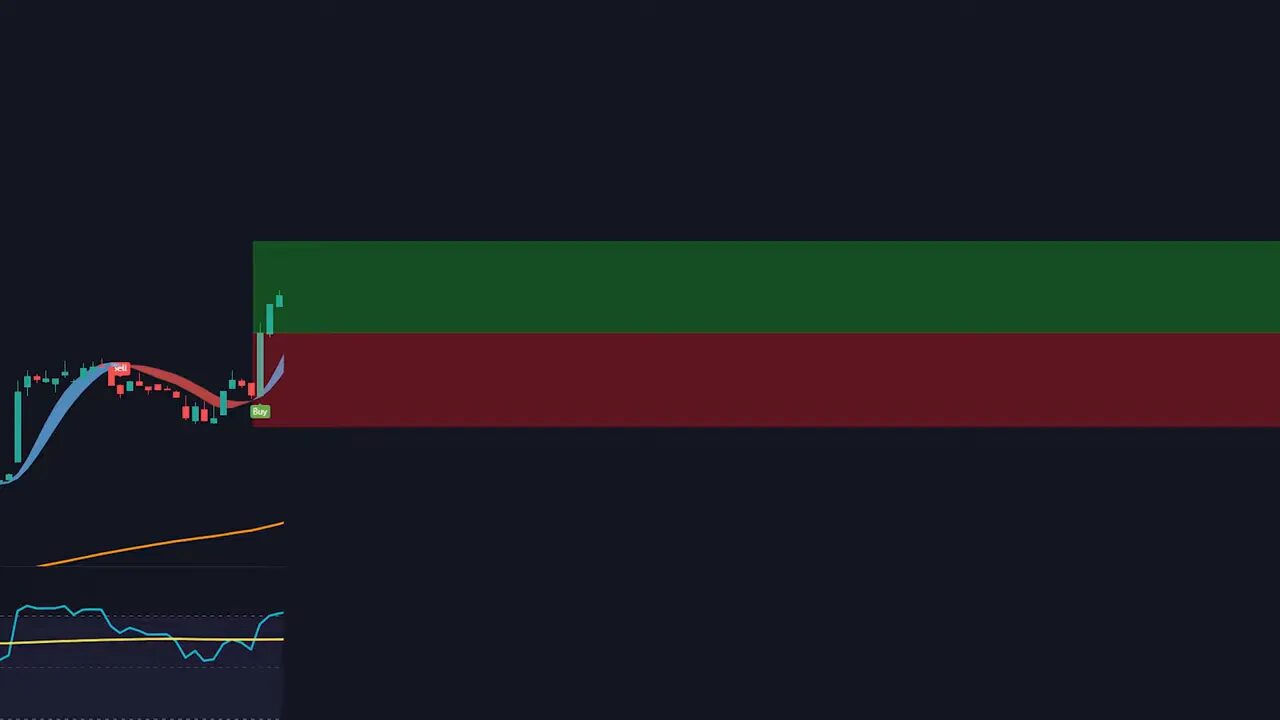
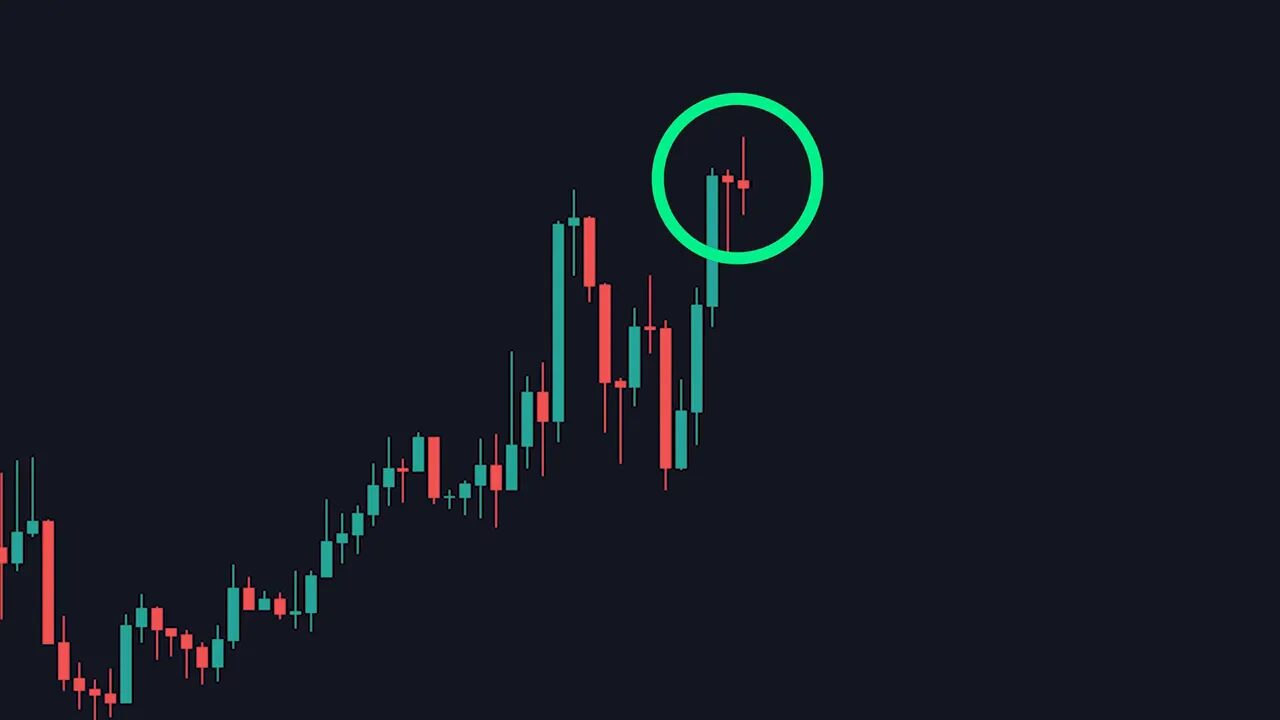
Where to anchor your Fibonacci: use fractals to remove guesswork

One of the most common errors is placing the Fibonacci start and end on weak swings. Use the fractals indicator to filter for strong swings so you anchor the tool only on meaningful moves.

Set the fractals indicator period to 10 to reduce noise. That gives you fewer, stronger swing points to choose from. Then mark the Fibonacci from the significant low (red fractal) to the significant high (green fractal) for an uptrend, and vice versa for a downtrend.

Clear candlestick chart with green upward and red downward fractal triangles marking well-defined swing highs and lows.

Only apply this method to strong, clean trends. If swing points are bunched up or the move looks choppy, skip it. The Fibonacci tool performs best on clear, impulsive moves.

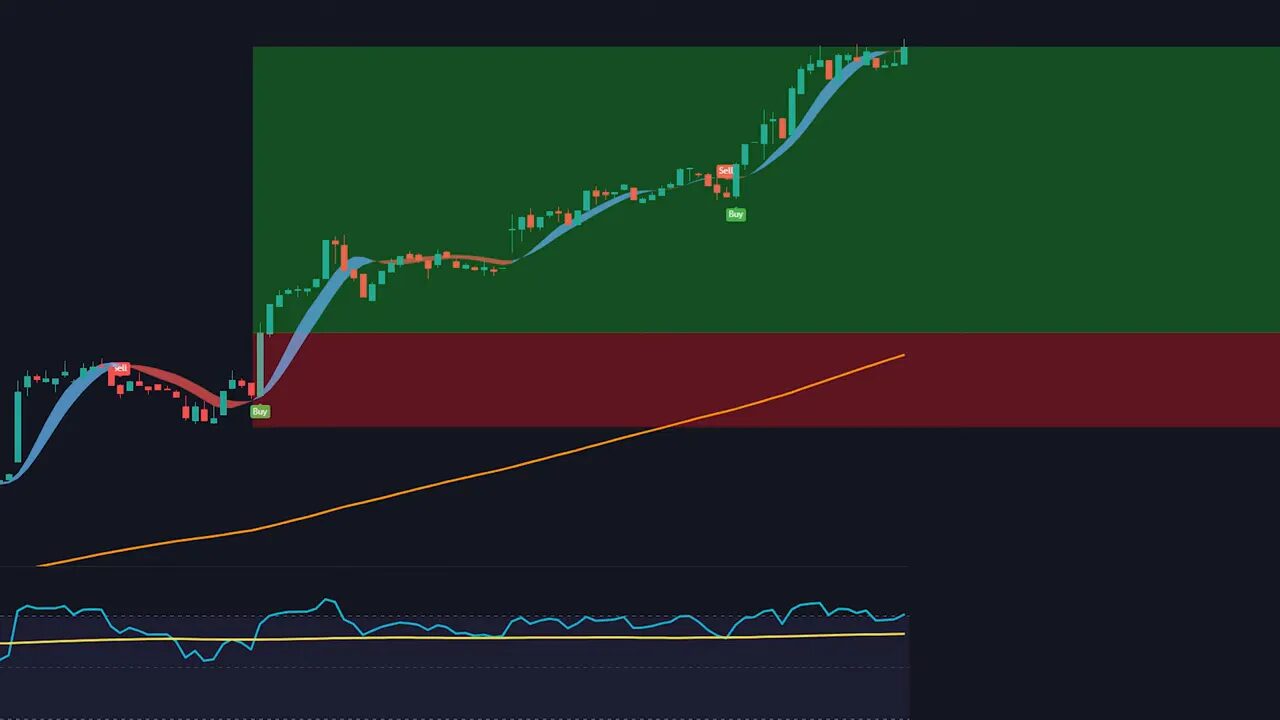
Confluence is everything: retests, 200 EMA, and anchored VWAP

Fibonacci on its own works, but when paired with other confirmations the signal becomes far more reliable. Add these three confluences to stack probability in your favor.

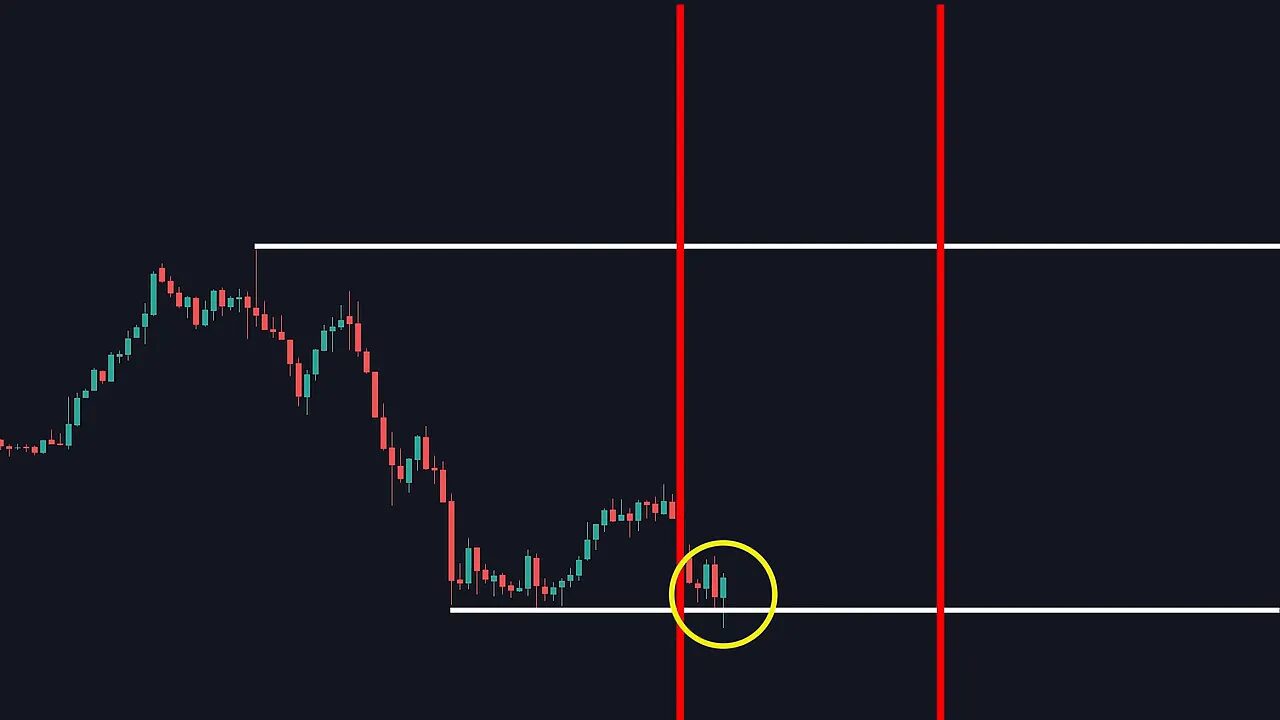
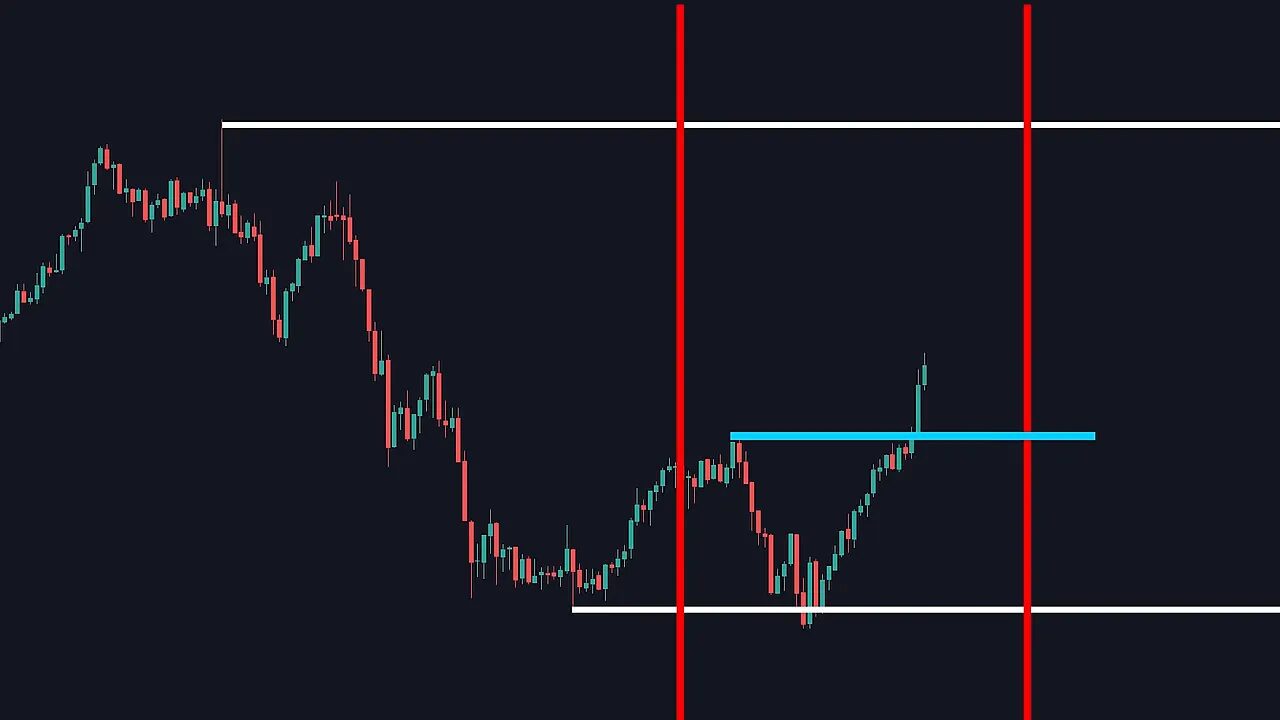
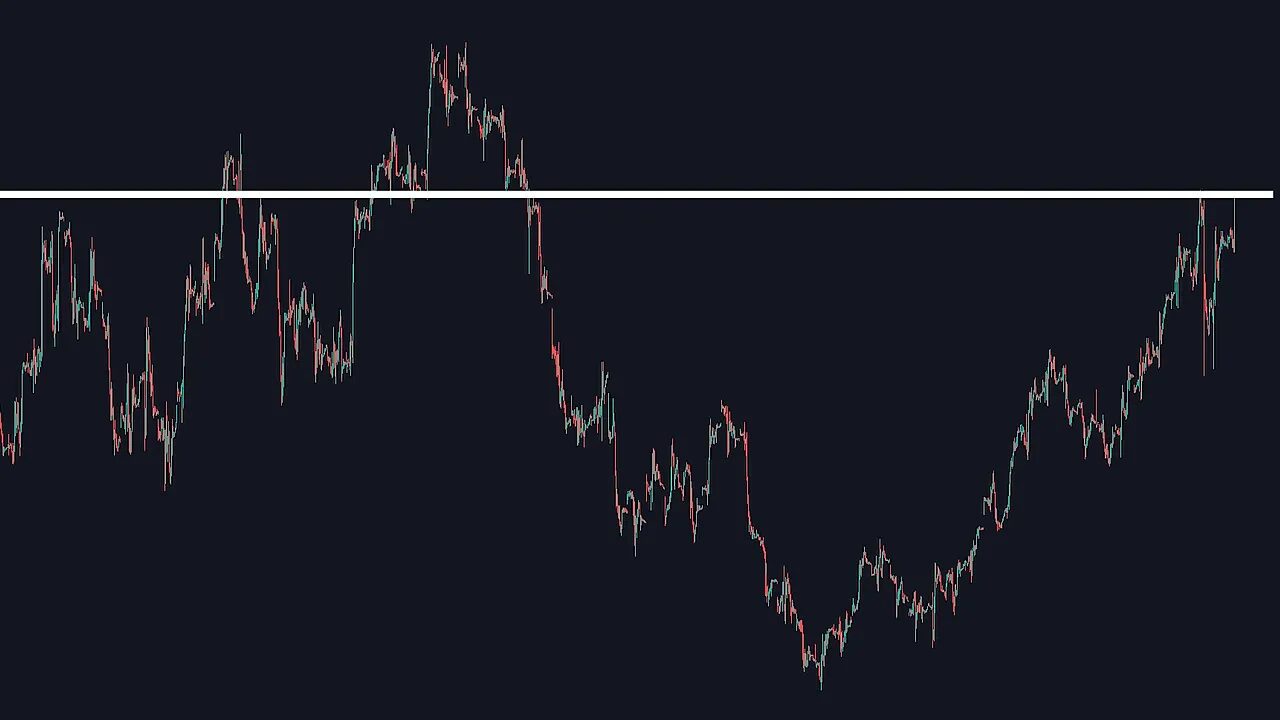
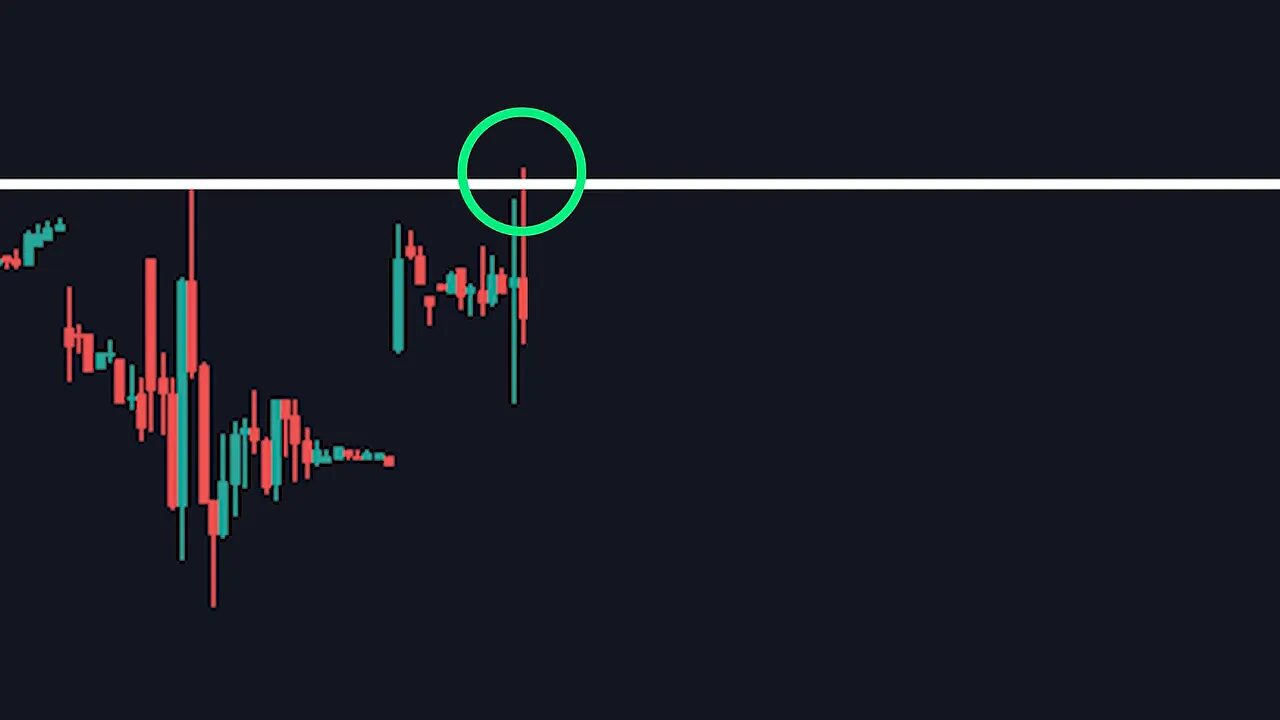
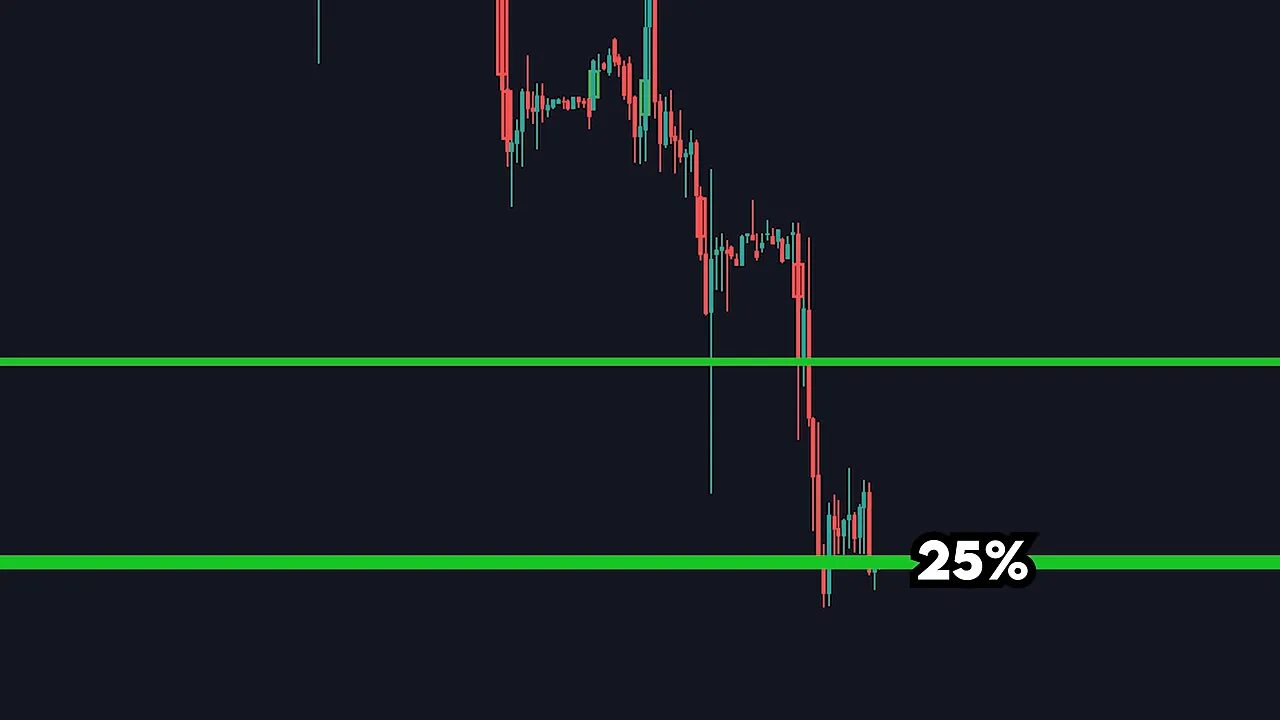
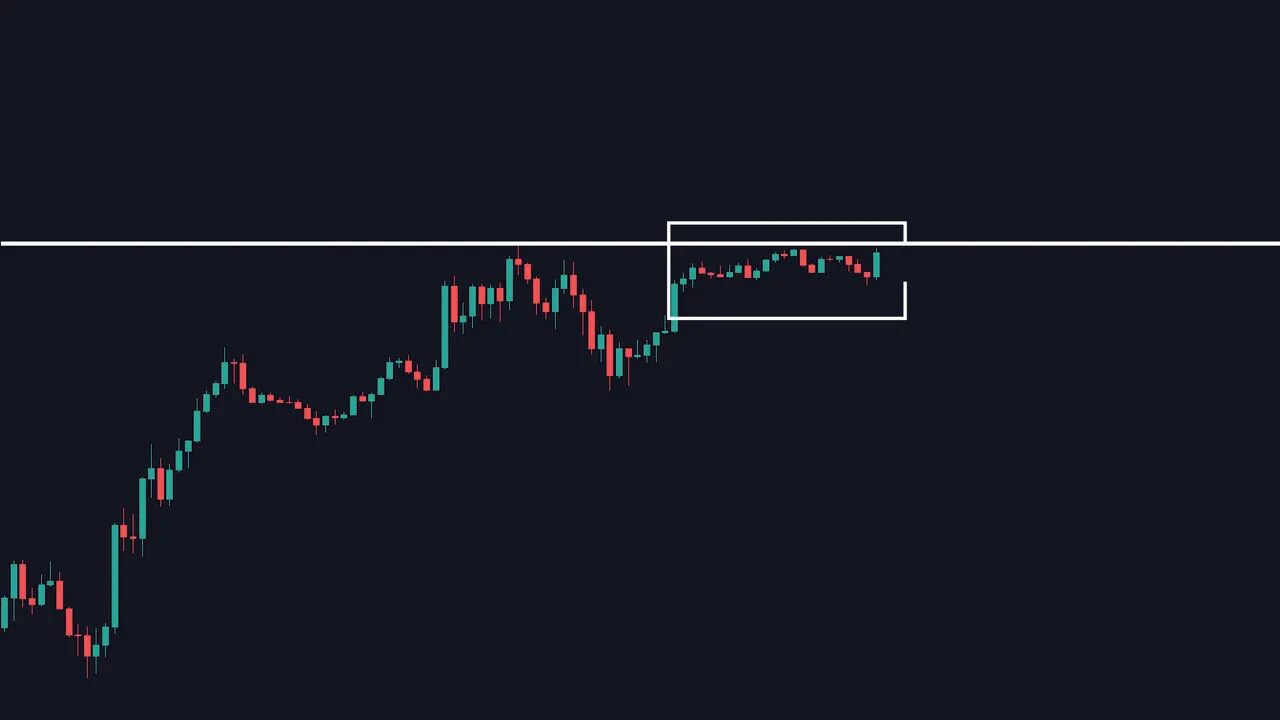
1) Support and resistance retests

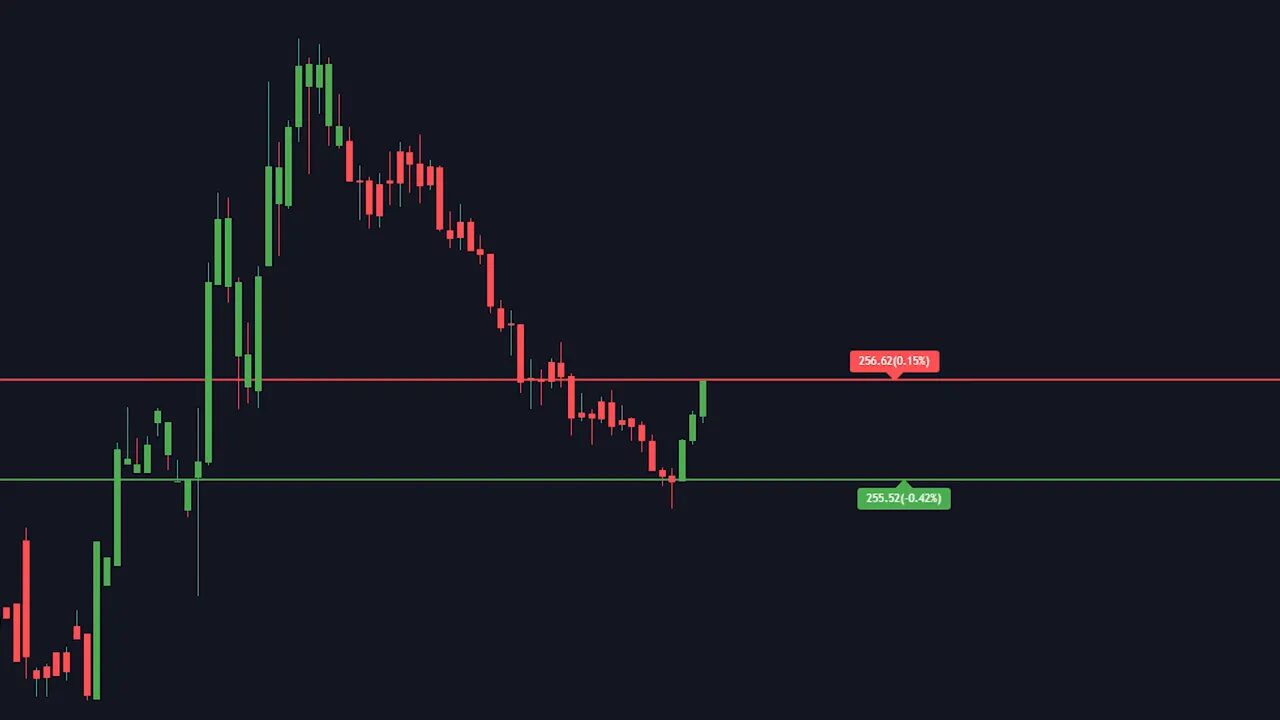
When price breaks through a resistance and then retests it as support at the golden zone, that retest provides a strong reason to expect a bounce. Always zoom in to check whether the broken level aligns with the Fibonacci golden zone.

2) 200 EMA as a trend filter and dynamic support/resistance

The 200 exponential moving average is a heavy-weight tool on higher time frames. On 1-hour and 4-hour charts it frequently acts as a reliable support or resistance. If the 200 EMA sits inside the golden zone, that is a high-value confluence.

Candlestick chart with red 200 EMA and three yellow-circled price retests touching the EMA.

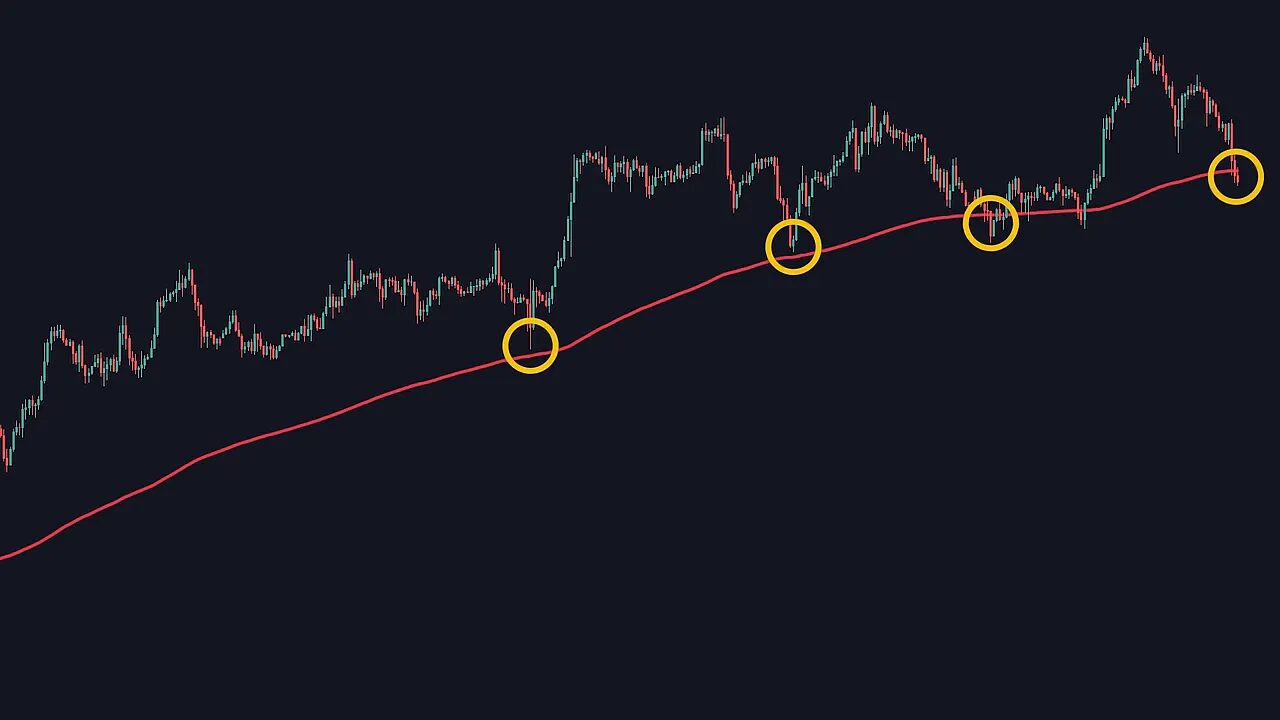
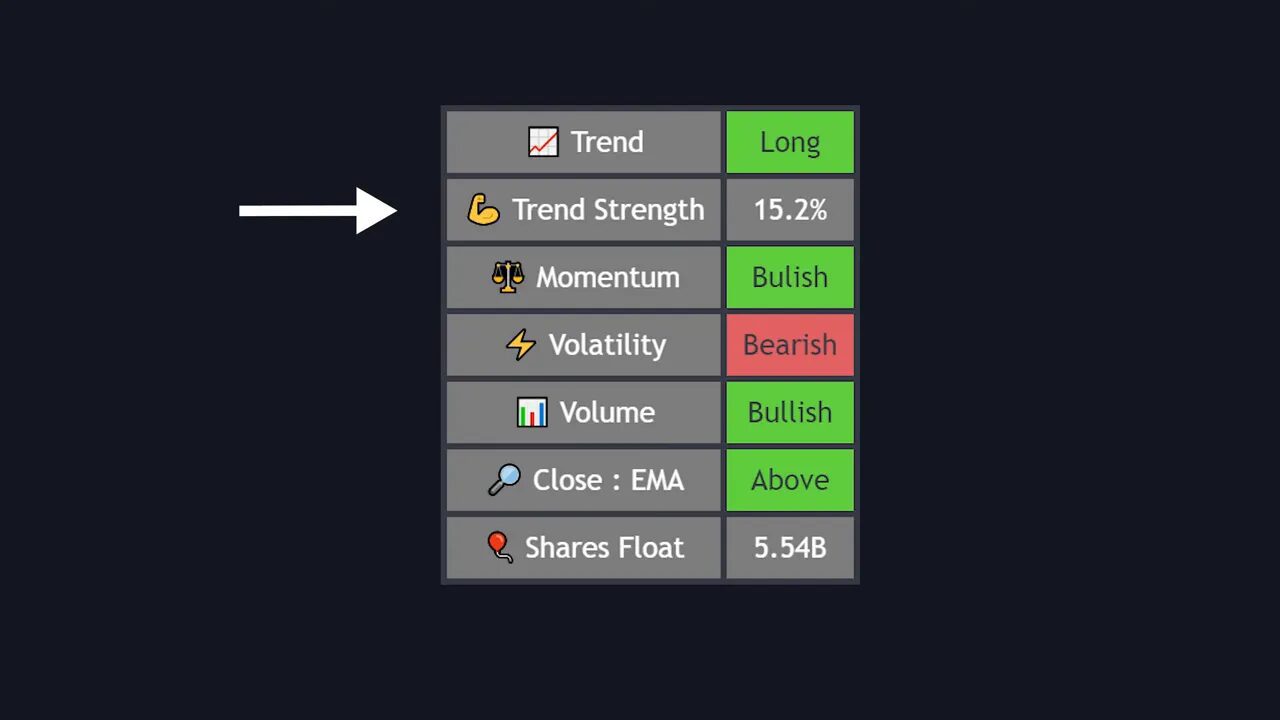
Use the EMA to confirm trend direction: price above the 200 EMA generally favors long entries, price below favors shorts.

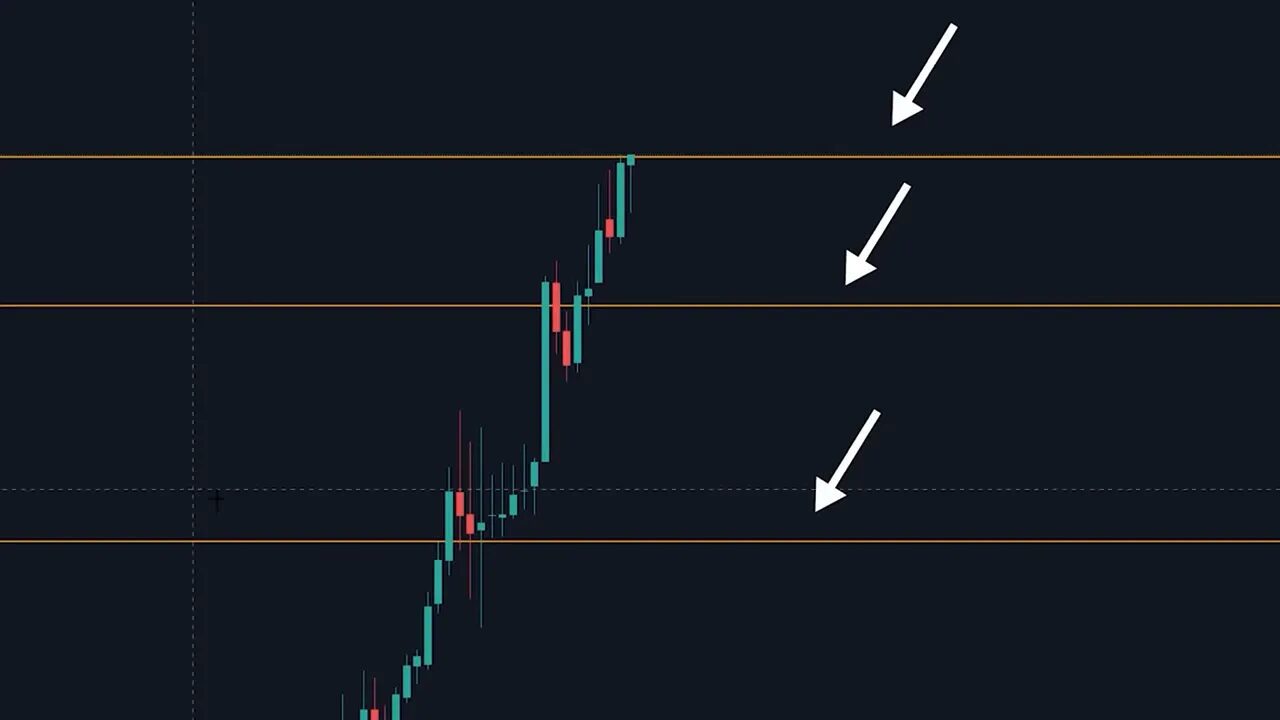
3) Anchored VWAP for institutional reference

Anchored VWAP acts like a value line you choose yourself. Anchor it to the beginning of the strong move (the same red fractal you used for Fibonacci). If the anchored VWAP lies inside the golden zone, you have another independent source expecting price to find value there.

trading chart displaying a single blue anchored VWAP line with candlesticks and fractal markers

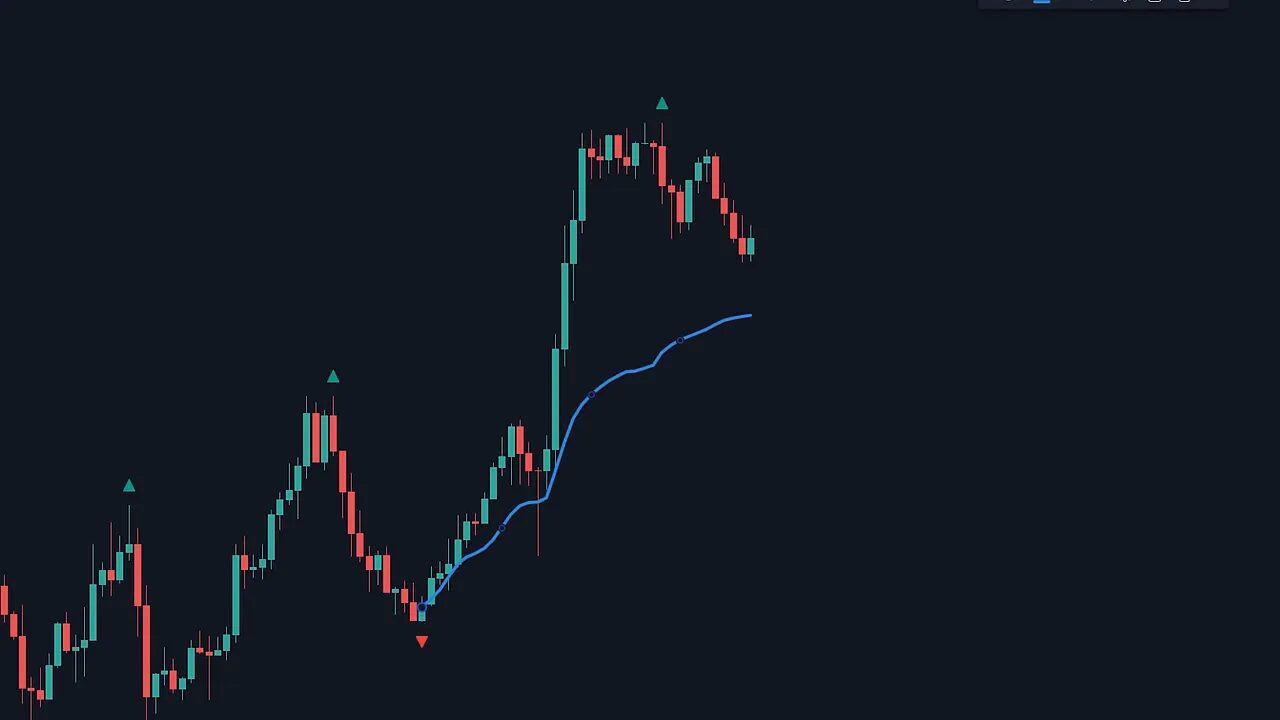
Turn off all anchored VWAP extras and keep the VWAP line only. It behaves similarly to the EMA but is derived from volume-weighted price — useful to see where buyers and sellers have concentrated value.

Putting the setup together — a complete example

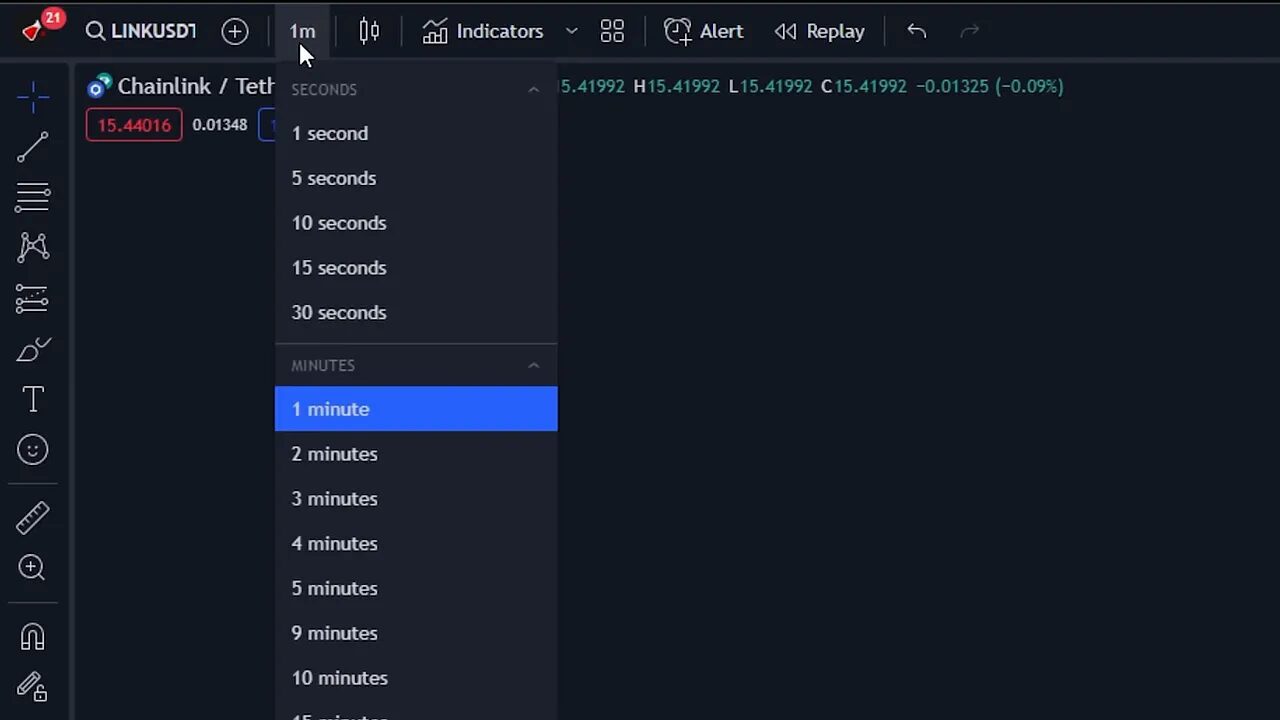
Preferred time frames: 1-hour and 4-hour. For reliability, I favor the 4-hour.

  1. Identify a strong impulsive move and confirm it with a high fractal and a low fractal (period = 10).
  2. Draw Fibonacci from the swing low to the swing high. Note the golden zone between 0.382 and 0.618.
  3. Look for a prior horizontal resistance that price broke and could now retest as support inside that golden zone.
  4. Add the 200 EMA. Confirm it is inside the golden zone or nearby.
  5. Anchor VWAP at the start of the move. Confirm the anchored VWAP sits in the golden zone too.
TradingView chart showing Fibonacci golden zone, 200 EMA, anchored VWAP and a green take profit box

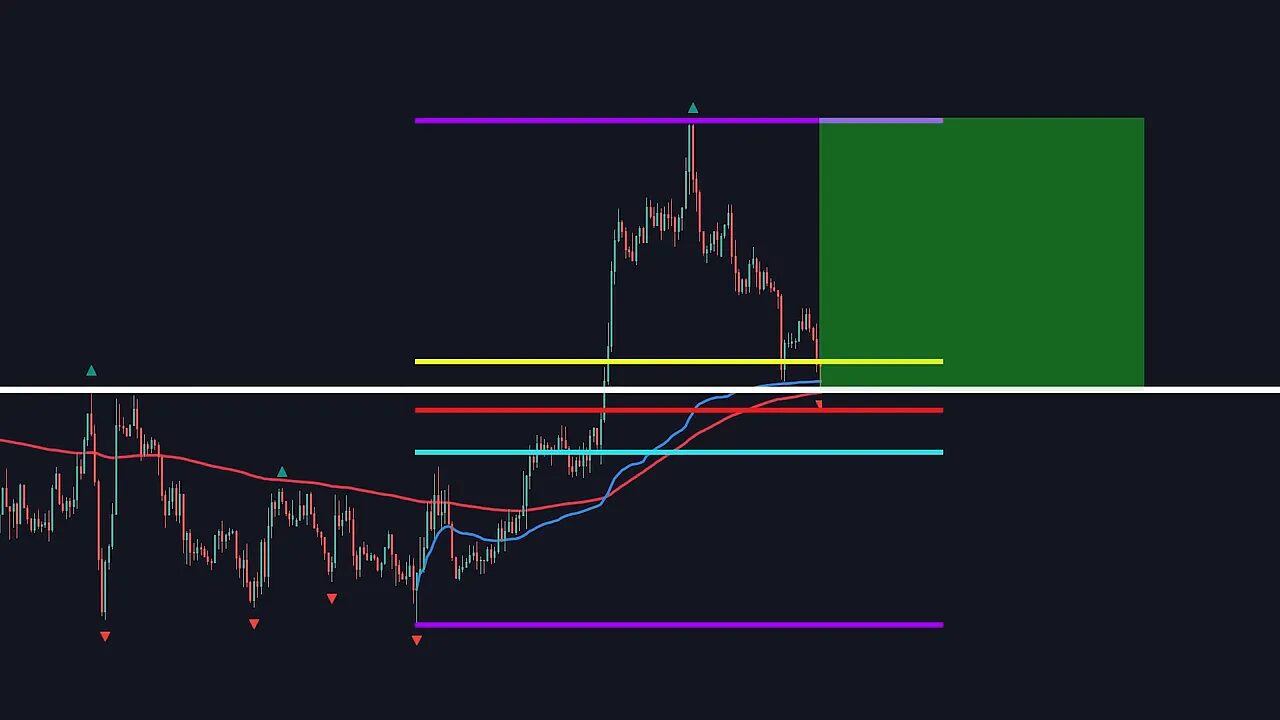
When all four confluences line up — golden zone, retest level, 200 EMA, and anchored VWAP — the probability of a clean bounce is high. I usually place take profit at the high of the impulse move and stop loss just below the golden zone.

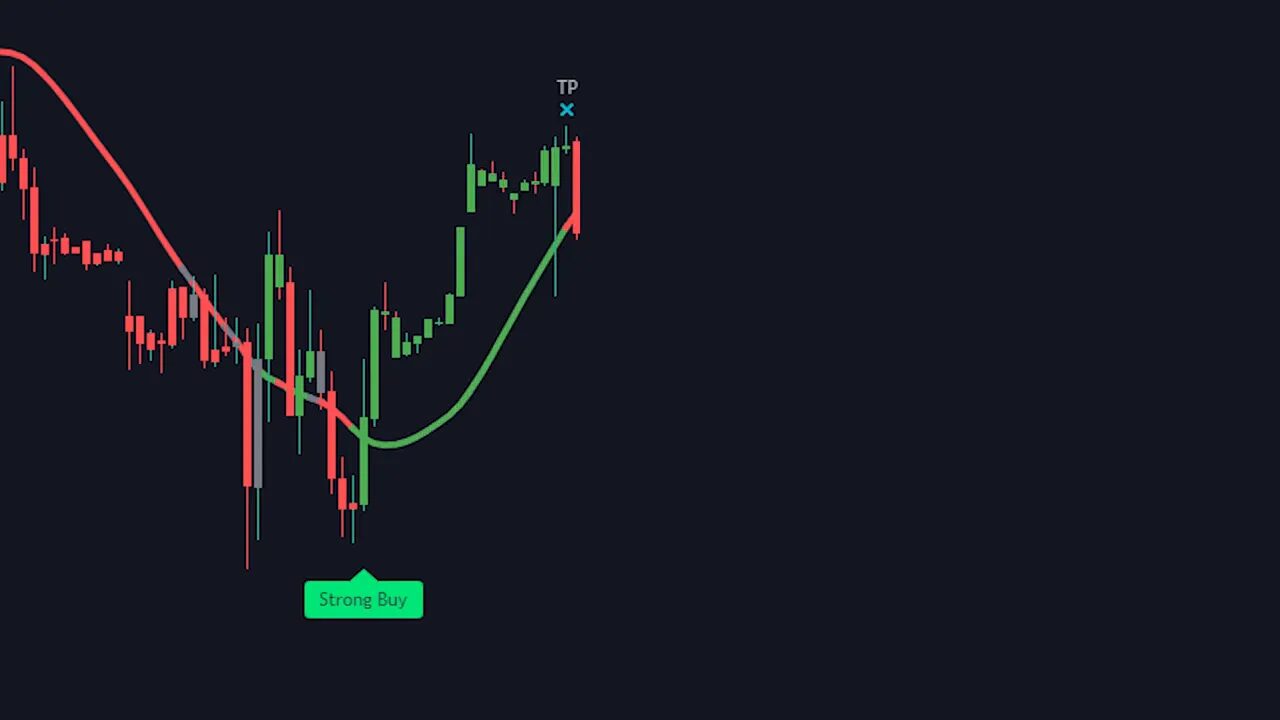
Trade management: entries, stop loss, and take profit

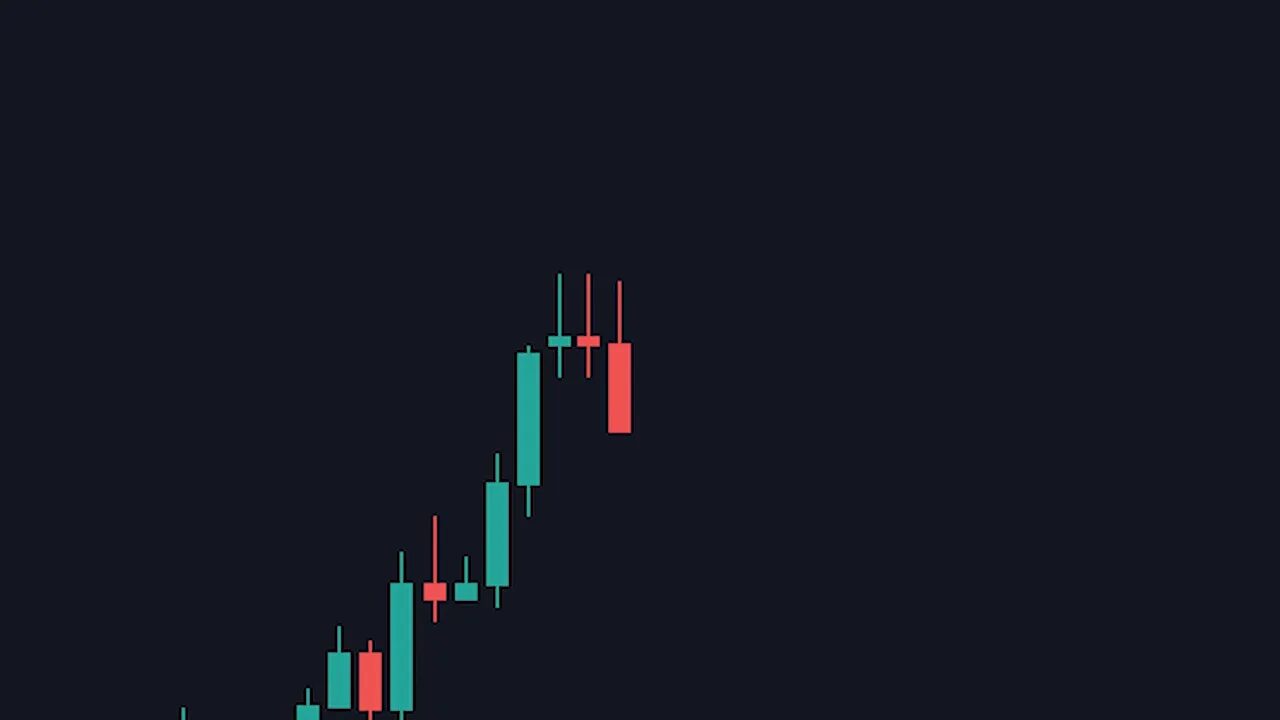
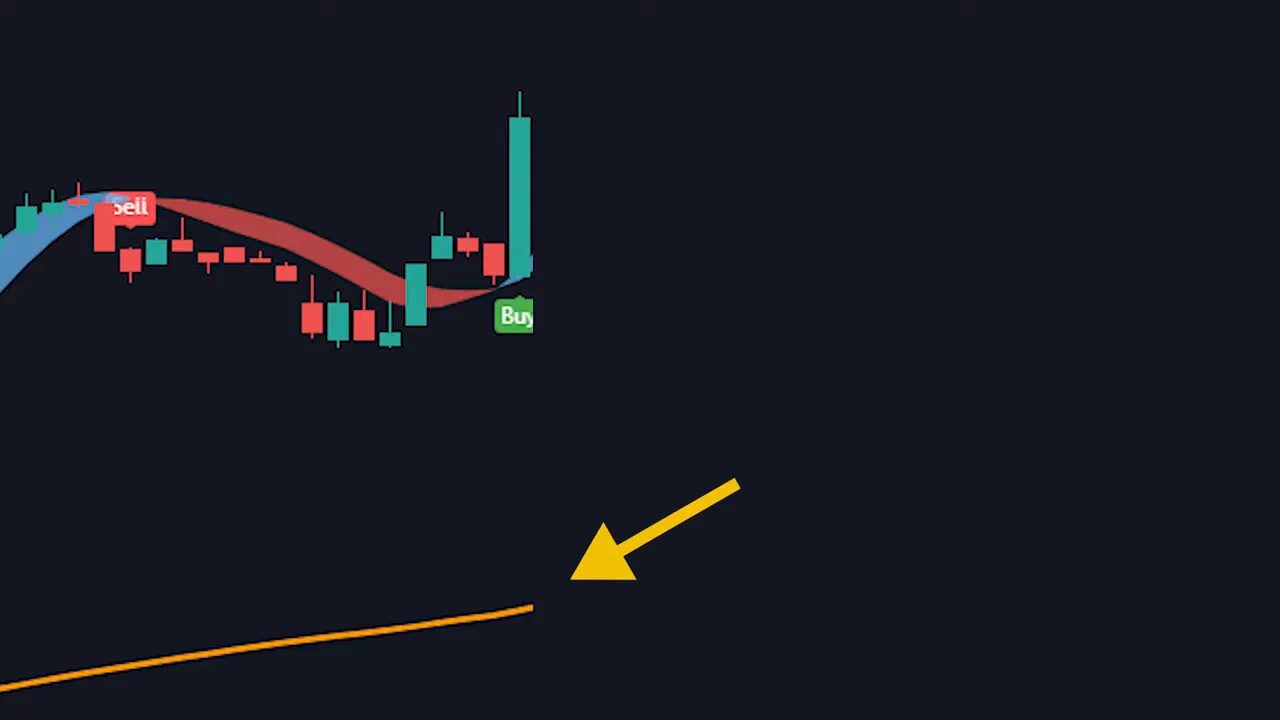
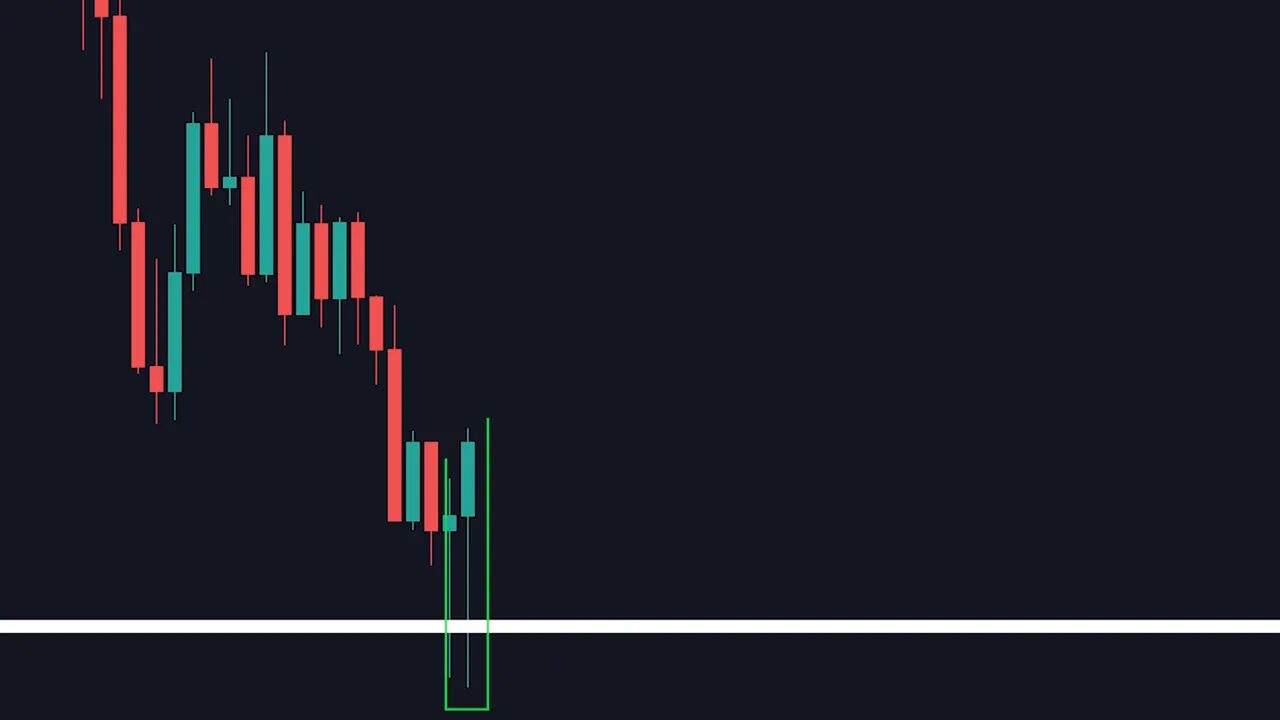
Entry: wait for price action confirmation within the golden zone. That can be a bullish engulfing candle, pin bar, or a clear rejection wick.

Stop loss: place it conservatively just below the golden zone. This keeps risk tight while allowing normal wick action.

Take profit: target the swing high from which the Fibonacci was drawn. You can scale out partials or trail with a moving average depending on your style.

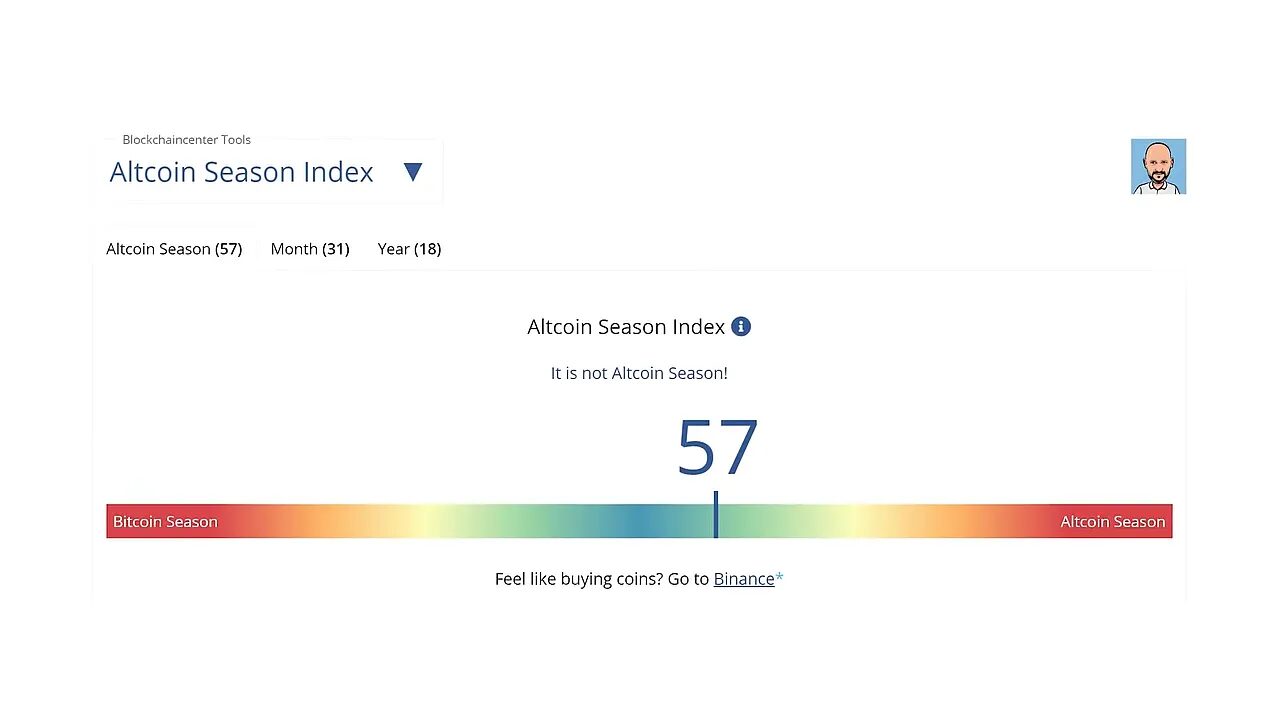
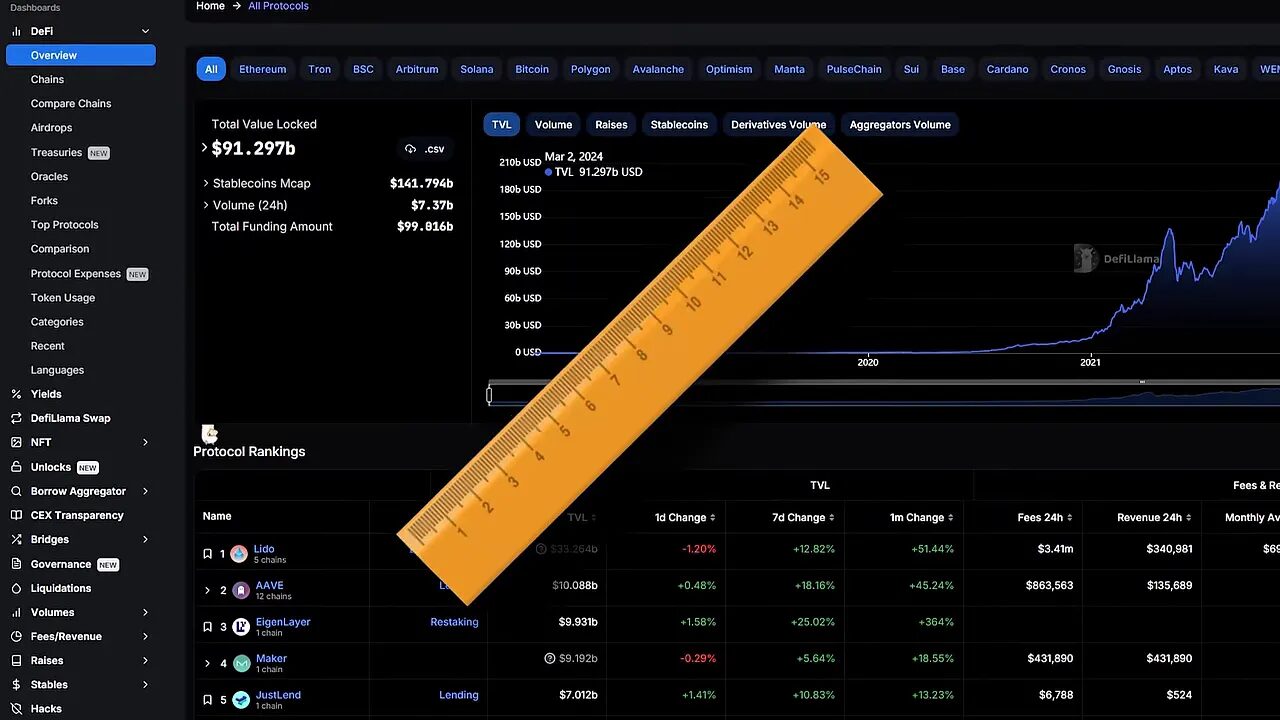
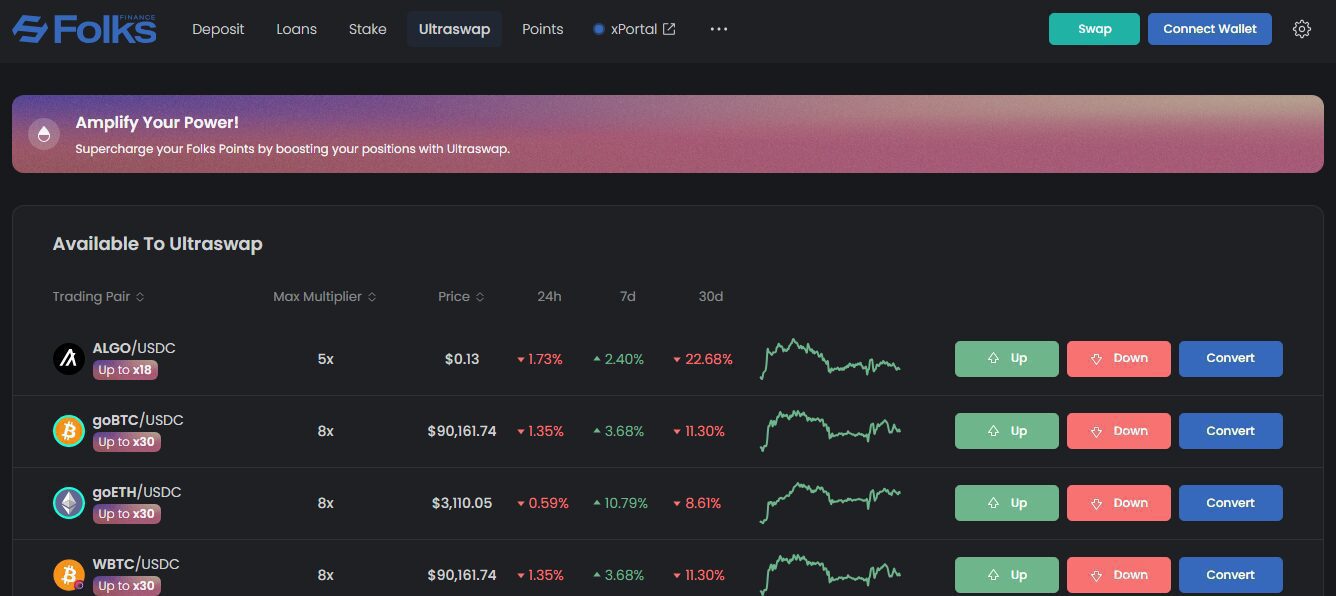
Applying this method to crypto and where crypto trading signals help

This technique translates well to crypto markets, but crypto can be noisier and influenced by different liquidity patterns. On longer time frames, the same rules apply: strong impulsive moves, a clean retrace into the golden zone, and multiple confluences.

For traders who want to apply this across many coins or blockchains, curated crypto trading signals can be a practical complement. Signals that highlight high-volume impulsive moves or mark where value is accumulating let you quickly focus on coins where a Fibonacci golden zone setup might form. Use signals to pre-filter opportunities, then apply the fractal + Fibonacci + EMA + anchored VWAP checklist to take precise entries.

Comparing with supply and demand

Supply and demand zones map nicely to the Fibonacci golden zone concept. A demand zone that happens to fall inside the golden zone is a powerful double confirmation. Conversely, if a supply zone lines up with the golden zone in a downtrend, that strengthens a short setup.

Use the same confluence rules: strong impulse move, clear retrace, and overlapping structural levels.

Which Fibonacci levels should I include for this strategy?

Include 0, 0.382, 0.5, 0.618, and 1. The area between 0.382 and 0.618 is the golden zone and should be treated as your primary retracement target.

What time frames work best for the golden zone strategy?

Higher time frames, such as the 1-hour and 4-hour, produce more reliable signals. The 4-hour is preferred for cleaner, less noisy setups.

How do I pick the correct start and end points for Fibonacci?

Use the fractals indicator set to period 10 to filter for major swing points. Anchor Fibonacci from the confirmed swing low to swing high for uptrends (and vice versa for downtrends).

Where should I place stop loss and take profit?

Stop loss goes just below the golden zone. Take profit is commonly set at the swing high of the impulse move. Adjust size and targets according to your risk management rules.

Can I use this strategy on crypto markets?

Yes. Crypto can be noisier, so stick to higher time frames and favor coins with good liquidity. Using curated crypto trading signals to pre-filter impulsive moves can save time and improve idea quality.

How important are confluences?

Confluences are critical. The Fibonacci golden zone is a powerful base, but stacking it with retests, a 200 EMA, and an anchored VWAP dramatically increases probability and improves entry precision.

How I Made $70,536 Day Trading in 60 Days

0

Table of Contents

Overview: a simple, repeatable 5-step day trading plan

I used a focused, rules-based approach and turned a clear setup into consistent wins over a two month stretch. The strategy is built around identifying liquidity zones, trading only during the early market window, and using a tight, sniper-style entry on the one minute chart. The core elements are simple: define liquidity, wait for a break, drop to a smaller time frame, confirm a market structure shift and a fair value gap, then enter with a well-defined stop loss and take profit.

Why this works

This approach combines three proven concepts: liquidity pools, market structure shifts, and fairness gaps created by fast directional moves. By restricting trades to a specific time window and using a precise entry technique, the setup improves risk reward and reduces random, low-probability entries. It is designed for active day traders using a five minute chart to spot the move and a one minute chart to execute the entry.

Quick visual: marking liquidity zones

Start by marking the swing low and swing high that form the liquidity zone. This zone will be the area price looks to probe or break into.

Step-by-step: the 5 steps

  1. Step 1 — Mark the liquidity zones

    On the five minute chart, draw levels at the chart’s recent high and low to define the liquidity zone. These levels represent where stop orders and resting liquidity commonly collect. Treat them as the boundaries for the next steps.

  2. Step 2 — Only trade between market open and 11:00 ET

    Place two vertical markers from 9:30 to 11:00 Eastern. This early session is where the strategy is valid. If the set conditions form outside this window, skip the trade. The restriction reduces noise and focuses on the highest-probability period for the pattern.

    five-minute candlestick chart with vertical session markers and bold 9:30 and 11:00 labels
  3. Step 3 — Wait for a liquidity break

    Price must break one of the marked liquidity zones. A break lower signals a long opportunity; a break higher signals a short. Do not chase partial probes; wait for a clear break before proceeding.

    candlestick chart with a yellow circle highlighting price probing and breaking the lower horizontal liquidity line near a red session marker
  4. Step 4 — Drop to one minute and confirm market structure

    After the break, switch to the one minute chart to find a sniper entry. Identify the pivot point: the previous swing (for example the previous lower high). Only consider an entry when price breaks that pivot, indicating a market structure shift.

    one minute candlestick chart with red session markers and a blue horizontal liquidity line showing a breakout above the pivot

    Also require a fair value gap — a fast candle that creates a gap between the candle before and the candle after. Mark the top of the first candle and the bottom of the second candle to define the gap. If no fair value gap is created, do not enter.

    One‑minute candlestick chart with the fair value gap shaded as a green rectangle and yellow borders marking the top and bottom of the gap.
  5. Step 5 — Place your entry, stop loss, and take profit

    Set a limit buy or sell order inside the fair value gap. Two common placements:

    • Middle of the fair value gap for a better risk reward
    • Top (for longs) or bottom (for shorts) of the gap for higher probability of fill

    Place the stop loss just below the low of the fair value gap candle. For a more conservative stop, place it below the low of the entire move. Set take profit at the opposite liquidity level you marked in Step 1.

    candlestick chart showing a highlighted fair value gap with a green entry line, a red stop zone below and white horizontal liquidity levels in the background

Live trade walkthrough

Here is how the rules come together in a real trade:

  • Five minute chart shows a defined liquidity zone and the session markers are in place.
  • Price breaks the lower liquidity zone, signaling a long setup.
  • Switch to one minute. Price breaks the pivot (previous lower high) confirming a market structure shift.
  • A fast bullish candle creates a fair value gap. A limit order is placed in the middle of the gap and the stop is set below the gap candle.
  • Price comes back, fills the limit, consolidates briefly, and then rallies up to the take profit at the marked high. Trade closed for a clean win.
candlestick chart showing a filled fair value gap, a tall bullish breakout candle and a large green take-profit area

Checklist before you press trade

  • Are liquidity zones clearly marked on the five minute chart?
  • Is it between 9:30 and 11:00 ET?
  • Has price broken a liquidity zone decisively?
  • On the one minute chart, has the pivot been broken showing a structure shift?
  • Is there a fair value gap to use for a limit order?
  • Is the stop loss placement and take profit set with an acceptable risk reward?

Risk management and practical tips

Position sizing is critical. Use a risk-per-trade that matches your account and mental comfort. Tight stops improve risk reward but can increase the chance of being stopped out. If nervous, use the slightly wider stop below the entire move at the cost of a worse risk reward ratio.

Use TradingView or similar charting software to draw zones and set vertical session markers. The one minute chart is necessary for the sniper entries. Keep a trading journal to track which entries and variations work best for the instruments you trade.

FAQ

What timeframe should I use for spotting the setup and for entries?

Spot the setup on the five minute chart and switch to the one minute chart to execute the entry. The five minute timeframe shows the overall liquidity zones and breaks. The one minute gives a precise sniper entry that improves risk reward.

What exactly is a fair value gap and how do I mark it?

A fair value gap is a fast directional move where a large candle creates a gap between the candle before and the candle after. Mark the top of the first candle and the bottom of the second candle to define the gap area. That gap is where price often returns to and offers a high-probability entry zone.

When am I allowed to enter a trade?

Only enter if all conditions are met: the trade occurs between 9:30 and 11:00 ET, price breaks a marked liquidity zone, the pivot on the one minute chart is broken indicating a structure shift, and a fair value gap exists for placing a limit order.

Where should I place my stop loss and take profit?

Place the stop loss just below the low of the fair value gap candle for a tighter stop or below the low of the entire move for more room. Take profit should be placed at the opposite high or low liquidity level you marked earlier, giving you a defined exit and clear risk reward.

Can this strategy be used on stocks, forex, and crypto?

The principles translate across markets since liquidity, structure, and gaps exist in all liquid instruments. Adjust for instrument volatility, session times, and spread. Forex and crypto may trade 24/7, so keep the same session discipline (an equivalent high-probability time window) for best results.

Final notes

This five-step method is deliberately rule-driven to reduce emotion and increase consistency. It relies on a short, concentrated trading window and a precise entry technique. Backtest the rules on your instruments, start small, and track every trade. The combination of defined liquidity zones, a strict time window, pivot confirmation, and fair value gap entries gives a clean blueprint for repeatable day trading.

This Indicator Predicts the Future: How to Use Next Pivot to Trade Smarter

0

Table of Contents

Outline

  • What the indicator claims to do
  • How it actually works (correlated length and pattern matching)
  • Setup: the exact indicators and settings
  • The trading rules for longs and shorts
  • Common pitfalls and how to avoid them
  • Practical tips, risk management, and extra tools
  • FAQ

What this indicator claims to do — and why it caught my attention

There are loads of fancy indicators out there, but few make a bold claim: predict the next move of price with a projection line. I tried it out and, to my surprise, the projection matched price movement more than once. That got me curious enough to build a rules-based strategy around it. The result is simple, repeatable, and surprisingly robust when combined with a few supportive indicators.

How it works: pattern matching with correlated length

The indicator scans chart history looking for past price segments that closely resemble the current pattern. The key setting is correlated length, which controls how many candles the indicator compares when searching for matches. For example, a correlated length of 20 tells the indicator to compare the last 20 candles to every 20-candle segment in the history and project the most similar continuation.

This is not mystical forecasting. It is pattern recognition: what repeated itself historically may repeat again. That makes the projection useful, but not infallible. That is why the projection should be one input among several, not the sole decision maker.

Next Pivot indicator settings panel showing 'Correlation Length 20' and 'Forecast Length 50' with a hand pointing.

Setup: the three indicators and exact settings

To increase the odds, pair the projection with trend confirmation and volume confirmation. Here are the exact elements I use:

  • Next Pivot (the projection indicator) — this adds two projection lines: a white line for the projected exact price action and a green line for the general projected trend.
  • SSL Hybrid — set the SSL One baseline length to 200 and change the baseline type to McGinley. In the styles tab, show only the MA color and bar color for a cleaner read.
  • Volume Oscillator (TradingView built-in) — use it to confirm whether momentum supports the projected move. I adjust the colors so the lines stand out on the chart.
SSL Hybrid settings dialog showing Inputs, Style, and Visibility tabs with options like Show Baseline and Show ATR bands.

The rules: How to enter a long or short trade

Turn the projection into a strategy by adding simple confirmation rules. The rules keep you out of false positives and make risk management straightforward.

Long trade rules

  • The projection (white line) must be sloping up.
  • The bars and SSL baseline (MA) must both be blue, signaling trend alignment.
  • The volume oscillator must be above zero, showing positive volume momentum.
  • Set stop loss below the recent swing low and take profit at a recent swing high.
Chart showing blue candles, a blue horizontal support, a green projection line and two blue arrows highlighting the entry area and support.

Short trade rules

  • The projection must be sloping down.
  • The bars and SSL baseline must both be red, confirming downside bias.
  • The volume oscillator must still be above zero to confirm directional conviction.
  • Set stop loss above the recent swing high and take profit at a recent swing low.
chart showing a downward projection with a red stop-loss box above and a green take-profit box to the right

Common pitfall: when the projection hits the stop before the target

Even if all confirmations line up, the projection can still show a path that hits your stop loss before your take profit. That is a clear sign to skip the trade. Always visually check the projected path. If the projection suggests the move will go through your stop first, do not enter.

Why this approach works better than using the projection alone

Pattern matching is powerful but not perfect. Adding a trend filter and volume confirmation raises probability by aligning three dimensions:

  • Projection for the likely path
  • Trend (SSL hybrid McGinley 200) for context
  • Volume for conviction

When all three agree, you are trading with history, trend, and momentum — not just a single line.

Practical tips, risk management, and extra tools

Keep your risk per trade small. I place stops at logical swing points and size positions so a stop hit is affordable. Use a demo or small real account to build confidence before scaling up.

If you trade signals.com/blog/crypto-signals-101-everything-you-need-to-know” target=”_blank”>crypto across multiple blockchains, signals that scan pairs and timeframes can save time and point you to the best opportunities. Integrating curated services like crypto spot trading signals helps identify which coins and timeframes are showing alignment between projection, trend, and volume — which is especially useful when markets move fast and scanning manually becomes impractical.

Some traders also prefer brokers or platforms optimized for low latency and tight spreads. Faster execution and lower commissions can make a measurable difference when trading intraday setups derived from projection lines.

Final notes on testing and implementation

Backtest the strategy on different symbols and timeframes before trading live. The indicator’s pattern matching can behave differently on stocks, forex, and crypto. Test correlated length values and the SS L baseline configuration to find what best fits your preferred timeframe.

Keep a trade journal. Record setups, why you entered or skipped a trade, and outcomes. Over time you will learn which market conditions the projection favors and which it does not.

FAQ

Is the projection guaranteed to be correct?

No. The projection is a probabilistic pattern-match, not a certainty. It finds past segments that resemble the present and projects the most similar continuation. Use it with trend and volume confirmation and proper risk management.

What is correlated length and how do I choose it?

Correlated length is the number of candles the indicator uses to compare current price action against historical segments. Shorter lengths capture short-term patterns; longer lengths look for broader structure. Test different values on your preferred timeframe to see which produces the most reliable projections.

Can I use this method on cryptocurrencies?

Yes. It works across markets, but crypto’s higher volatility and 24/7 trading mean you should adjust stops, position size, and correlated length accordingly. Using crypto spot trading signals can help filter the best coin pairs and timeframes where the projection and confirmations line up.

What timeframes work best?

The method is adaptable. Intraday traders may prefer shorter correlated lengths on 5m or 15m charts. Swing traders might use longer lengths on 1h or 4h. Always backtest on your chosen timeframe before trading live.

How should I size positions and manage risk?

Risk no more than a small percentage of your account on each trade. Place stop losses at logical swing points and size position based on distance to stop. If the projection hits your stop in its path to the target, skip the trade.

You’re Using the RSI Wrong: A Better Way to Trade Pullbacks and Reduce False Signals

0

Table of Contents

What the RSI actually measures

The Relative Strength Index is a momentum oscillator that measures the speed and change of price over a set number of bars. It oscillates between 0 and 100 and, despite its fame, many traders use it the wrong way. The indicator was designed to measure strength, not to be blindly treated as a simple overbought/oversold trigger.

Why the typical 70/30 overbought-oversold approach fails

Most traders drop the RSI onto a chart and assume that readings above 70 mean “overbought” and readings below 30 mean “oversold.” That can sometimes work, but often the market keeps trending and gets even more extreme. The result is a lot of losing trades from early mean reversion plays.

Every indicator gives false signals. The goal is to reduce them by improving signal quality so the signals you do trade are more likely to win.

Simple tweaks to make the RSI useful

Two small changes dramatically improve the RSI’s usefulness.

  1. Change the overbought/oversold thresholds from 70/30 to 80/20. This reduces the number of signals and filters out weaker setups so the signals you keep are stronger.
  2. Confirm RSI signals on higher timeframes. If your lower timeframe shows an extreme, check the next higher timeframe. If the higher timeframe is not confirming, skip the trade.

How to use multi-timeframe confirmation

Example workflow:

  • Spot an RSI extreme on your execution timeframe (for example the 1-minute).
  • Check the 5-minute and 15-minute RSI. If both are also at or beyond your threshold, the signal is stronger.
  • If the higher timeframes do not confirm, wait.
Trading platform timeframe menu with '1 minute' selected, showing options for seconds and minutes

Price action confirmation: the final quality gate

Even with 80/20 and higher-timeframe confirmation, you still need a price-action trigger to enter. One clean, high-probability method is the double-bar break:

  • Identify two consecutive candles showing hesitation (weak bars).
  • Enter immediately when price breaks the low (for shorts) or the high (for longs) of both bars. There is no need to wait for candle close once the break occurs.
  • Set the stop loss above the confirming bar (for shorts) or below it (for longs).
Zoomed candlestick chart showing two small hesitation bars at the top of a move followed by a larger red bearish candle (double-bar break example)

Where to take profits

There are multiple valid approaches. Here are two that work well together:

  1. Take partial profits (for example 50%) when the RSI returns to the midline (around 50). The RSI moving from extreme back to the midline is often a sign the momentum leg is cooling.
  2. Take the remaining profits at a structural level such as the VWAP. Adding VWAP to the chart gives you an objective second target.
Price chart with RSI and a bold 50% overlay indicating the RSI midline

Use RSI as a strength indicator for pullbacks

Arguably the RSI’s best use is spotting strength in trending markets rather than forcing mean reversion trades.

Pattern to trade:

  • Identify a clear trend. The RSI should live in an upper quadrant (roughly 50 to 80) for bull trends, or in a lower quadrant for bearish trends.
  • Wait for the RSI to drop to the midline (around 50). This is typically a pullback inside a strong trend.
  • Enter when price/price action confirms the bounce off the midline. Combine this with price action signals (pin bars, double-bar breaks, bullish engulfing, etc.).
RSI line chart showing a pullback to the 50 midline followed by a strong upward continuation

Which markets and timeframes work best

This approach works best in trending markets. If price is chopping sideways, the RSI will bounce between extremes and the pullback strategy will fail. Use higher timeframe context to confirm trend direction before hunting setups on lower timeframes.

Checklist before entering an RSI trade

  • RSI threshold is at 80/20 (or other tightened level).
  • Higher timeframe confirmation. The next timeframe or two align with the signal.
  • Price action trigger (double-bar break or another setup) has occurred.
  • Stop loss placed above/below the confirming bar.
  • Profit plan defined (partial at RSI midline, rest at VWAP or structure).

Final tips

Small changes create big differences. Tightening the RSI thresholds and adding multi-timeframe and price action confirmation reduces false signals and increases trade quality.

Combine the RSI-as-strength approach for pullbacks with price action rules and objective targets like VWAP and you will be trading higher-probability setups instead of guessing mean reversions.

FAQ

What RSI settings should I use instead of the default 70/30?

Try 80/20 to reduce weaker signals. The tighter thresholds give fewer but higher-quality signals. Adjust slightly to suit the asset and timeframe.

Do I always need higher timeframe confirmation?

Yes. Checking one or two higher timeframes helps filter out false signals and ensures you are trading with the dominant momentum.

How do I combine RSI signals with price action?

Look for a price-action trigger such as a double-bar break, pin bar, or rejection candle. Enter on the break of the confirming structure and place your stop just beyond it.

Should I wait for candle closes before entering?

Not always. With a clear break of the confirming bars you can enter immediately. Waiting for close can cause missed opportunities in fast markets, but use discretion depending on your edge.

Where should I take profits when trading RSI signals?

Common approach: take partial profits when RSI returns to the midline (around 50) and take the remainder at VWAP or a nearby structural support/resistance level.

How I Find Altcoins Before They Explode: The Four Tools I Use

0

Table of Contents

Why hunt altcoins and how I think about sector plays

I discovered Render when it was $0.57 and put a big position in. Today it sits around $7.31—about a 12.8x move (~1180%). That kind of return is why I look for promising altcoins early, especially when a sector is just beginning to take off.

Right now the macro theme I was focused on was artificial intelligence. AI momentum from big-cap names creates a tailwind for projects that sit at the intersection of crypto and AI. When a thematic trend accelerates, selecting the right protocol inside that theme can produce outsized returns.

My four-step framework to find high-upside altcoins

I use four simple, complementary tools that together filter for timing, market regime, on-chain fundamentals, and smart money activity. The process:

  1. Check overall market timing with the Bitcoin Rainbow.
  2. Confirm whether it is altcoin season or Bitcoin season via the Altcoin Season Index.
  3. Compare protocols by on-chain health using DeFi Llama (TVL).
  4. Track influential addresses and smart money with Arkham.

Step 1 — Bitcoin Rainbow: high time frame context

The Bitcoin Rainbow looks playful but acts as a surprisingly reliable long-range support and resistance map. It colors zones from “fire sale” up to “maximum bubble” so you can quickly see whether BTC is in a buy or sell band.

Right now, Bitcoin sits in a still cheap area on that tool, which historically has been a reasonable accumulation zone. It also highlights a red flag level—around the hypothetical $140k mark—where I would start tightening exits if price ever reached that extreme.

Important seasonal note: halvings have historically preceded significant rallies. If halving dynamics line up with a favorable rainbow band, it strengthens the case to accumulate selectively.

Step 2 — Altcoin Season Index: are alts ready to run?

Even if Bitcoin is healthy, altcoins do better in a specific regime. The Altcoin Season Index is a simple, visual meter that signals whether gains are concentrating in BTC or across altcoins.

centered Altcoin Season Index display showing number 57 and the rainbow Bitcoin/Altcoin bar

When that bar is low, Bitcoin season is dominant and altcoins typically lag. When it races to the alt side, smaller caps often explode. I only shift heavy alt exposure when the index favors altcoins—this preserves capital and avoids chasing tops.

Step 3 — DeFi Llama and TVL: find on-chain strength

Total value locked (TVL) is how much capital is actively used or staked on a protocol. DeFi Llama lets you compare TVLs across projects. The insight I use is simple: compare TVL to market cap.

DeFi Llama dashboard with TVL chart and protocol rankings

Example: two protocols with similar TVL but very different market caps. If one has a lower market cap while supporting the same TVL, it can offer more upside because the on-chain activity already exists. That mismatch is often where I find gems.

Think of TVL as the amount of real economic activity behind a token. When users must deposit, swap, or stake funds to use a protocol, that creates a practical demand floor for the token economy.

Step 4 — Arkham: follow the smart money

On-chain transparency lets you track big names and whale activity. Arkham aggregates addresses and transactions so you can see what influential accounts are buying and holding.

Arkham dashboard search results showing a highlighted developer entry, listed tokens and associated addresses

Scanning the portfolios of known developers, funds, or skilled traders can reveal early interest in an emerging project. If a high-profile address starts accumulating a token, it is a signal to research that project more deeply—not a guarantee, but a worthy data point.

Putting the four tools together: a repeatable process

I don’t use any single tool in isolation. Here’s the playbook I follow:

  1. Confirm Bitcoin is in a supportive long-term zone with the Bitcoin Rainbow.
  2. Check the Altcoin Season Index to see if alts have favorable momentum.
  3. Use DeFi Llama to screen protocols by TVL-to-market-cap ratio.
  4. Cross-reference names with Arkham to check who is accumulating.

For Render, that checklist lined up: the AI theme had momentum, Bitcoin’s macro timing looked constructive, Render’s on-chain metrics were compelling relative to peers, and smart-money patterns supported the thesis. The result: a sizable gain and still holding because the thesis remains intact.

Practical tips for execution and risk management

Altcoins can deliver enormous returns but also pose outsized downside. Keep these habits:

  • Position sizing: limit any single altcoin to a percentage of your portfolio you can afford to lose.
  • Staging entries: scale into positions as conviction rises rather than buying all at once.
  • Exit plan: set target zones and trailing rules based on both Bitcoin Rainbow and token-specific liquidity.
  • Rebalance: take profits periodically, especially as altcoin season peaks.

If you prefer trade-ready, actionable ideas instead of building every filter yourself, integrating a professional signal stream can speed decision making. Our cryptocurrency trading signals focus on combining macro timing, on-chain metrics, and smart-money cues so you can apply this framework faster.

Where to research and execute

Useful platforms for this workflow:

  • Bitcoin Rainbow charts for macro timing.
  • Altcoin Season Index for regime evaluation.
  • DeFi Llama for TVL and protocol comparisons.
  • Arkham for address-level intelligence.

Combine these with a reliable exchange and proper account hygiene. If you want curated signals that follow the exact combination of timing, TVL analysis, and smart-money tracking, consider exploring cryptocurrency trading signals to augment your own research.

Final thoughts

Finding altcoins before they explode is about disciplined filters and a repeatable process. Themes matter. Timing matters. On-chain fundamentals matter. And so does following where the real capital and attention are going.

If the AI trend continues, there will be more opportunities similar to Render. Using simple, complementary tools increases the odds that the next pick is a high-quality one.

FAQ

What is the Bitcoin Rainbow and why should I use it?

The Bitcoin Rainbow is a visual, color-coded long-term chart that highlights historical buy and sell zones. It helps identify high-level support and resistance bands and aids in deciding when to accumulate or consider exiting large positions.

How does TVL help me find promising altcoins?

TVL measures the capital actively used on a protocol. Comparing TVL to market cap reveals projects where real activity exists but the market cap has not yet priced that activity in. Those mismatches can indicate undervalued opportunities.

When should I favor Bitcoin over altcoins?

Use the Altcoin Season Index. When it indicates Bitcoin season, altcoins typically underperform and it is safer to favor BTC. When it points to altcoin season, smaller caps tend to rally and deserve higher allocation.

Are on-chain tracking tools like Arkham reliable indicators?

Arkham and similar tools reveal real transaction activity from public addresses, which is valuable context. They are not predictive on their own but are powerful when combined with macro timing and on-chain fundamentals to form a conviction.

Can I use this framework without paid services?

Yes. All four tools mentioned have public access points. Paid services like curated cryptocurrency trading signals simply speed up research and package the same signals into trade-ready entries and exits for those who prefer a shorter decision-making loop.

Risk reminder

This is not financial advice. Altcoins carry risk and can be highly volatile. Use proper risk management and only invest what you can afford to lose.

RSI Scalping Strategy: A Simple, Repeatable Setup for Lower Timeframes

0

The goal of this RSI Scalping Strategy is to provide a clear, rule-based approach for trading short-term moves while keeping risk management front and center. The setup uses four indicators, a strict entry checklist, and a layered take-profit system that lets you lock in gains as momentum runs. This method is designed for lower timeframes and scalping, but the core ideas apply wherever you prefer to trade intraday.

Table of Contents

What you need and how to set it up

This strategy runs on TradingView and relies on four indicators:

  • RSI (Relative Strength Index) with a custom smoothing
  • BJ superscript indicator for trend/signals
  • Chandelier Exit to generate buy and sell signals
  • 200-period Exponential Moving Average (EMA) to define trend direction

Indicator settings (exact)

  • Chandelier Exit: style show only buy and sell labels; ATR period = 1; ATR multiplier = 2.3
  • BJ superscript: uncheck visual boxes; set input value to 6; increase line opacity slightly
  • RSI: length = 25; add a moving average to the RSI with MA type = SMA and MA length = 150; hide other lower panel visuals for clarity
  • EMA: set length = 200 (use a contrasting color such as orange)
TradingView RSI settings dialog showing 'RSI Length 25' and the MA Type dropdown with SMA selected, chart visible in background.

These adjustments tighten signals and make the RSI behavior easier to read on fast charts. The combination of a longer RSI MA and the 200 EMA helps filter noise so trades align with higher-probability momentum.

Chalkboard with the word 'RULES' written in chalk and numbered blank lines representing a checklist.

Entry rules — the checklist

Trades are only taken when every condition below is met. This stacked checklist reduces guesswork and enforces discipline.

  1. Chandelier Exit shows a buy signal (visual label)
  2. BJ superscript is showing the bullish color (blue)
  3. RSI line (fast) crosses above its SMA (the RSI moving average)
  4. Price is above the 200 EMA (ensures trend is up)
Price candles with a visible 'Buy' label and the orange 200-period EMA line below indicating an uptrend.

When all four conditions line up, enter long. Place the stop loss at the most recent swing low. For shorts, reverse the rules: chandelier sell signal, red superscript, RSI crossing below its SMA, and price below the 200 EMA. Place the stop at the recent swing high.

Risk management and the four-step take-profit plan

A reliable exit plan matters as much as the entry. This approach uses four staggered take-profit targets and reduces risk as the trade moves in your favor.

  • Divide your position into four equal parts.
  • Set take-profit targets at 1:1, 1.5:1, 2:1, and 3:1 risk to reward.
  • At each target hit, sell one quarter of the original position and move the next target accordingly.
  • Keep the initial stop loss at the swing low until the structure allows tightening it.
TradingView chart showing buy label, green profit zone and red stop zone, 200 EMA and RSI, with the price candle circled at a target.

This method locks profits incrementally while letting the largest portion ride for the biggest potential move. It is especially useful on volatile crypto pairs where momentum can produce chunky runs after a clean entry.

When reviewing market opportunities and trade set ups across blockchains, having a reliable pulse on momentum helps. A subtle but effective way to complement this strategy is to follow curated crypto signal feeds that highlight setups meeting these criteria across multiple tokens. A targeted crypto signal can surface potential trades that already match the checklist so you can evaluate them faster and act when conditions align.

TradingView live example showing a 'Buy' label, green profit zone, orange 200-period EMA below price and the RSI panel with the RSI line crossing its moving average.

Live example: how a trade unfolds

Imagine the setup appears and you enter at point A with a stop at the swing low. Price hits the 1:1 target; you sell 25 percent. It then runs to 1.5:1; sell another 25 percent. When it reaches 2:1, sell a third tranche. If it ultimately makes 3:1, you exit the final piece with a clean, scaled profit. The staging of exits smooths equity curve volatility and improves psychological management of winners and losers.

TradingView chart showing a 'Buy' label, orange 200 EMA, RSI panel and green/red target and stop zones

Backtesting and performance tracking

Testing rules repeatedly is the only way to know how a strategy behaves across different market regimes. Running a 100-trade backtest on real market data provides insights such as win rate, average return, and drawdown behavior. Keep a trading journal with timestamps, entries, exits, and rationale. That data drives improvements and tells you if the approach fits your style and account size.

Close-up of a backtest summary panel showing 'Winrate', 'PnL' and 'Total Trades 100' with an equity chart below.

Practical notes and tips

  • Timeframe: works best on lower timeframes for scalping, but test on your preferred charts first.
  • Slippage and fees: account for exchange fees and slippage when sizing positions and setting targets.
  • Trade size: size positions so a full loss equals a small percentage of capital—never risk more than you can comfortably lose.
  • Automation: if you want to automate rules without coding, consider plain-English backtesting tools that convert instructions into executable trades.

FAQ

What timeframe is best for this RSI Scalping Strategy?

Lower timeframes are recommended for scalping, but you should backtest on the specific timeframe you plan to trade because execution costs and noise differ between 1-minute, 5-minute, and 15-minute charts.

Which indicator settings are most important?

The most important settings are the RSI length = 25 with an SMA of 150, chandelier ATR period = 1 with multiplier 2.3, BJ superscript set to 6, and a 200 EMA for trend. Those values tune noise reduction and trend alignment.

How should I place my stop loss?

Place the stop loss at the recent swing low for longs or the recent swing high for shorts. Adjust only when price structure clearly invalidates the original risk.

Is the four-step take-profit better than a single target?

Layered targets help lock in gains, reduce emotional pressure, and let you capture larger moves while still securing partial profits early. It often produces a smoother result compared with a single hard target.

How can I find setups quickly across many tokens?

Use scanners or curated crypto signal services that filter for the criteria you use. Signals can surface candidates that already meet the checklist so you can evaluate them efficiently across chains and pairs.

Lumia Crypto Review: Why This Token Could Easily Double in the Next Rally

The Lumia Crypto Review below breaks down what Lumia (recently rebranded to Orion), its on-chain activity, products, partnerships, and the core risks that will determine whether it lives up to its promise. If you are scanning opportunities during a bull run, this Lumia Crypto Review gives a practical, balanced view: clear upside potential, solid technology partners, and real questions around tokenization and regulation.

Table of Contents

Quick snapshot: what Lumia is and why it matters

Lumia Crypto Review starts with the business case. Lumia is positioning itself as a next-generation blockchain for real-world assets. It aims to handle the full lifecycle of tokenized assets: from initial tokenization to liquidity aggregation and connectivity with DeFi and Web3 traders. Think tokenized real estate, commodities, and other illiquid assets brought into a liquid, decentralized environment.

CoinMarketCap Lumia market page showing price $0.1220, historical chart and key metrics with presenter video overlay

That sounds compelling because tokenization promises new capital flows into previously illiquid markets. Lumia intends to deliver that through two primary pillars: Lumia Chain for creating compliant, tokenized representations of assets, and Lumia Stream for packaging those assets into liquid financial instruments.

Where the price is and recent market action

Price action in this Lumia Crypto Review matters because the token spent much of the last year in a downtrend. Lately it posted a sharp uptick with a meaningful volume spike. That type of move often draws renewed attention from traders looking for fast gains during a bull cycle.

Supply metrics are important here. Roughly 146 million of a 238 million total token supply are in circulation now. Monthly unlocks are modest at around 6 million tokens and are linked to node emissions and ecosystem growth rather than a classic investor unlock schedule. That reduces the immediate risk of a large dump, though supply unlocks always deserve monitoring.

Technology stack and strategic partners

No Lumia Crypto Review would be complete without covering partners. Lumia is built heavily on Polygon’s CDK, which lets it inherit Polygon’s scalability and network effects while integrating innovative Polygon tech. That helps Lumia scale tokenized asset use cases without rebuilding basic infrastructure from scratch.

  • Key collaborators include Polygon, Binance (listed on several exchanges), DWF Labs, Laser Digital, and TRGC.
  • They also integrated with major DeFi plumbing: Uniswap, PancakeSwap, and bridges across chains like Arbitrum and others.
CoinMarketCap Lumia about page focused on 'Key Partnerships & Collaborations' text and partner descriptions

Those integrations accelerate adoption because tokenization thrives on liquidity and composability. Lumia’s partnerships place it in a practical spot to capture real-world asset projects that need on-chain plumbing, custody, and market access.

Products that form the Lumia ecosystem

This Lumia Crypto Review highlights the product suite because that is where the use cases live. Lumia ships multiple products that map to distinct pieces of the tokenization flow.

  • Lumia Chain: A compliance-first chain for institutional and retail tokenization.
  • Lumia Stream: A liquidity layer designed to bring tokenized assets into DeFi rails so they become tradable and interoperable.
  • Lumia Hub: A no-code tokenization portal that helps asset owners mint compliant tokens.
  • Lumia Wallet: Custody and user experience for holders of tokenized assets.
  • Explorer and BlockBits: On-chain visibility and a Telegram mini-app to onboard users.

Having both a compliance-first chain and a liquidity-focused protocol is smart. One side handles regulatory requirements and identity; the other side makes the assets tradable. That combination underpins Lumia’s pitch to institutions and developers.

On-chain metrics and adoption signals

Adoption indicators are mixed in this Lumia Crypto Review. The blockchain explorer shows about 15,000 transactions per day and roughly 758,000 addresses created. Historical completed transactions are in the low millions. Those numbers indicate activity, but they are not yet at the level of a fully thriving ecosystem.

Active address counts, daily transactions, and the nature of those transactions matter more than raw numbers. Are these simple transfers, or are they tokenization flows, custody operations, and liquidity interactions? At present, the data suggests steady but not explosive usage. That means there is room for growth if the product-market fit sharpens and institutions start tokenizing larger asset pools.

Why the market is skeptical (and why that’s reasonable)

A major theme in this Lumia Crypto Review is skepticism about tokenizing real assets before regulatory clarity and robust risk frameworks exist. Tokenization sounds great in theory, but edge cases create real questions.

Consider this scenario: you tokenize a house, then use that token as collateral in a DeFi lending protocol, and borrow the equivalent of $200,000 in crypto. If the crypto market crashes, collateral liquidations can cascade. Who ultimately holds title to that real-world house? How do courts, custodians, and on-chain protocols reconcile the legal property transfer?

Until those answers are standard and enforceable across jurisdictions, tokenization projects will face conservative adoption. That does not mean tokenization will fail long term. It means phases of adoption, heavy regulation, and institutional frameworks are a prerequisite for scale.

Realistic price expectations in this Lumia Crypto Review

Forecasts are inherently uncertain, but a pragmatic view in this Lumia Crypto Review suggests modest near-term upside and stronger long-term potential. A reasonable expectation is that Lumia could return to roughly $0.25 this cycle—roughly a 2x from lower price points—assuming broader market tailwinds and incremental adoption.

Why not 10x or 100x? Real-world asset tokenization faces several frictions: regulatory uncertainty, custody and legal frameworks, and slower institutional onboarding. Those constraints cap how fast valuation multiples can expand in a single bullish cycle.

Trade setups and risk management

From a trading perspective, Lumia looks like a classic bull-cycle opportunistic trade. The recent retracement and volume spike suggest short-term momentum. For traders, consider these practical rules:

  • Position size matters. Treat Lumia as a speculative allocation within a diversified crypto portfolio.
  • Watch unlock schedules and on-chain flows. Monthly unlocks of ~6 million tokens are manageable but worth monitoring.
  • Use technical levels for entries and exits; the market has shown swift re-rating in short windows.

And if you prefer signals to eliminate guesswork, integrating a reliable crypto trading signal can help you time entries and exits with data-backed trade alerts. A quality crypto trading signal service can add discipline in volatile moves and suggest stop loss and take profit levels tied to current on-chain momentum.

Where Lumia fits in a longer-term portfolio

This Lumia Crypto Review views the token as a thematic bet on tokenization. If you believe real-world asset tokenization will grow exponentially over the next five to ten years, Lumia is a plausible infrastructure play. It has partnerships, a working product suite, and a strategy that targets institutional compliance and retail accessibility.

Allocate accordingly: a small, conviction-sized core position for the long term, complemented by a tactical position for the next cycle’s upside. Rebalance as regulatory clarity emerges and as actual tokenization projects onboard real assets onto the chain.

Opportunities across chains and liquidity paths

Lumia’s integrations with Polygon and major DEXs mean tokenized assets could flow across chains and into familiar liquidity pools. That matters because liquidity begets price discovery. Lumia Stream is designed to create that liquidity, and integrations make it easier for asset-backed tokens to show up where traders already operate.

Using a crypto trading signal alongside cross-chain liquidity monitoring can spotlight when tokenized assets begin to attract serious volume. Signal services often highlight liquidity shifts and emerging pair volume—helpful when evaluating whether tokenization is moving from concept to capital.

High‑clarity CoinMarketCap Lumia page showing the 'Key Partnerships & Collaborations' section and left-side market metrics (price, supply), with a small presenter window.

What to watch next: catalysts and red flags

For anyone following this Lumia Crypto Review, monitor these items closely:

  • Institutional tokenizations: announcements that real estate firms, commodity traders, or funds are minting assets on Lumia Chain.
  • Regulatory clarity: legislation or rulings that define how tokenized assets are treated in major markets.
  • Liquidity events: large pools appearing on DEXs or tokenized assets being used as collateral in mainstream DeFi products.
  • Exchange listings: additional major exchange support improves access and price discovery. Current exchange coverage includes several major platforms, but watch for broader listings.

Red flags include: sudden large token sells tied to team or investor unlocks, regulatory crackdowns in key jurisdictions, or evidence that on-chain tokens are not legally enforceable representations of real-world titles.

Summary and where Lumia sits in the market

This Lumia Crypto Review concludes with a balanced take: Lumia is an interesting infrastructure play that is well positioned on the technology and partnership front. Short-term upside of roughly 2x is a reasonable base case during a supportive market environment. Long-term, Lumia could capture real value if tokenization scales, but that outcome depends on legal frameworks and robust custodial practices.

If you are looking for practical tools to manage trades and spot market momentum, consider a disciplined approach that includes both fundamental monitoring and actionable trading tools like a trusted crypto trading signal. Signals can streamline timing and help avoid emotion-driven mistakes during volatile rebounds.

Frequently asked questions

What is Lumia and why is it important?

Lumia is a blockchain focused on tokenizing real-world assets and creating liquidity for those assets through Lumia Chain and Lumia Stream. It aims to make otherwise illiquid assets tradable on DeFi rails while providing compliance tools for institutions and retail users.

Is Lumia the same as Orion?

Yes. Lumia has rebranded to Orion in some communications. The underlying product suite and strategy remain focused on real-world asset tokenization and liquidity solutions.

What are the main risks to Lumia’s success?

Key risks include regulatory uncertainty, legal enforceability of tokenized assets, custodial and title transfer complexities, and potential token unlocks that could increase circulating supply. The most critical single risk is the lack of standardized legal frameworks for tokenized ownership across jurisdictions.

What short-term price move is realistic?

A conservative short-term view is that Lumia could double from lower levels and return toward roughly $0.25 in a bull cycle if market conditions and adoption signals align. Larger multiples are possible but rely on faster regulatory clarity and big institutional tokenizations.

How should I trade Lumia?

Treat Lumia as a speculative, thematic trade. Use position sizing, monitor unlock schedules and on-chain flows, and set clear stop losses. Combining fundamental monitoring with a disciplined crypto trading signal can improve timing and risk management for both short-term and long-term positions.

Which on-chain metrics should I watch?

Track circulating supply changes, daily transaction counts, active addresses, and liquidity on major DEXs. Also watch for real-world asset tokenization announcements that tie actual asset pools to the chain.

Closing thoughts

This Lumia Crypto Review is a practical, no-nonsense look at an infrastructure project that sits at the intersection of traditional finance and decentralized liquidity. The core idea—making real-world assets tradable and composable—has genuine long-term merit. But adoption will be incremental, framed by legal and regulatory maturation.

If you choose to act, do so with a plan: allocate conservatively, follow on-chain data closely, and consider pairing your research with operational tools like a reliable crypto trading signal to help you execute with discipline during volatile phases.

The Most Powerful Strategy I’ve Found Yet: Fair Value Gap Short Setup

0

Table of Contents

Why this setup stands out

I use this fair value gap strategy all the time because it consistently delivers asymmetric risk to reward. The idea is simple: combine a key resistance level, a false breakout, a confirmation of downward momentum, then enter on a fair value gap using the GAN box 50% midline for an optimal entry. Most trades give you massive upside with minimal downside, so you only need a small win rate to be profitable.

What is a fair value gap?

A fair value gap appears when price explodes in one direction so quickly that the other side (buyers or sellers) never had time to fully react. That creates an imbalance on the chart — price naturally wants to come back and test that gap. You can mark it by taking the wick before the big move and the wick after it; the area between those wicks is the fair value gap.

Step-by-step strategy

1. Identify a key resistance (or support for longs)

Use a recent swing high or go up to a higher timeframe (for example the one hour) and mark a strong resistance level. This is the structural area where the move either fails or breaks.

Candlestick chart showing a clear horizontal resistance line across recent highs

2. Wait for a fakeout

A fakeout is when price briefly breaks the resistance and then reverses back below it. The reason this matters is behavioral: traders enter longs on that breakout and place stop losses just below the break. When the breakout fails and price returns, those stops fuel the downward momentum you want for a short.

Candlestick chart showing a false breakout wick above a horizontal resistance line circled in green

3. Confirm the start of a downtrend

Look for two lower lows after the fakeout. Two lower lows are a simple, high-probability signal that the market is beginning a downward move. When this aligns with a recent false breakout, the bearish bias is strong.

4. Find the bearish fair value gap on the pullback

On the swing back up after the second low, identify any bearish fair value gaps. If multiple gaps appear, use the highest (closest to price) fair value gap as your target — it typically offers the best risk to reward.

Candlestick chart showing a pullback with a highlighted bearish fair value gap box (red) near the recent highs

5. Use the GAN box to set your entry at the 50% mark

Place TradingView’s GAN box on the ends of the fair value gap, then set the display so it draws a line exactly in the middle. Price commonly revisits that 50% midline and rejects. When it does, that’s your entry trigger.

TradingView chart with a grey GAN box placed over a bearish fair value gap showing the 50% midline and blue selection handles

6. Stop loss and take profit rules

Set your stop loss at the recent swing high for a tighter, higher R:R entry, or above the original resistance if you want extra buffer. The primary take profit should be the low where the original move started. For higher win rate, scale out at key hesitation zones observed during the prior move up.

How I manage the trade

I like to scale out to guarantee profits along the way. A common approach: sell 25% at the first hesitation level, another 25% at the next, and let the remainder run to the final target. This locks in gains while allowing the strong momentum to capture the rest.

TradingView-style chart showing a bearish pullback and support with a clear '25%' label marking the first partial exit level.

Quick checklist before you enter

  • Key resistance identified on a higher timeframe.
  • False breakout confirmed (price breaks, then reverses).
  • Two lower lows formed after the fakeout.
  • Bearish fair value gap present on the pullback.
  • Entry at GAN box 50% midline of the fair value gap.
  • Stop loss at recent swing high (or above resistance).
  • Take profits scaled at hesitation levels and final swing low.

Why the math works

This setup frequently produces large potential rewards with small stop distances, giving a favorable risk to reward. If your average trade risks 1 unit to make 4 or more units, you only need a win rate of around 25 percent to be profitable. Combine that with partial exits to lock gains and you get a very resilient approach.

Applying this across markets: forex, stocks, crypto

The structure behind fair value gaps and fakeouts is market neutral. Whether you trade EUR/USD, individual stocks, or cryptocurrencies, the same mechanics apply. Crypto markets often have sharper moves and deeper imbalances, so fair value gaps can be especially pronounced there. If you trade crypto, consider pairing this setup with timely market alerts — free crypto signals can help you spot large imbalance moves across different blockchains and save time scanning multiple pairs.

Extra tips

  • Prefer the highest bearish fair value gap for a short entry when multiple gaps appear.
  • Use higher timeframes to validate major support and resistance.
  • Check for confluence: volume spikes, cluster stops, or macro news that support directional bias.
  • Practice the entry technique on a demo account first to get comfortable with the GAN box midline timing.

Tools that speed this up

TradingView’s GAN box is essential for precisely marking the midline. There are also indicators that automatically highlight fair value gaps and color-code them bullish or bearish, which can save time when scanning multiple markets.

What exactly is a fair value gap and how do I draw it?

Draw a fair value gap between the wick before a strong one-directional candle and the wick after that move. That empty area represents market imbalance where the counter side did not fully respond. Price often returns to test that zone.

Where should I place my stop loss?

Place your stop loss at the recent swing high for a tighter R:R, or above the original resistance level for more room. Tighter stops give better risk to reward but increase the chance of being stopped out.

Does this work on crypto markets?

Yes. Crypto tends to have stronger spikes and deeper imbalances, so fair value gaps can be very effective. Combining this structure with timely alerts, such as free crypto signals, can improve your entry timing across multiple coins.

How many trades do I need to be profitable?

If your average win is 4x your loss, you only need roughly 1 out of 4 trades to win to be profitable. Risk management and partial exits further reduce breakeven thresholds.

What if price never returns to the fair value gap midline?

Missed trades are part of the game. Wait for the next valid setup. It is better to skip the trade than to force an entry with poor R:R. Patience preserves capital and keeps your edge intact.

I Created The World’s BEST Indicator (seriously)

0

Table of Contents

Why one indicator can replace a toolbox

After months of development and relentless backtesting, a single indicator can now combine real-time buy and sell signals, optimized take profit targets, automatic support and resistance, a trend metrics table, fair value gap detection, and several popular indicators prebuilt — all inside one chart overlay.

The goal is simple: reduce clutter, speed up decision making, and give traders a reliable set of signals they can tune to their risk profile. The result is an indicator designed for all liquid markets — stocks, Forex, crypto, futures — and built to be both customizable and practical.

What’s included (features that matter)

  • Real-time entry signals: Strong Buy, Buy, Sell, Strong Sell for clearer probability differentiation.
  • Optimized take profit marks: Two take profit targets generated automatically based on your sensitivity setting.
  • Automatic support and resistance: The indicator shows the closest support and resistance lines so charts stay clean and actionable.
  • Trend table / key metrics: One-glance data including trend, trend strength, momentum, volatility, volume, EMA close, and stock flow to validate signals.
  • Fair value gap detection: Auto-draws imbalances (bullish or bearish) so you can trade retracements into those zones.
  • Customizable sensitivity: Tune aggressiveness for entries, take profits, and more.
  • Extras built-in: Daily pivot points and other common indicators are preinstalled so you do not need separate paid tools.

Best timeframe and market scope

Backtests point to the three-hour timeframe as the sweet spot for this indicator. It performs on any timeframe and market with sufficient volume, but the three-hour chart balanced signal frequency and reliability best in testing.

Entry types and a simple trade workflow

There are four entry classifications: Strong Buy, Buy, Sell, Strong Sell. Strong signals carry a higher probability, but regular signals still provide useful entries when confirmed with additional context.

chart showing Strong Buy label at a swing low, green moving average and TP marker

A recommended trade flow:

  1. Enter on a Buy or Strong Buy (or short on Sell / Strong Sell).
  2. Take partial profits at the first take profit mark (suggestion: 25% to 75% depending on risk tolerance).
  3. Close the remaining position at the second take profit mark.
  4. If price consolidates or reverses near a pivot or resistance, consider closing early to preserve gains.

How to avoid false signals

No indicator is perfect. False entries are most common during consolidation. Two features help avoid these traps: the trend table and the customizable baseline.

Centralized trading indicator trend table with an arrow pointing to it showing Trend=Long, trend strength, momentum, volatility, volume, close: EMA and shares float

The trend table displays multiple metrics at a glance. For a high-probability long, most metrics should be bullish. For shorts, most metrics should be bearish. If the majority of metrics contradict the entry signal, treat that signal as low probability and skip it.

The baseline acts as a quick filter. Only enter longs when the baseline is green. If the baseline is red or gray, avoid long entries. Some traders even use the baseline color as a standalone signal, though combining it with signal arrows and trend metrics is safer.

Automatic support and resistance — use them as tactical exit and stop points

The indicator automatically draws the nearest support and resistance lines in real time so charts do not become cluttered with dozens of manually-drawn levels. Use these lines as potential take profit points or stop loss anchors.

Clean candlestick chart with automatic red resistance and green support horizontal lines and labeled values

Practical uses:

  • Close a portion of your position when price reaches a nearby resistance even if no take profit signal appears.
  • Place stop losses beneath a key support or a daily pivot point.
  • If price breaks a daily pivot or major support, consider exiting even absent an exit arrow; a break of a daily pivot is a strong bearish sign.
  • Manually mark strong daily turning points for higher-confidence take profit levels when you want extra safety.

Fair value gaps — what they are and how to trade them

A fair value gap occurs when price moves very quickly in one direction, creating an imbalance where the opposing side did not have time to participate. Market mechanics tend to retrace to these gap areas to fill the imbalance before continuing.

Candlestick chart with green fair value gap rectangle and a pink arrow pointing to the imbalance zone to illustrate the concept.

How to trade a fair value gap:

  1. Wait for the indicator to draw the imbalance rectangle (green for bullish, red for bearish).
  2. Wait for price to retrace into the rectangle, ideally to the halfway mark for the best risk to reward.
  3. Enter at that zone, place stop loss below the swing low (for longs), and target the recent high as a take profit.

Notes: higher-timeframe imbalances carry more weight. Be prepared to miss some setups — only take the ones that provide a proper risk/reward and confirmation from volume, price action, or divergence.

Putting it together — combining tools for higher win rates

The indicator is powerful on its own, but it performs best when combined with strong trade management and complementary techniques:

  • Volume analysis to confirm moves
  • Price action and pattern recognition
  • Divergences and momentum confirmations
  • Daily pivot points and manual higher-timeframe support/resistance
  • Strict position sizing and stop placement

The goal is not to follow arrows blindly. Use the indicator as the backbone of your strategy and layer on your own checks to filter low-probability signals.

Settings and quick optimization tips

  • Sensitivity: Raise sensitivity for more signals and tighter take profits; lower sensitivity to reduce noise.
  • Timeframe: Try the three-hour chart first based on backtests, then adapt to your schedule and risk tolerance.
  • Entry types: Prefer Strong Buy/Strong Sell signals for higher probability trades, but validate regular signals with the trend table.
  • Enable key metrics and baseline to reduce false entries significantly.

Final thoughts

A single, well-engineered indicator can drastically reduce decision fatigue and provide high-quality trade setups when used correctly. The real advantage comes from combining automated signals with human judgment: trend context, support and resistance, volume, and disciplined risk management.

If you want to explore more, the indicator is part of a larger toolkit available at tradinglab.ai.

FAQ

What timeframe should I use with this indicator?

Backtests showed the three-hour timeframe providing the best balance of signal quality and frequency, but the indicator works on all timeframes and markets with sufficient volume. Adjust to your trading style and test before committing.

Which markets are supported?

Any liquid market: stocks, Forex, crypto, futures. The indicator relies on volume and clean price action, so thinly traded assets may produce unreliable signals.

How do I avoid false signals during consolidation?

Use the trend table and baseline. If most trend metrics contradict the signal or the baseline color disagrees, skip the trade. Confirm with volume and support/resistance before entering.

What is a fair value gap and how should I trade it?

A fair value gap is an imbalance created by a fast price move where the opposite side did not participate. Trade retracements into the gap, preferably to the halfway mark, place stop loss beyond the swing low/high, and target the recent high/low for exits. Higher timeframe gaps carry more significance.

Can I use the indicator for automated trading?

The indicator provides real-time signals and metrics that can inform automated systems, but any automation should be thoroughly backtested and include proper risk controls. Manual confirmation layers improve robustness.

“You shouldn’t just blindly follow buy and sell entries; incorporate other trading techniques on top of the indicator to improve it that much more.”

Price Action Is Hard (Until You See This)

0

Table of Contents

Why pure price action beats indicator noise

Price action is the market speaking in its own language. If you learn to read it, you stop reacting to lagging indicators and start anticipating moves. That does not mean every signal works. It means you focus on patterns that show real shifts in control between buyers and sellers. Over time, that skill separates consistently profitable traders from the rest.

How to approach these setups

Look for context first: the dominant trend, clear support and resistance, and the momentum behind each move. Then use simple rules for entries and risk. Below are the high-probability price action secrets that I use repeatedly: flags, bear traps, deceleration at supply, the triple tap, and the breakout buildup. Each one is easy to spot once you know what to look for.

1. Flag patterns: continuation and ideal add-on spots

A flag is a continuation setup that appears after a strong directional move. You get a steep, decisive leg in one direction, then a shallow, corrective channel that looks like a flag.

The key detail: the corrective flag must be much shallower than the initial trend. That shallow angle tells you buyers are present but weak. Sellers still control the market, so the most logical trade is to enter in the direction of the prior trend when price breaks the flag.

Entries and variants:

  • Enter on the breakout of the flag trend line for an aggressive entry.
  • Wait for a retest of the broken trend line for a safer entry and tighter stop loss.

Watch how momentum behaves on the move after the breakout. A fast, impulsive drop following a flag often leads to a period of consolidation. If that consolidation breaks in the direction of the impulse, adding to shorts or re-entering on the break is often a high-odds decision.

Crypto traders: if you trade multiple coins across blockchains, consider using crypto signals that scan for flag breakouts and retests. A reliable signal service can surface these setups quickly, so you do not miss short-term add-on opportunities.

2. Bear traps: profit from stopped-out shorts

A bear trap happens when price breaks a support level and spooks breakout short sellers and profit takers, only to reverse back above that support. Thinking like the short seller helps you spot these traps: most will take profit near obvious support and place stops just above it.

Candlestick chart with a green box highlighting a wick that falsely breaks a horizontal support line before reversing.

Why this setup flips into a bullish engine:

  • Short covering from breakout traders helps fuel the reversal.
  • A bullish momentum candle such as an engulfing candle adds conviction.
  • If the false-break happens more than once at the same level, it becomes a very strong sign sellers lack follow-through.

Trade plan: wait for price to reclaim the broken support (now resistance-turned-support) or break the resistance that held during the trap. Enter on the confirmation candle or on a retest.

If you trade crypto, a signals service that flags repeated false-breaks and momentum candles across exchanges can save time and highlight the most promising bear trap reversals.

3. Deceleration at supply: shrinking bullish candles

Deceleration shows up when price reaches a supply zone and the candles lose size and conviction. A strong uptrend should display increasing bullish candle size. When candles shrink at supply, that shrinking indicates buyers are tiring.

Candlestick chart showing a large bullish impulse into a green supply zone followed by noticeably smaller bullish candles (arrows indicating shrinking candles)

How to act:

  • Drop down to a lower timeframe to find a clear support or trend line inside the supply rejection.
  • Look for a breakout lower inside that micro pattern. If the move retests and forms a bull trap, the downtrend often resumes.

Using lower timeframes refines risk and lets you place tighter stops while waiting for confirmation rather than guessing the reversal at the higher timeframe supply zone.

4. The triple tap: spotting trend exhaustion

The triple tap is a reversal setup that signals an uptrend is losing steam. It is simply three attempts to make a new high where each attempt becomes weaker than the last.

Candlestick chart with the top three highs circled, showing a triple tap/exhaustion pattern.

Warning signs to watch for:

  • Each successive high is smaller or barely improves on the previous high.
  • Price spends longer consolidating between attempts.
  • A lower high after the triple confirms sellers are gaining control.

When you see that pattern, prepare to enter short once a clear lower high or break of structure appears. This setup often precedes sharp collapses because exhausted buyers leave the market and selling pressure accelerates.

5. Breakout buildup: the powerful breakout with less supply resistance

The breakout buildup is one of the most reliable bullish patterns. Price makes higher highs and higher lows, then hits resistance and pulls back but does not break the previous low. The subsequent retest of resistance shows much less selling pressure and then consolidates right beneath resistance.

boxed consolidation under horizontal resistance showing breakout buildup

Why this matters:

  • Less aggressive bounces off resistance indicate sellers are weakening.
  • Consolidation under resistance often represents buyers accumulating.

Trade plan: enter on a close above resistance or wait for a retest of the breakout for a higher probability entry. Always wait for a candle close above and manage risk with a stop below the breakout retest level.

This pattern translates well across crypto markets. A crypto signals service that tracks volume and price behavior around resistance levels can highlight breakout buildups before they erupt, allowing you to position earlier with better risk management.

Pair patterns with support and resistance

Price action works best when combined with accurate support and resistance levels. Patterns like flags, bear traps, deceleration, triple taps, and breakout buildups become far more reliable when mapped to clear horizontal levels or trend lines.

Zoomed candlestick chart with three horizontal support/resistance lines highlighted in orange and white arrows pointing to each level

Mastering how to draw those levels and then overlaying the patterns above will change the way you trade. If scanning charts across blockchains is part of your workflow, consider supplementing your process with crypto signals that pre-filter setups using your preferred S and R framework.

Final checklist before you trade any price-action setup

  • Confirm the higher-timeframe trend and context.
  • Check momentum: impulsive moves followed by weak corrections are ideal for continuation trades.
  • Look for confirmation: breakout candle close, retest, or a momentum candle (engulfing, pin, or large-range candle).
  • Use lower timeframes to refine entries and stops.
  • Manage risk: position size for a stop that makes sense with your edge.

FAQ

What is price action trading and why is it important?

Price action trading focuses on interpreting raw price movement and chart patterns to make trading decisions. It is important because it removes reliance on lagging indicators and helps you understand who controls the market at any moment: buyers or sellers.

How do I trade a flag pattern safely?

Identify the steep initial move, confirm the corrective channel is shallower, then enter on the breakout of the flag trend line. For a safer approach, wait for a retest of the broken trend line and enter with a tight stop below the recent structure.

What confirms a bear trap reversal?

Look for a false break of support followed by a strong bullish momentum candle, short covering, and then a reclaim or breakout of the prior support-turned-resistance. Multiple false-breaks at the same level strengthen the reversal signal.

Which timeframes should I use with these setups?

Start on the higher timeframe to identify trend and context, then drop to lower timeframes to refine entries and stops. For example, use the four-hour to locate supply or demand zones and a 15-minute to get a clean breakout or retest entry.

Can I automate finding these patterns in crypto markets?

Yes. Many services and scanners exist that detect patterns, volume shifts, and false-breaks across exchanges. Complementing your manual analysis with crypto signals can surface high-probability setups across different blockchains so you can act faster.