

Table of Contents
- Why this works (short version)
- Tools you need
- The 5-step system (exact rules you must follow)
- Risk to reward and the golden rule
- Quick long trade example (walkthrough)
- Risk management and discipline
- Practical checklist before entering
- FAQ
- Final notes
Why this works (short version)
I built a day trading plan that leans on three simple ideas: trade with the trend, use discounted zones to get better entries, and let liquidity and supply and demand do the heavy lifting. The result is a repeatable, rule-based approach on the 15 minute timeframe that produces clean risk to reward setups when executed correctly.
Tools you need
Nothing exotic: a charting platform (I use TradingView), a rectangle or box drawing tool, and the ability to mark highs and lows. Set your chart to the 15 minute timeframe and keep your rules visible.
The 5-step system (exact rules you must follow)
This strategy is five steps, and each step matters. Skip one and the edge evaporates. Follow them strictly.
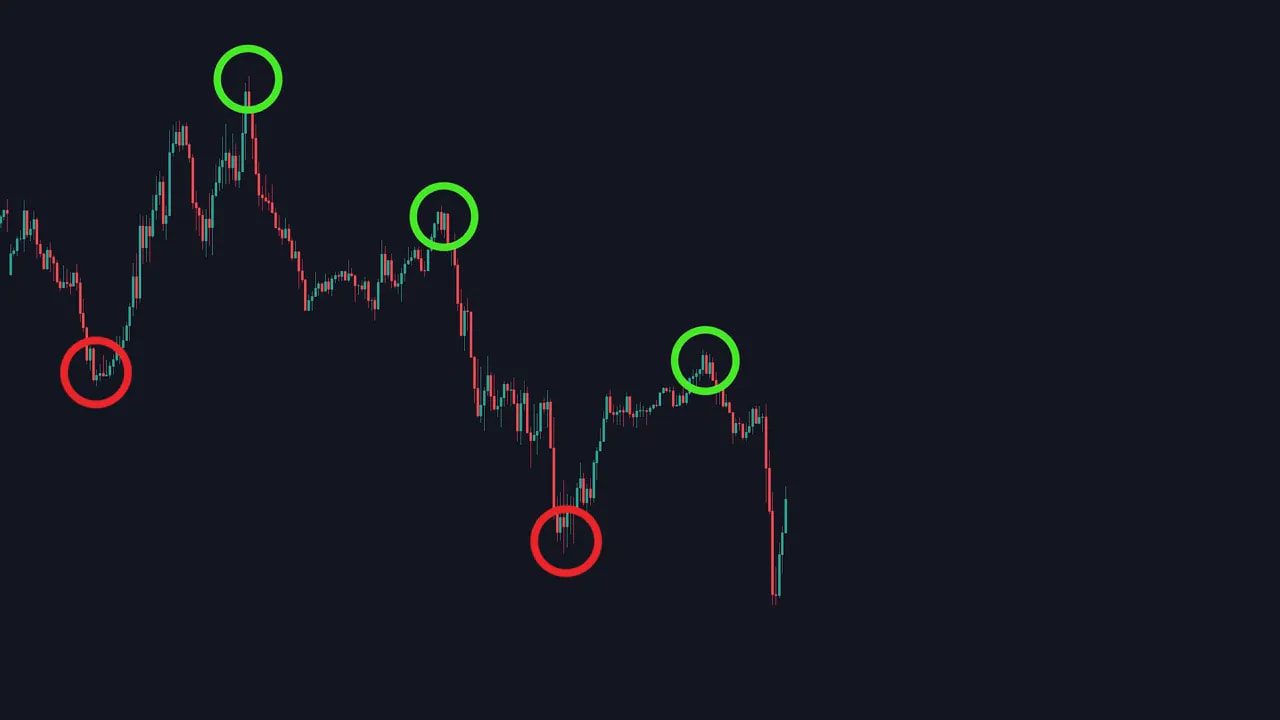
Step 1 — Identify the trend (market structure)
Look for higher highs and higher lows for an uptrend, lower highs and lower lows for a downtrend. If price is choppy and directionless, stay out. You only take trades in the direction of the trend.
Step 2 — Find the discount zone (GAM box)
Draw a box from the swing low that broke structure to the previous swing high. This boxed area is the “discount zone” where price will often correct before continuing the trend. For shorts in a downtrend, focus on the top half of the box. For longs in an uptrend, focus on the bottom half.
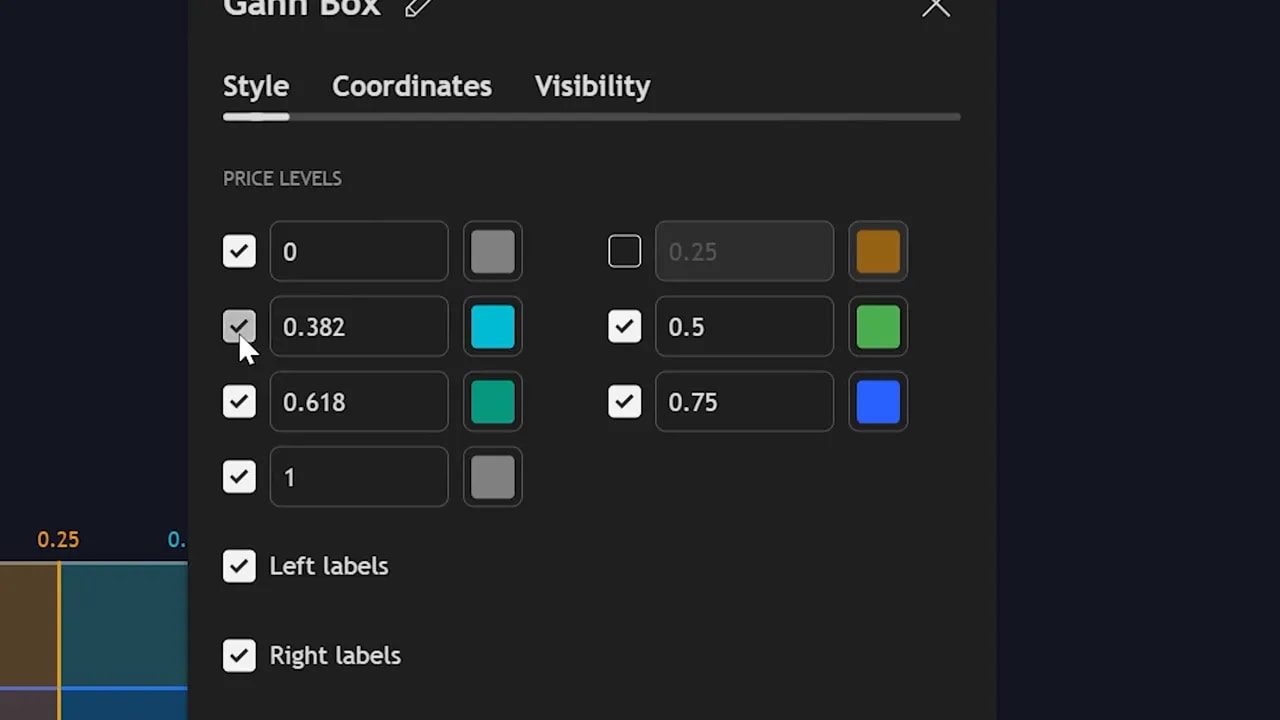
If you use TradingView, switch to the GAM box tool and adjust settings so only the 0, 0.5, and 1 levels show. Turn off labels and time levels to keep the chart clean.
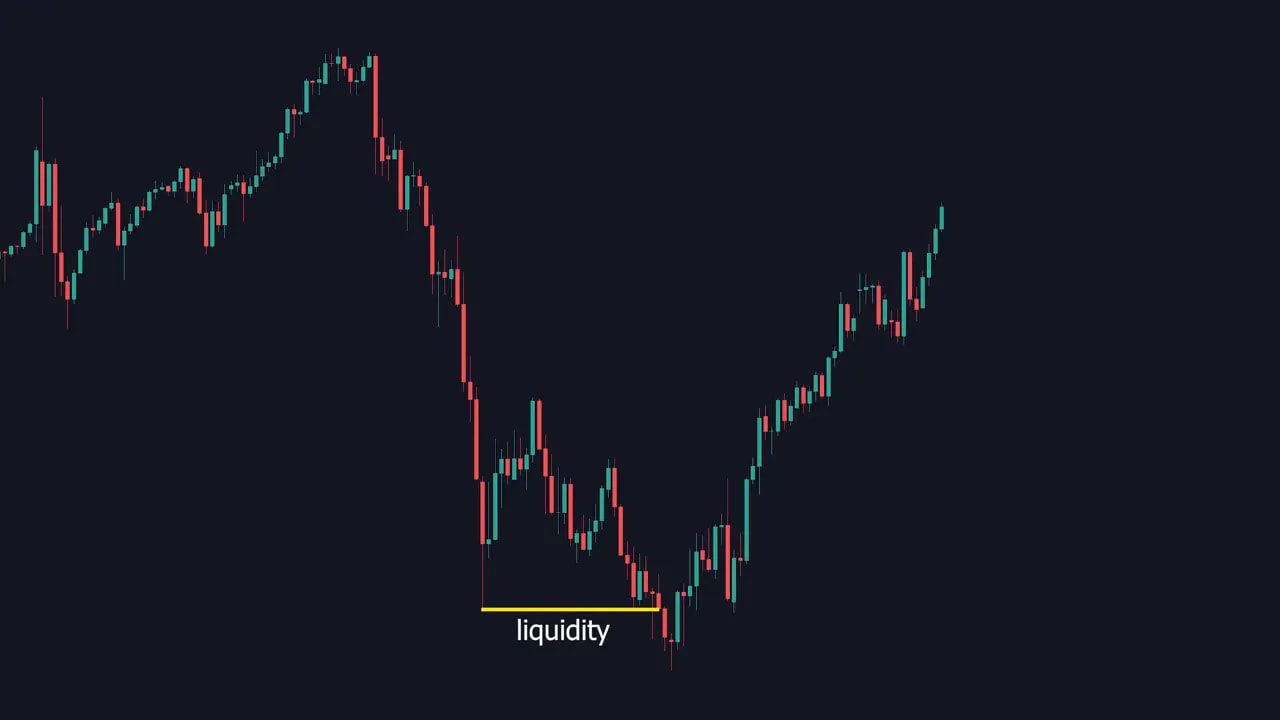
Step 3 — Identify liquidity (the fuel for the move)
Liquidity is where other traders cluster stop losses. On your chart it shows up as a recent high (for shorts) or low (for longs) that price fails to clear cleanly. The market often returns to grab these stops before the next directional move.
Think of liquidity as a built-in engine: when stops are taken out, that trapped volume provides the momentum for the real move.
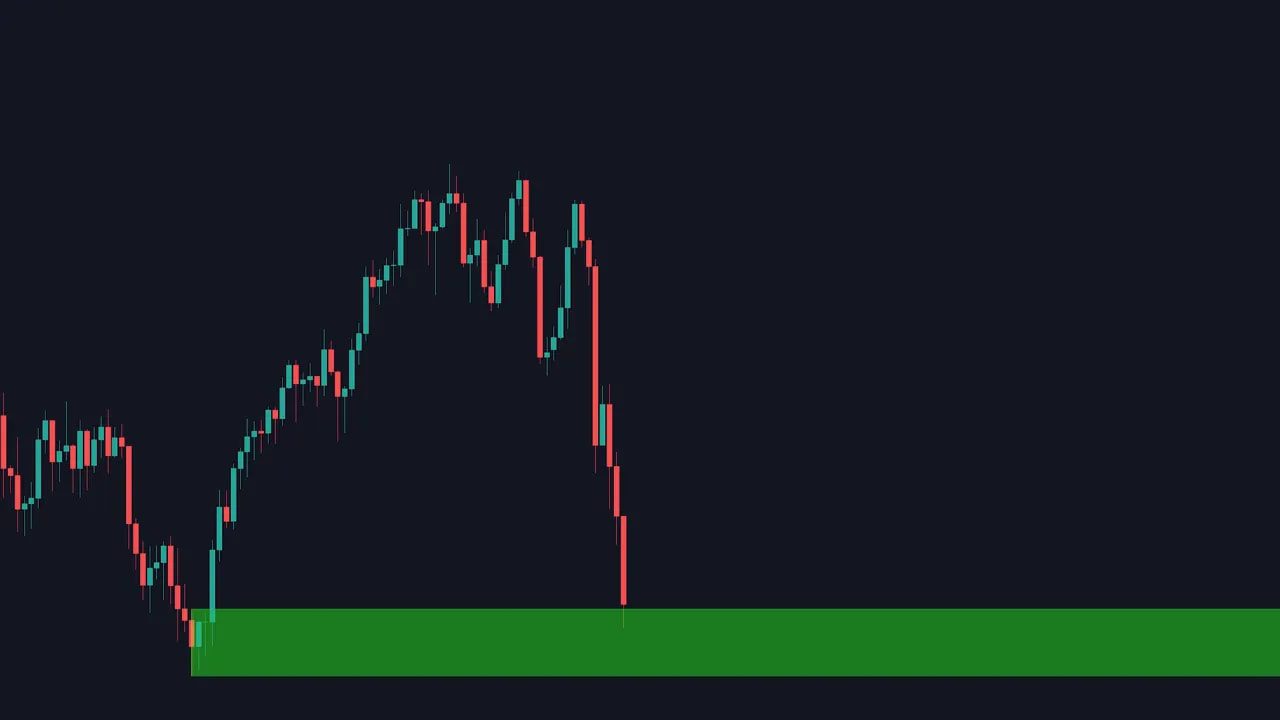
Step 4 — Mark supply and demand zones
Supply is the origin of a strong downward move. Demand is the origin of a strong upward move. To mark these, find the first candle that started the strong impulsive move and box that candle from low to high. That boxed area is where traders aggressively entered and where price often returns to react.
For a short setup the supply zone should sit above the liquidity point and inside the discount zone. For a long setup the demand zone should sit below the liquidity point and inside the discount zone.
Step 5 — Enter the trade (three conditions)
- Price must break the liquidity point.
- Price must enter the supply (for shorts) or demand (for longs) zone.
- All of the above must be inside your discount zone.
Enter as soon as price touches the supply/demand area after the liquidity break. Place stop loss above the supply zone for shorts or below the demand zone for longs. Take profit at the recent swing low (for shorts) or swing high (for longs).
Risk to reward and the golden rule
This approach regularly produces large risk to reward ratios. Still, only take trades where the R to R is greater than 2.5. If R to R is under 2.5, skip it — discipline beats excitement every time.
Quick long trade example (walkthrough)
– The chart shows higher highs and higher lows so we only look for longs.
– Draw the GAM box from the recent low to the recent high. Focus on the bottom half of that box for a discounted long entry.
– Mark the liquidity low inside the discount zone and box the demand area from the first bullish candle of the impulsive move.
– Wait for price to come into demand, place stop loss below demand, take profit at the recent high.
Risk management and discipline
- Timeframe: trade the 15 minute chart only.
- Trend filter: only trade in the trend direction.
- R to R: minimum 2.5
- Position sizing: size so your stop loss equals a small fixed percentage of your account.
- Emotion control: fear and greed will destroy rules. Follow the system.
Practical checklist before entering
- Is the market in a clear uptrend or downtrend?
- Is the setup inside the discount zone?
- Has liquidity been identified and broken?
- Is the supply/demand zone correctly marked?
- Is R to R ≥ 2.5?
- Does the trade size keep your risk acceptable?
FAQ
What timeframe should I use?
The system is built for the 15 minute timeframe. It gives a balance of trade frequency and clean structure. Higher timeframes may work conceptually, but you will need to retest rules and adjust sizing.
What is the GAM box tool and how should I configure it?
The GAM box is a visual box tool that shows 0, 0.5, and 1 levels. Use it to mark your discount zone from the break-of-structure low to the previous swing high. Turn off extra labels and time levels to keep the chart clear.
How do I find liquidity on the chart?
Liquidity appears as highs or lows where traders placed stop losses. Look for recent swing highs (for shorts) or swing lows (for longs) that price failed to clear. The market often revisits these areas to take stops before the main directional move.
Where exactly do I place my stop loss and take profit?
For shorts: stop loss above the top of the supply zone. Take profit at the recent swing low. For longs: stop loss below the bottom of the demand zone. Take profit at the recent swing high. Always check R to R before entering.
Do I have to use the exact same broker or platform?
No. Any reliable broker and charting platform with the necessary drawing tools will work. Choose a regulated broker with tight spreads and sensible execution for day trading.
Is this financial advice?
No. This is an educational trading plan based on a specific approach. Test it with a demo account and backtests, refine your rules, and consider professional advice before risking real capital.
Final notes
This system is simple on paper but requires discipline, consistent execution, and patience. Backtest the rules, paper trade them, and only scale up when you prove edge and consistency. Follow the five steps, respect risk, and the setups will present themselves.
