

Mastering Price action secrets gives you the ability to read the market in real time and act without waiting for lagging indicators to catch up. Indicators have their place, but price paints the immediate story. Below are four high-confidence concepts that will help you interpret that story and take cleaner trades.
Table of Contents
- Candlestick bodies: look past the wicks
- Mean reversion: the average pulls price back
- Momentum: watch the rate of change
- Pullbacks and Fibonacci: measure weakness versus strength
- How to combine these concepts
- Final thoughts
Candlestick bodies: look past the wicks
Most traders obsess over wicks. Wicks matter, but the candlestick body often tells the clearer story of conviction. A large green candle with little or no wicks signals overwhelming buying pressure: sellers were unable to push price down and buyers closed the candle near its high.
When you spot one of these candles, mark its close and low as an important support level. The logic is simple: the market found that price attractive enough to buy aggressively once. If price returns to that area, expect a strong reaction. Past behavior increases the odds of a similar future reaction.
the past can predict the future
Mean reversion: the average pulls price back
Mean reversion is the observation that price tends to return to a central tendency. On many timeframes a moving average serves as that mean. When price diverges far from a 50-period moving average, the likelihood that it will drift back toward the line increases.
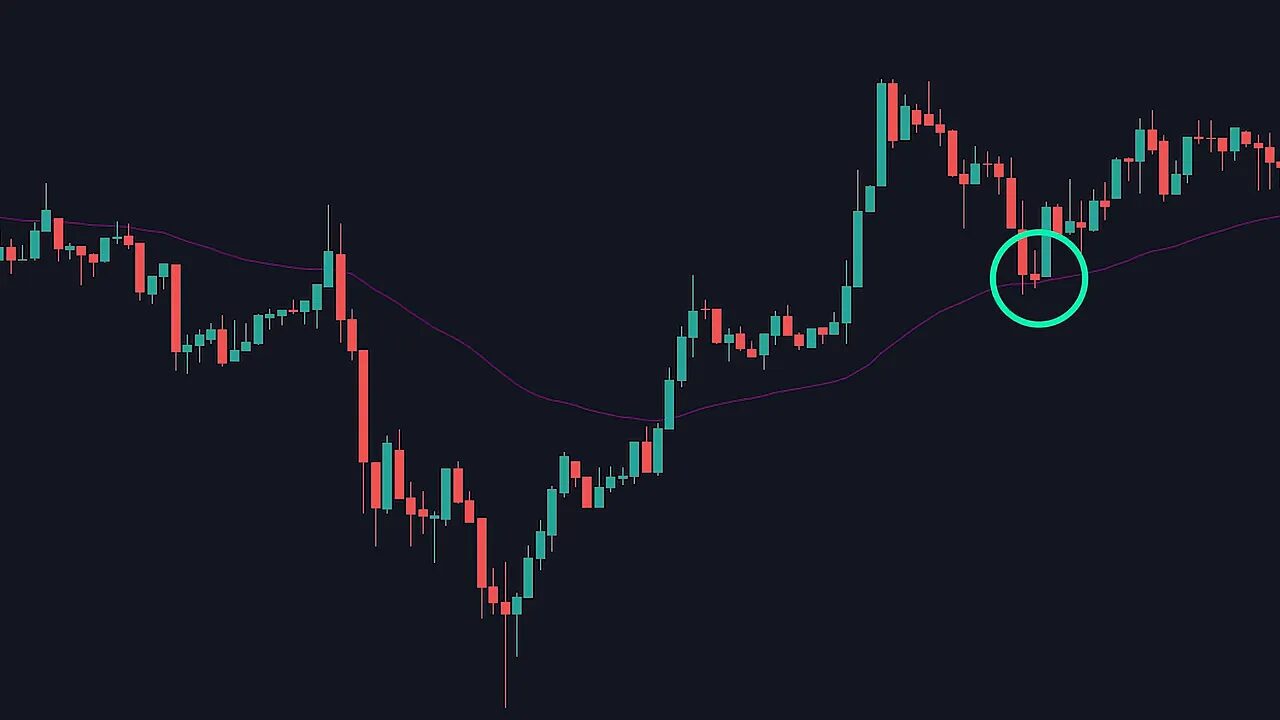
Use this idea to identify pullback buys or fade extreme runs. If price has dropped sharply below the average, consider looking for long entries as it begins to revert. If price has stretched well above the average, prepare for a pullback or consolidation.
Momentum: watch the rate of change
Momentum measures how quickly price is moving. It is not a mystical indicator; it is the difference between a gentle climb and a steep surge. A market that transitions from gradual uphill movement to sharp, fast candles is gaining momentum and often keeps running.
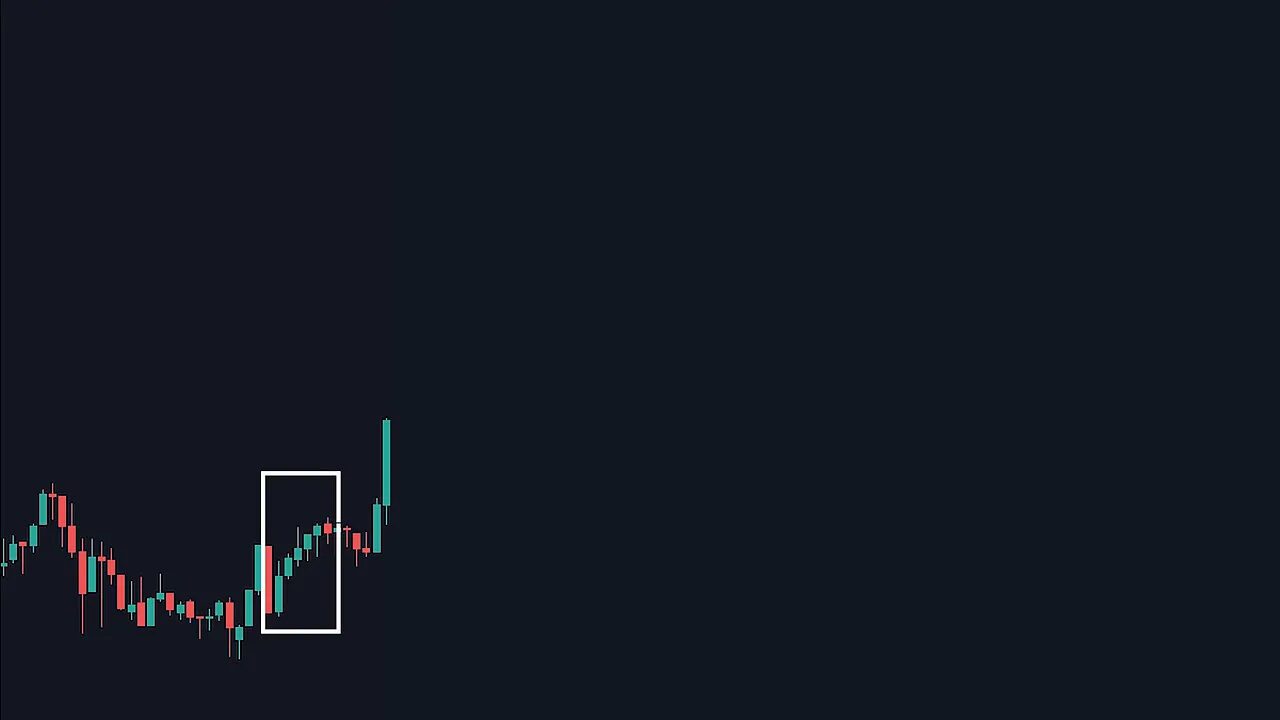
Pay attention to candle size and speed. A sequence of larger candles with minimal pullbacks suggests increasing buyer commitment. Conversely, shrinking candles and choppy movement indicate waning momentum and lower probability of continuation.
Pullbacks and Fibonacci: measure weakness versus strength
Price never moves in a straight line. Pullbacks are normal and represent traders taking profits. The size of a pullback carries information: smaller pullbacks during an uptrend usually mean buyers remain in control, while deep pullbacks can signal a loss of conviction.
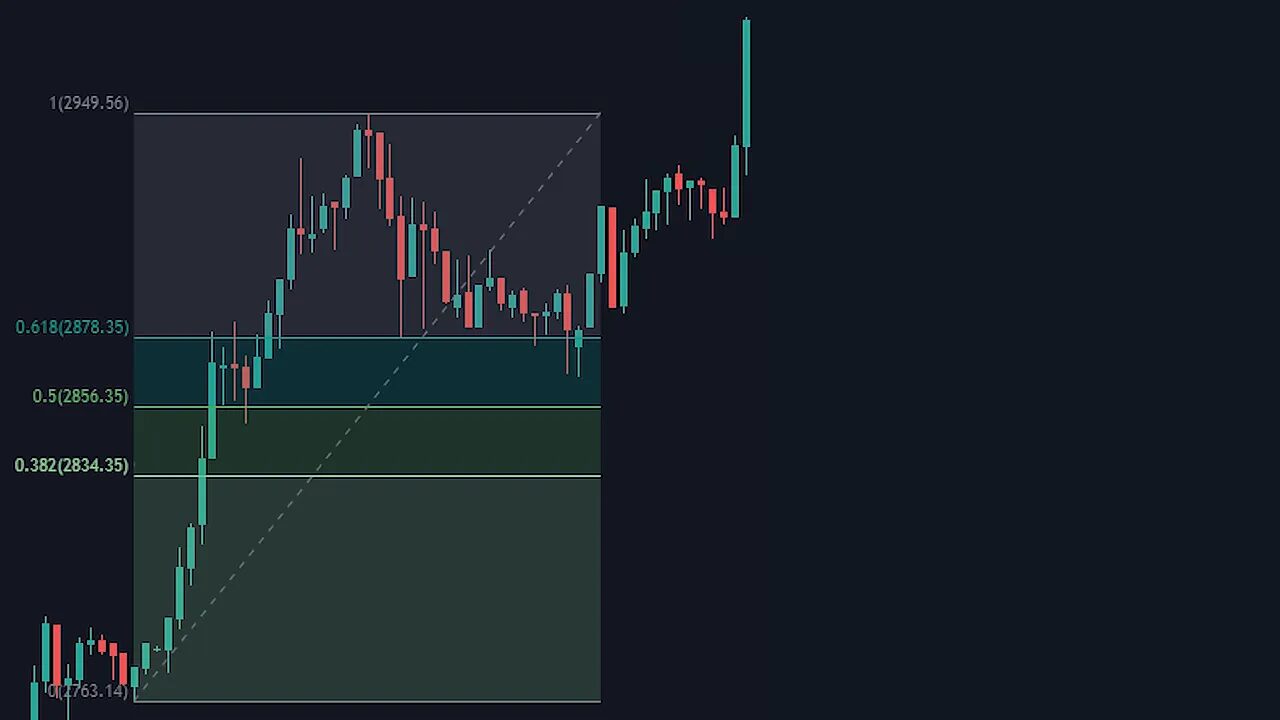
The Fibonacci retracement is a simple way to quantify pullback strength. Clean the tool to show only 0, 0.382, 0.5, 0.618, and 1, then draw from the swing low to the swing high for longs.
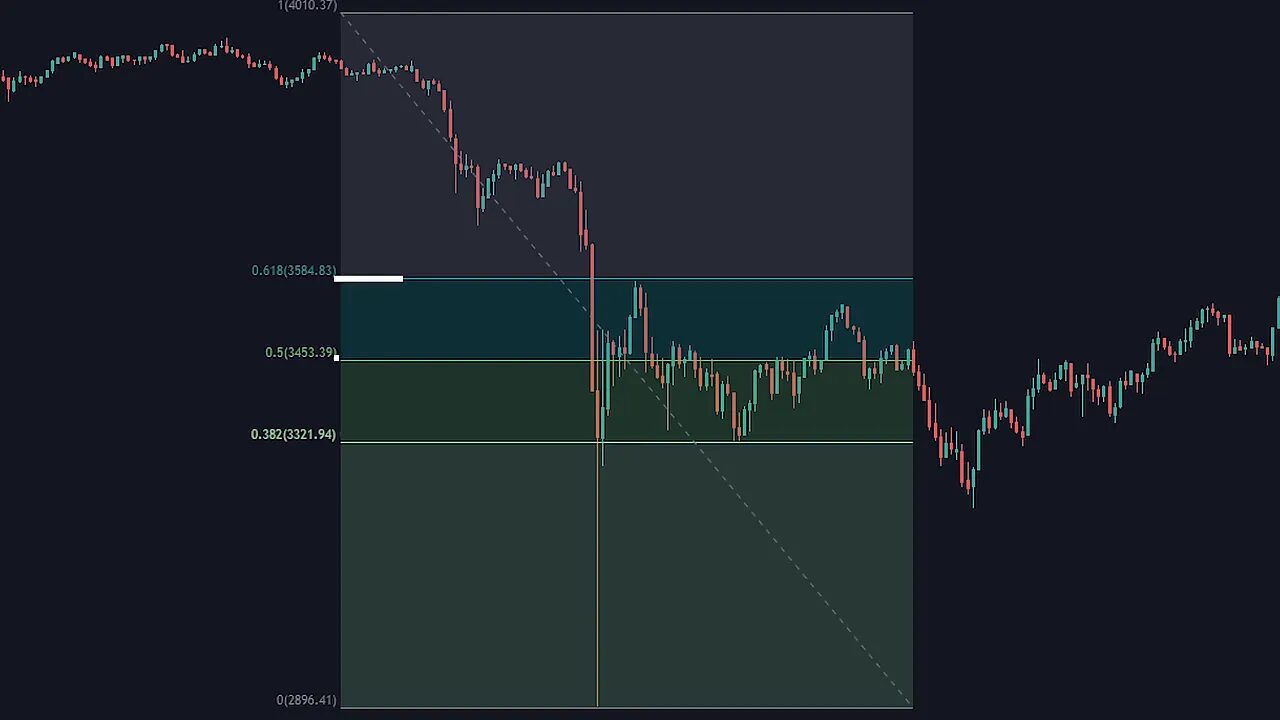
Treat a pullback that holds above the 0.382 line as weak and bullish. If price dips below 0.382, consider the pullback strong and approach with caution—the move may stall or reverse.
How to combine these concepts
None of these Price action secrets is a silver bullet on its own. Combine them for higher-probability setups:
- Candlestick body identifies conviction and possible support.
- Mean reversion spots exhaustion and potential entry zones near the mean.
- Momentum confirms whether buyers or sellers have force.
- Pullback size via Fibonacci tells you if the retracement is acceptable or dangerous.
For example, a strong green candle marking support, followed by a shallow pullback that stays above 0.382, touching the moving average with renewed bullish momentum creates a very favorable risk-reward trade.
Final thoughts
Trading is a probability game. Studying these Price action secrets increases your edge because they let you read what market participants are actually doing instead of relying solely on lagging signals. Practice identifying these patterns on multiple timeframes and combine them with sensible risk management to improve consistency.
What timeframes work best for price action analysis?
Price action works on any timeframe. Higher timeframes reduce noise and often produce more reliable levels, while lower timeframes allow tighter entries. Use higher timeframes to define trend and structure, and lower timeframes to time entries.
Can I use indicators with these price action techniques?
Yes. Indicators can provide additional confirmation. Moving averages pair naturally with mean reversion ideas, and momentum indicators can help validate the speed of a move. Treat indicators as confirmation tools, not replacements for reading price.
How do I size pullbacks using Fibonacci correctly?
Draw from the recent swing low to swing high for long setups. Keep only the 0.382, 0.5, and 0.618 levels visible. If the pullback holds above 0.382, it is considered weak and more likely to continue. If it drops below 0.382, risk of stall or reversal increases.
What is the most common mistake traders make with price action?
Overfitting indicators and ignoring context. Traders often chase indicator signals without checking price structure, momentum, or the strength of pullbacks. Always align signals with clear price action context before risking capital.
