

Table of Contents
- Why candlestick patterns matter
- Quick example (what success looks like)
- 1. Engulfing Candle — simple and powerful
- 2. Momentum Candle — trade the breakout of a choppy market
- 3. Multiple-wick pattern — reading the battle between buyers and sellers
- 4. Doji — market indecision that often precedes a reversal
- 5. Hammer and Shooting Star — single-candle reversal signals
- 6. Tweezer — neat, paired reversal setup
- 7. Marubozu — conviction without wicks
- Putting patterns together with structure and risk management
- Bonus tip: automate pattern detection
- Common pitfall: false breakouts and how to reduce them
- Checklist before entering a pattern trade
- FAQ
- Final thoughts
Why candlestick patterns matter
Candlestick patterns give clear visual clues about who currently controls the market — buyers or sellers — and where momentum might push price next. Used correctly, they pinpoint high-probability entries and exits, help confirm support and resistance, and make chart reading far less mysterious.
This guide covers the most reliable patterns I trade every day: engulfing, momentum, multiple-wick setups, doji, hammer and shooting star, tweezers, and marubozu. Each section explains what the pattern shows, how to read it in context, and how to use it with support and resistance and basic risk control.
Quick example (what success looks like)
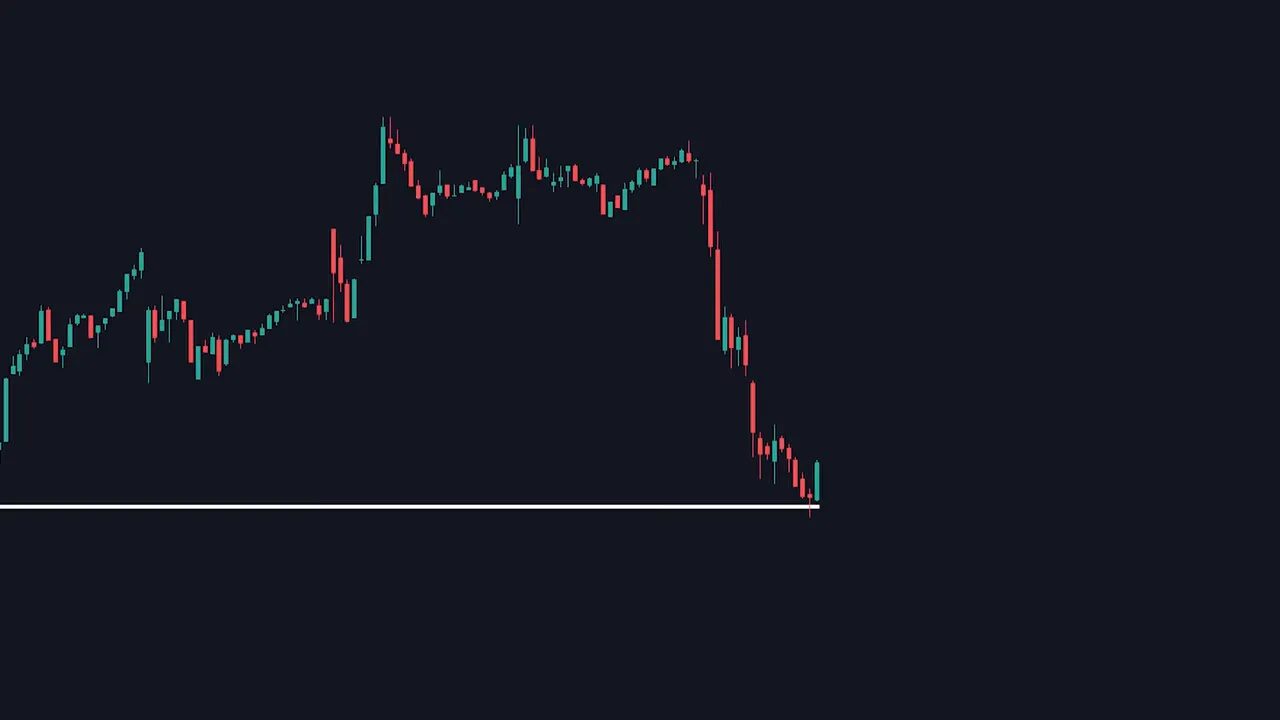
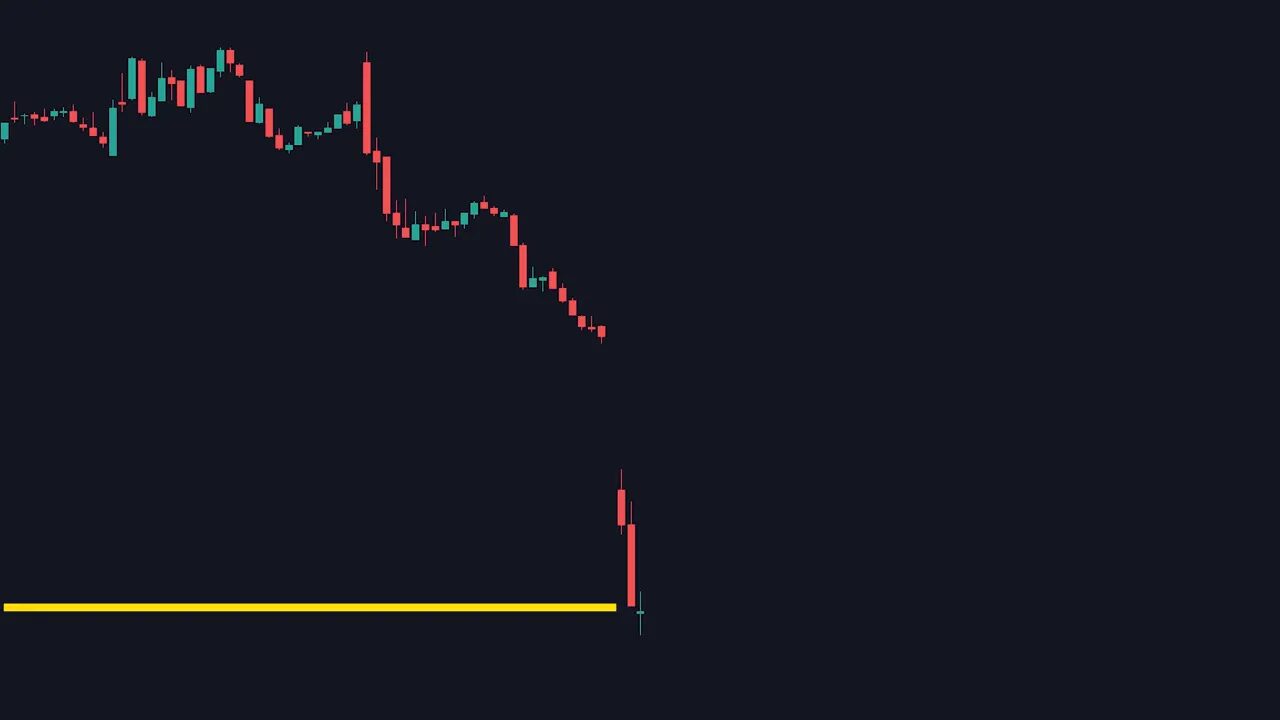
A recent trade returned roughly a 10 percent gain simply by recognizing a high-probability candlestick pattern at a strong support zone. Patterns can give a near-exact reversal point when paired with structure.
1. Engulfing Candle — simple and powerful
An engulfing candle appears when a candle in the opposite color fully covers the previous candle’s body on both sides. A bullish engulfing opens at or below the previous close and closes above the previous open. Visually it looks like one candle swallowing the prior one.
Why it works: it signals a rapid shift in control — sellers fail to hold and buyers step in aggressively. One engulfing candle at a tested support or resistance often marks the start of a reversal.
Practical tip: never trade an engulfing candle alone. Use it as confirmation with support and resistance, volume spikes, or an indicator. Treat patterns as hints, not infallible rules.
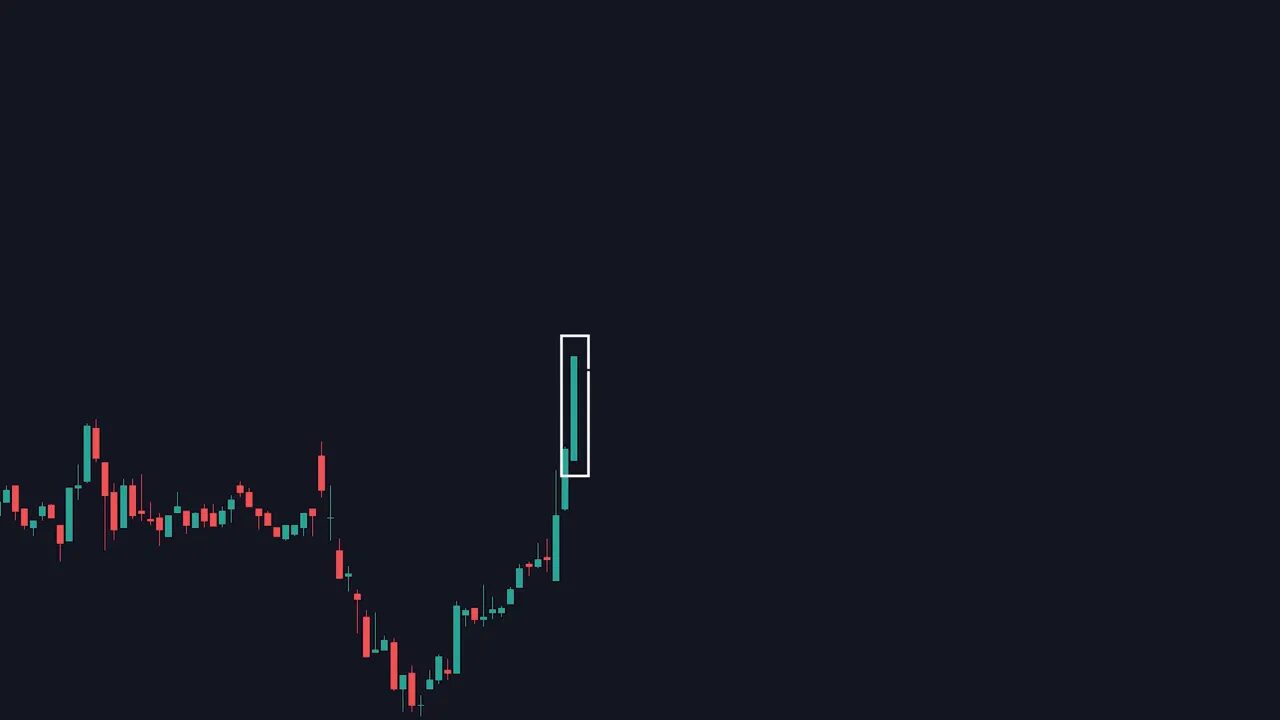
2. Momentum Candle — trade the breakout of a choppy market
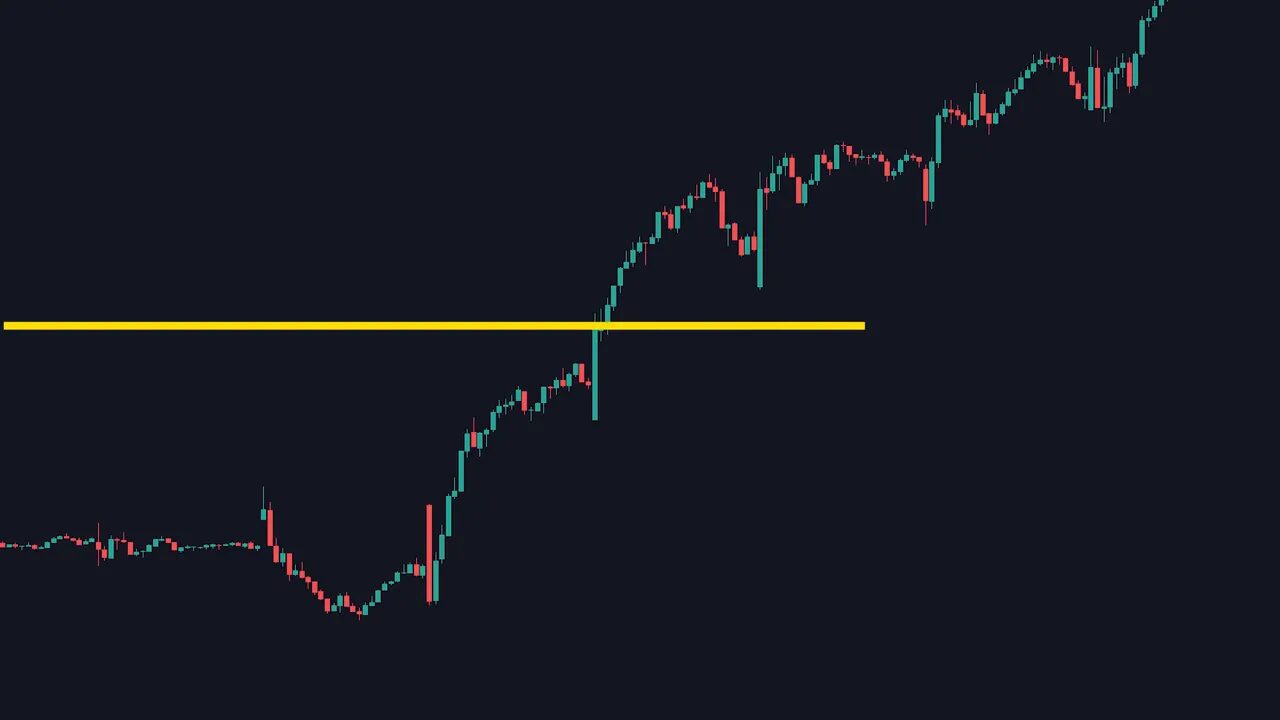
A momentum candle is simply a candle 2 to 3 times larger than those before it. It’s easy to spot and frequently reliable — once it pierces a sideways range, the price often keeps moving in that direction.
The logic: sideways markets compress traders into many stop placements. A large breakout candle hits those stops and feeds further movement, creating trend continuation. In choppy conditions a single large green or red candle is often the best signal to enter.
Use this in crypto markets as well. If a large momentum candle appears on a crypto chart right above a consolidation zone, consider combining that signal with curated crypto spot trading signals to time entries across different blockchains and pairs.
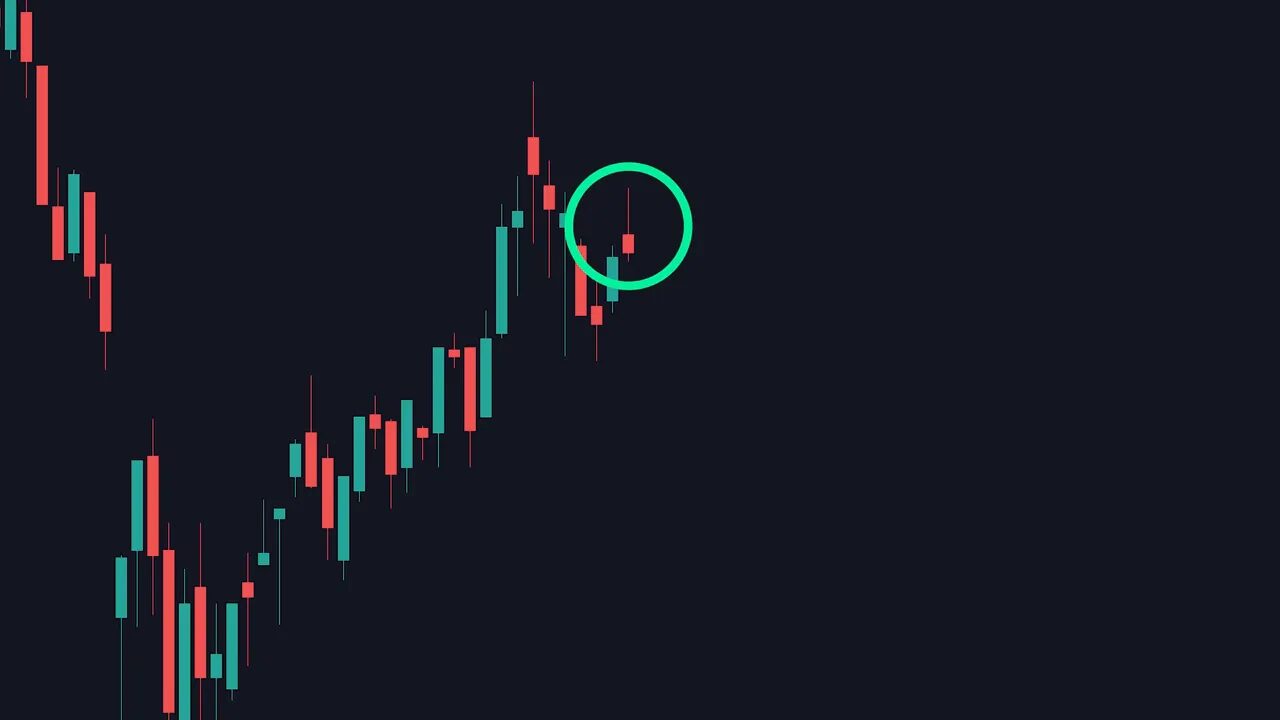
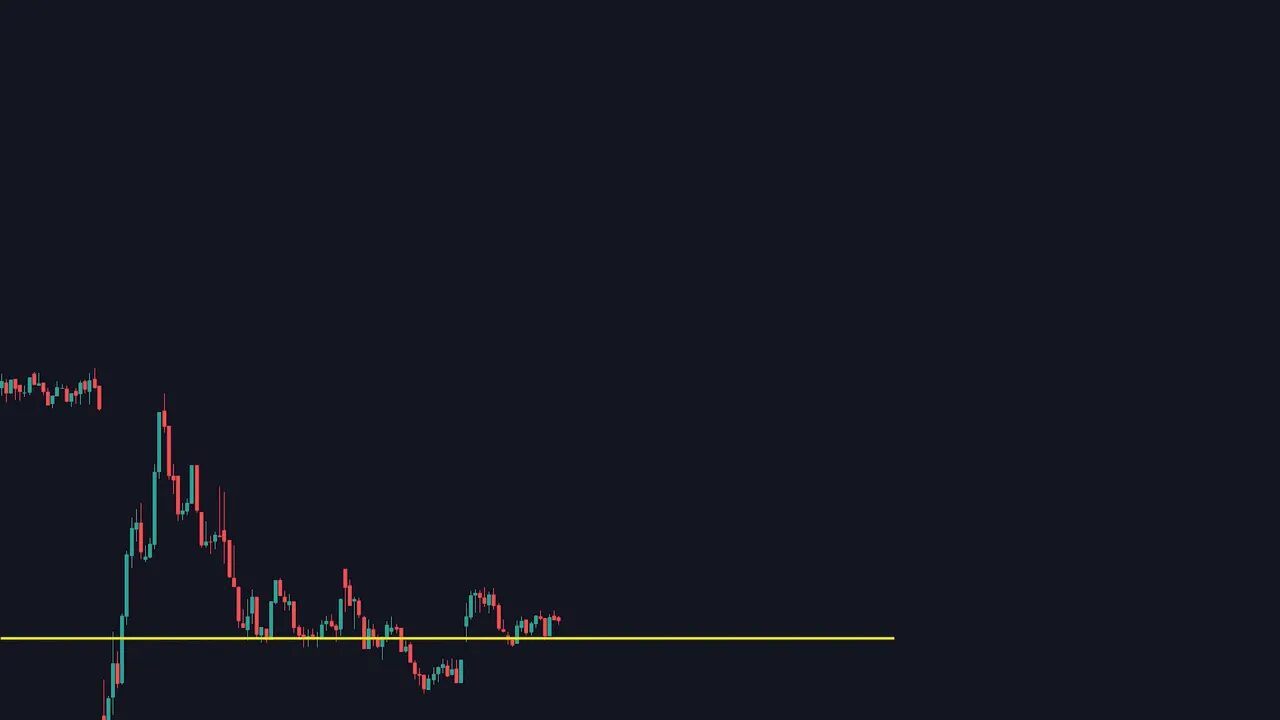
3. Multiple-wick pattern — reading the battle between buyers and sellers
When three or more consecutive candles show wicks pointing the same direction at a support or resistance, that’s a multiple-wick pattern. For example, multiple lower wicks at support show repeated buyer defense; multiple upper wicks near resistance show repeated seller rejection.
The more candles with matching wicks, the stronger the validation. This is especially useful for scaling entries: you can wait for the next wick test or enter when the next push away from the level begins.
4. Doji — market indecision that often precedes a reversal
A doji has a very small body with wicks on both sides. It represents market uncertainty. When a doji appears after a clear move, it often signals the move is losing steam and a reversal could follow.
Confirmation strategy: after a doji, wait for two or more candles in the expected direction to confirm the reversal before committing. Variants such as the long-legged doji, dragonfly, and gravestone all tell the same basic story of hesitation and potential flip.
5. Hammer and Shooting Star — single-candle reversal signals
The hammer is a bullish sign: long lower wick and a modest body above the low. It shows sellers pushed price down but buyers reclaimed most of that loss by close.
The shooting star is the inverse: it has a long upper wick and small body near the low and signals a potential top. Treat both like the doji: wait for follow-through or use them at strong structure levels for a higher-probability trade.
6. Tweezer — neat, paired reversal setup
A tweezer bottom is a red candle followed by a green candle with similar lower wicks. It indicates support was tested twice and held, making a bounce more likely. The opposite (green then red with matching upper wicks) is a tweezer top.
Because it’s a short sequence, tweezers are easy to trade when they appear at meaningful structure zones.
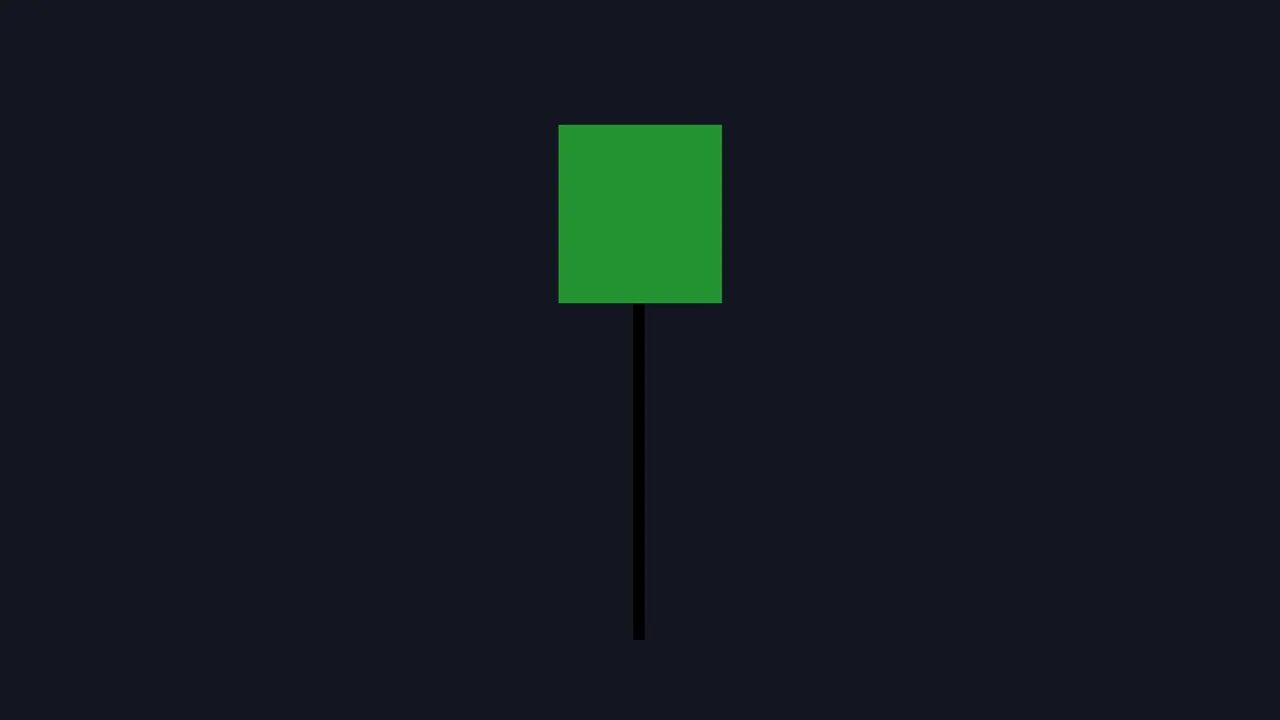
7. Marubozu — conviction without wicks
A marubozu is a full-bodied candle without upper or lower wicks. A bullish marubozu closes at its high and opened at its low, showing complete control by buyers during that period. A bearish marubozu does the reverse.
Spotting a marubozu in the middle of a developing trend is a strong trend-confirmation signal. In trending crypto markets, seeing a marubozu on higher timeframes is a straightforward sign to ride the direction, and it can be supplemented with crypto spot trading signals for better trade selection across exchanges.
Putting patterns together with structure and risk management
Candlestick patterns give signals; structure decides whether those signals are worth trading. Always match patterns with:
- Support and resistance — Patterns near these levels carry more weight.
- Timeframe alignment — Confirm the signal on at least one higher timeframe.
- Follow-through — Look for at least one confirming candle unless you have a tight edge and plan for a quick stop.
- Clear stop loss — Place stops outside the invalidation point for the pattern.
Bonus tip: automate pattern detection
If memorizing every pattern feels overwhelming, use charting software to highlight occurrences. On popular platforms you can add indicators that mark specific candlestick patterns so your chart will notify you when an engulfing, doji, or marubozu appears.
That frees you to focus on structure and context instead of hunting for shapes. For crypto traders, combine automated pattern alerts with curated crypto spot trading signals to monitor opportunities across pairs without sitting glued to charts.
Common pitfall: false breakouts and how to reduce them
The main risk when trading candlestick patterns is false breakouts — a pattern forms but price moves the opposite way. Mitigation techniques:
- Wait for confirmation candles or retests before adding size.
- Use multiple timeframes to verify the trend direction.
- Combine with volume or momentum indicators to ensure real conviction behind the move.
- Keep position sizes small initially and scale into winners.
These simple steps dramatically reduce whipsaws and turn many pattern signals into profitable trades.
Checklist before entering a pattern trade
- Pattern appears at a clear support or resistance level.
- Higher timeframe aligns with the expected direction.
- Confirmation candle(s) or momentum exist.
- Entry, stop, and target are defined with acceptable risk-to-reward.
- Volume or other filters back up the conviction.
FAQ
How reliable are candlestick patterns on their own?
Alone they are helpful signals but not guarantees. Reliability improves substantially when patterns align with support and resistance, higher timeframe structure, volume, and a proper stop loss. Treat patterns as part of a confluence-based approach.
Which timeframe should I use for these patterns?
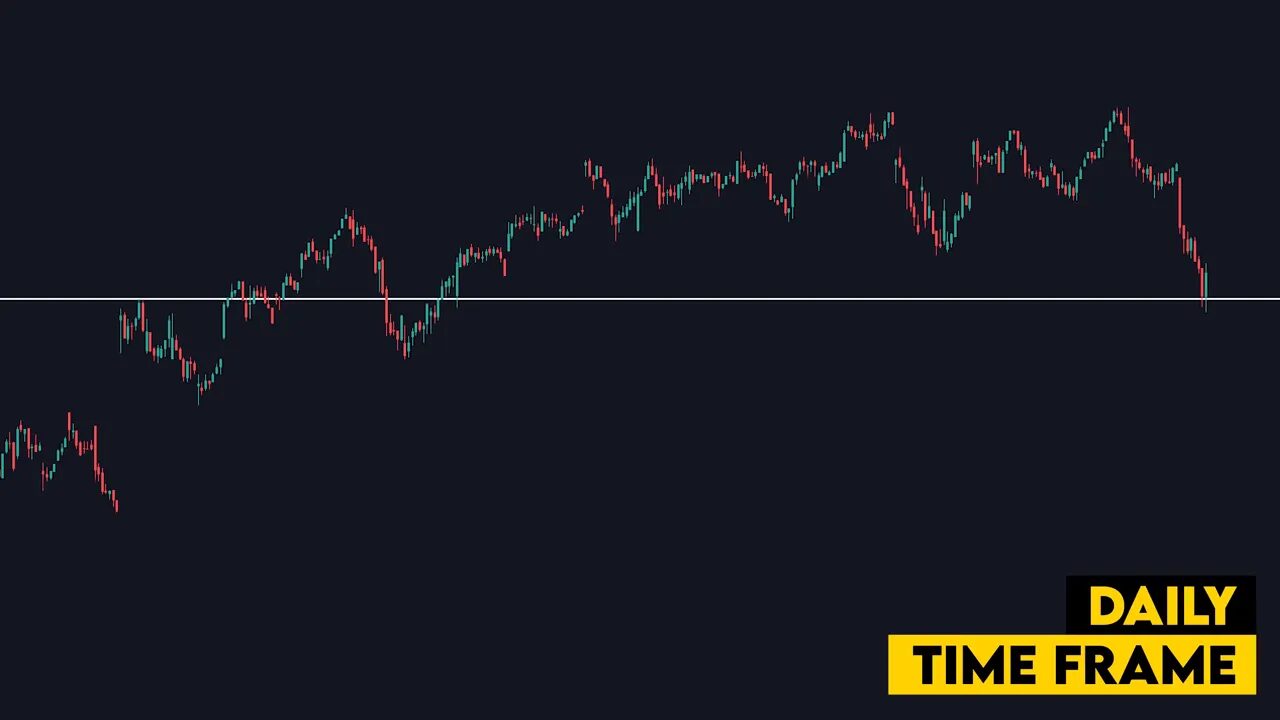
Patterns on higher timeframes (4-hour, daily) tend to be more reliable. Use lower timeframes for timing entries, but always check a higher timeframe to confirm the broader trend and context.
Can I use these patterns for trading crypto?
Yes. Candlestick mechanics are the same across assets. Crypto tends to be more volatile, so combine pattern recognition with volatility-aware risk sizing. Using crypto spot trading signals alongside candle patterns can help identify the best pairs and timing in fast-moving markets.
What’s the best way to avoid false breakouts?
Wait for confirmation candles, use higher timeframe alignment, monitor volume, and place stops beyond logical invalidation points. Scaling into trades after partial confirmation also helps manage early false moves.
Are there tools to automatically detect these patterns?
Yes. Most charting platforms offer indicators that mark candlestick patterns. Enabling those alerts lets you focus on structure and risk management rather than manual pattern hunting.
Final thoughts
Candlestick patterns are among the most practical tools in a trader’s toolkit when used intelligently and alongside structure and risk rules. Learn to spot the patterns above, rely on confirmation, and use automation for alerts when needed.
If you trade crypto, pairing these pattern reads with reliable crypto spot trading signals can make scanning across many coins and chains far more efficient and increase the quality of opportunities you act upon.
