

Table of Contents
- Outline
- What supply and demand actually mean on a chart
- How to draw zones the practical way
- Which zones are tradable: validating with break of structure
- How to enter, where to place stop loss, and where to take profit
- Three secret tricks that make zones dramatically more accurate
- Applying this to crypto and leveraging free crypto signals
- Quick checklist before taking a supply or demand trade
- What exactly makes a supply or demand zone valid?
- How do I draw a supply or demand zone quickly?
- Where should I place stop loss and take profit?
- What is a fair value gap and why does it matter?
- Do supply and demand zones work on crypto?
- Final thoughts
Outline
- Core idea: what supply and demand zones are and why aggressiveness matters
- How to draw supply and demand zones correctly
- How to validate zones using break of structure
- Entry, stop loss, and take profit rules
- Three secret tricks to make zones far more accurate
- Applying S&D to crypto and using signals to spot opportunities
- Quick checklist and FAQ
What supply and demand actually mean on a chart
Supply is an area where sellers hit the market hard and push price down. Demand is the opposite: an area where buyers aggressively drive price up. The single most important qualifier is the word aggressive. A couple of small candles are not enough. Think of Black Friday-level buying or selling — sudden, decisive, one-directional moves that leave an identifiable footprint on the chart.
How to draw zones the practical way
Everyone draws zones slightly differently. Here is a simple, reliable method that I use:
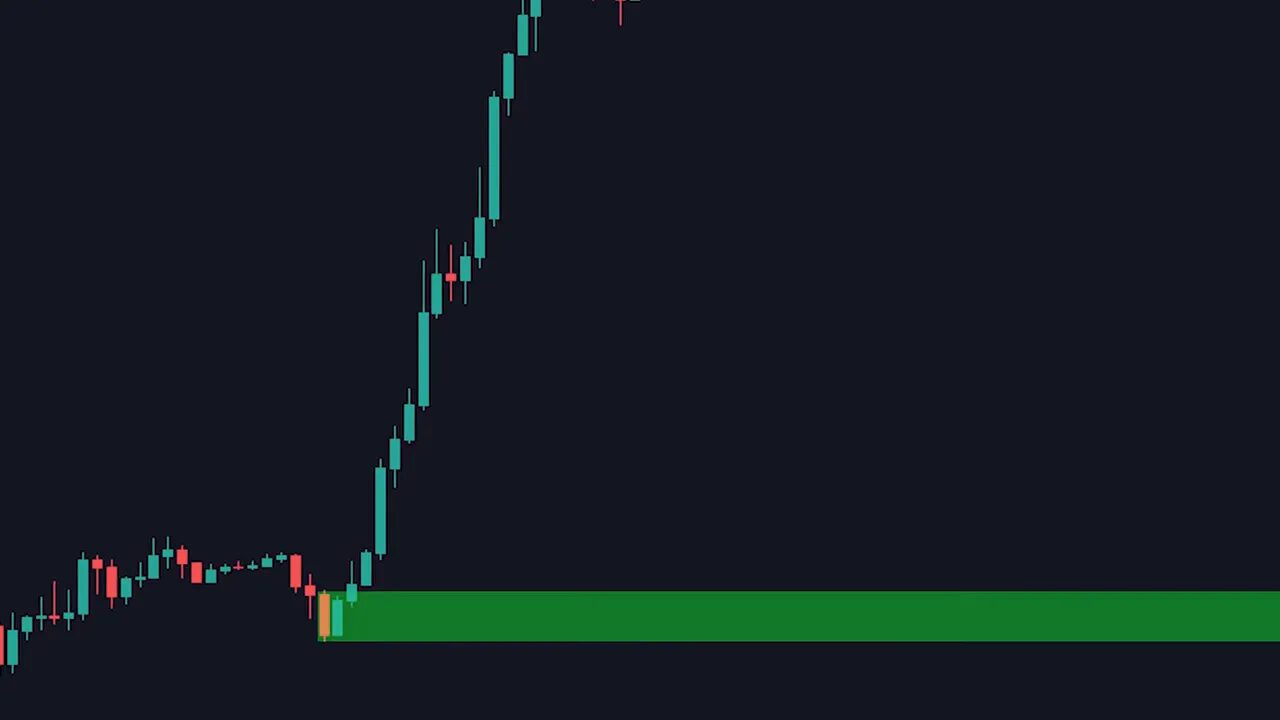
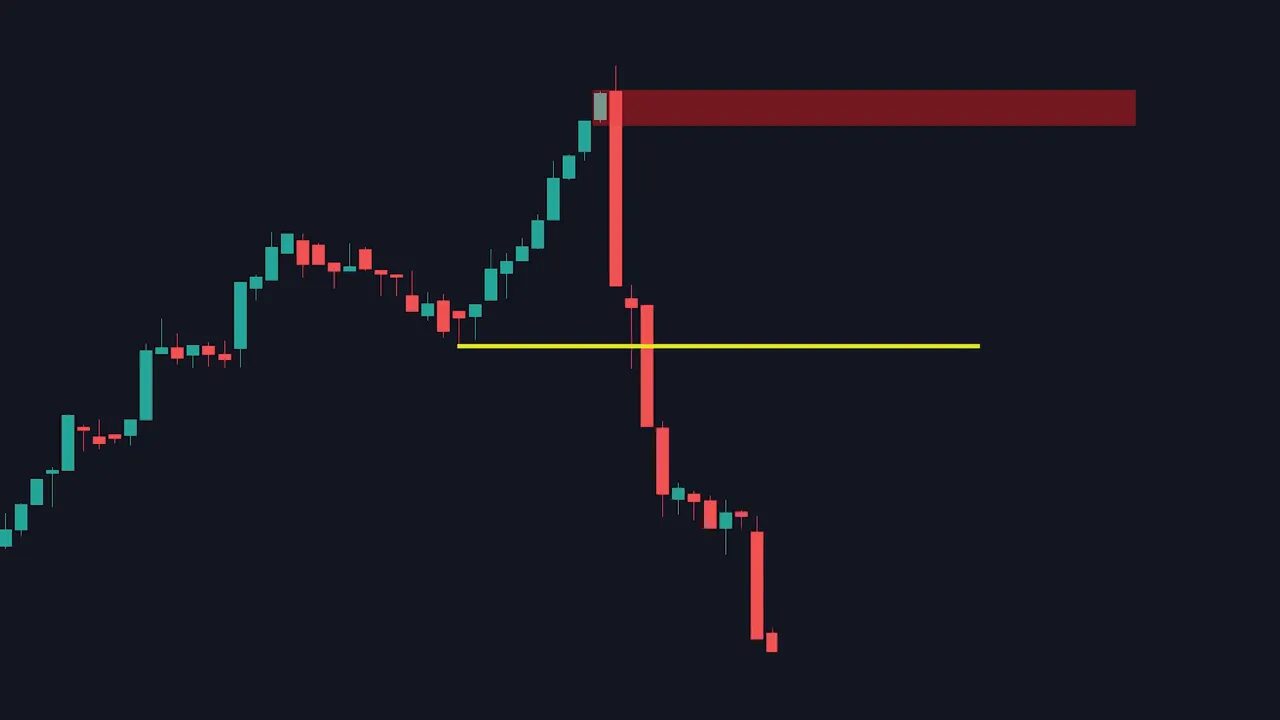
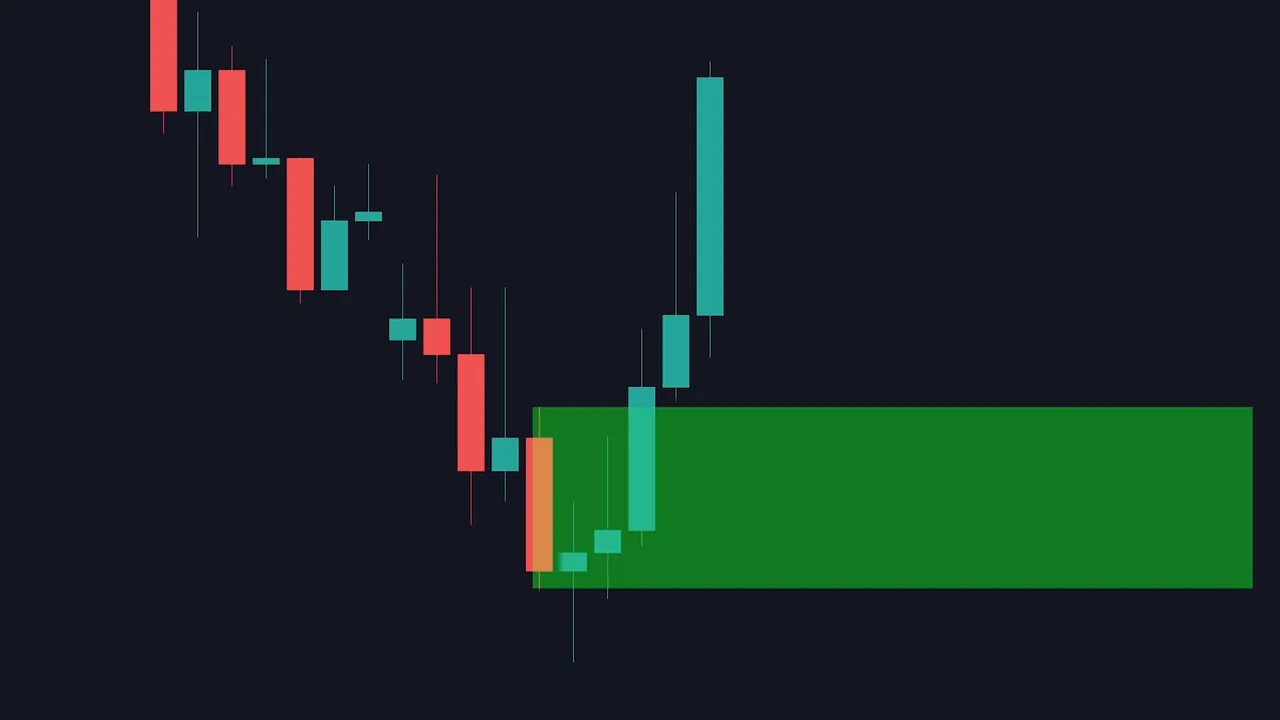
- Find a large, aggressive move (up for demand, down for supply).
- Locate the candle of the opposite color immediately before that aggressive move. For a bullish move, find the red candle just before the rally. For a bearish move, find the green candle just before the drop.
- Draw the zone from the low to the high of that single candle. That rectangle is your supply or demand zone.
This keeps zones tight and focused on the exact area where liquidity was taken and institutions likely entered.
Which zones are tradable: validating with break of structure
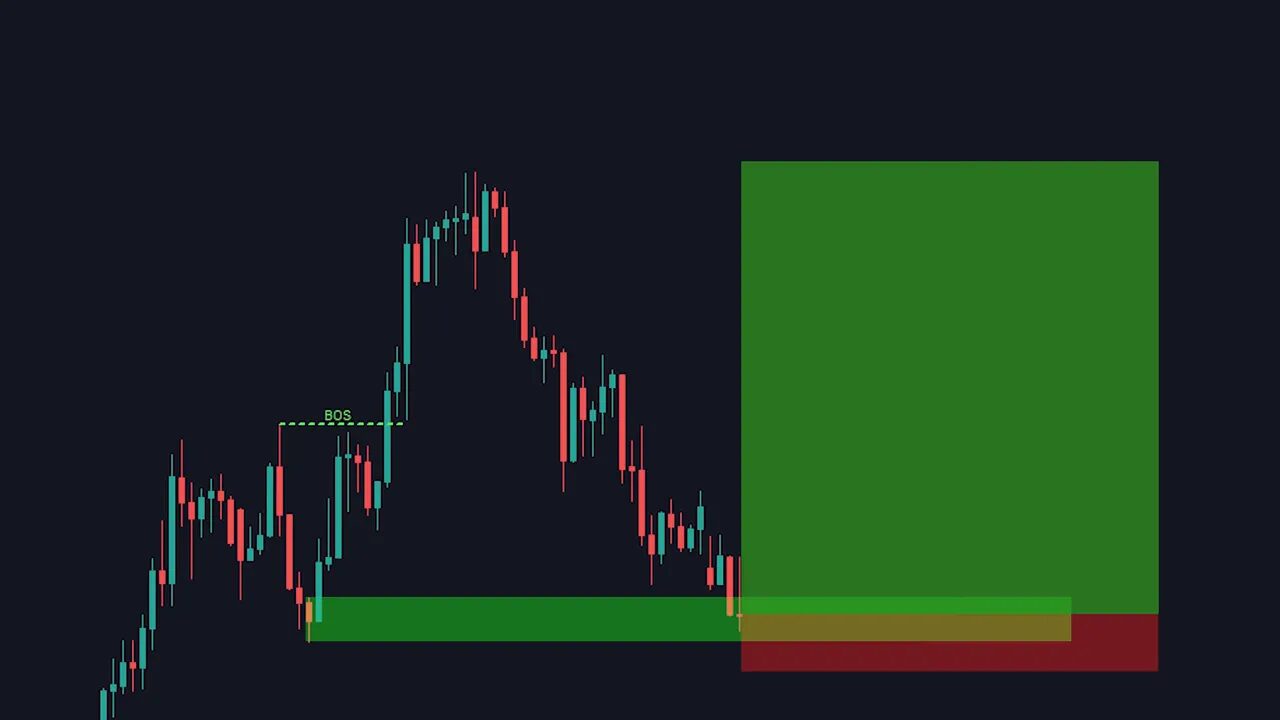
Not every zone you draw is worth trading. Two conditions make a zone valid:
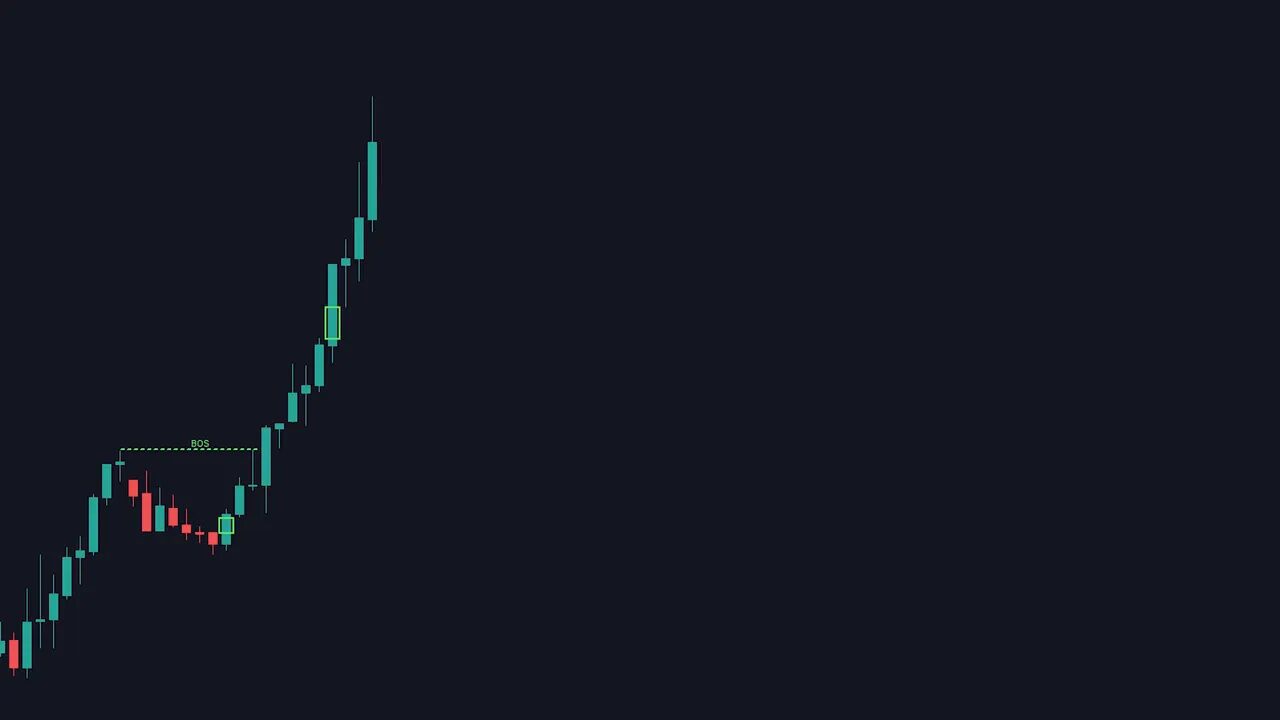
- Aggressive move that created the zone (already covered).
- Break of structure after the move — price must break the previous market structure in the direction of the move.
If the structure does not break, the zone is weak and should be ignored. A validated zone means more traders and institutions acknowledged the move, increasing the chance of a reliable re-test and continuation.
How to enter, where to place stop loss, and where to take profit
Once a zone is valid, the rules are straightforward:
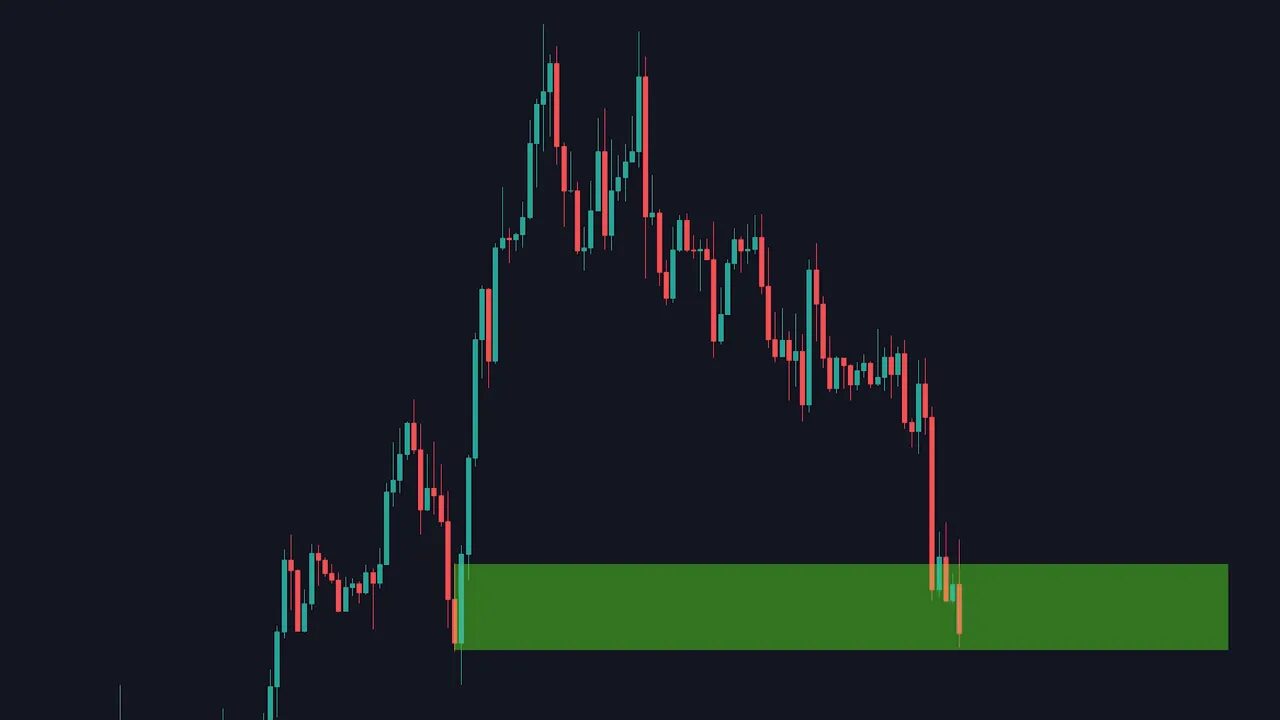
- Wait for price to return to the zone.
- Enter when price reaches the zone (you can combine with price action confirmation if you like).
- Stop loss: place it just beyond the zone boundary — below demand, above supply.
- Take profit: set at the high (for long trades) or low (for short trades) of the aggressive move that formed the zone.
This gives a clean risk to reward structure. The move often rockets back toward the original extreme because the initial aggressive move indicates strong directional intent.
Three secret tricks that make zones dramatically more accurate
These are the exact add-ons that separate mediocre S&D traders from consistent ones.
1. Prefer slow returns to the zone
When price returns to your zone, watch how it arrives. A slow, steady approach increases the probability that the zone will hold. Rapid, aggressive returns give a higher chance of the zone failing. If price zooms back in aggressively, skip the trade or tighten position sizing.
2. Look for a fair value gap at the start of the move
A fair value gap is an imbalance created when price rushes through an area, leaving a visible gap between candles. Ideally, this imbalance should be connected to the very first candle of your zone. When a fair value gap exists there, the odds of the re-test working go up significantly.
If the move after your zone’s first candle was slow and grindy, the zone may still work but with lower probability. The strongest setups have a clear fair value gap.
3. Combine the three elements for the ideal trade
The perfect supply or demand trade checks all boxes:
- Aggressive move that created the zone
- Break of structure confirming the directional impulse
- Fair value gap connected to the first candle of the zone
- Slow approach when price returns
When these elements align, you get high probability entries with favorable risk to reward. Use small position sizes on lower probability setups and scale into the higher probability ones.
Applying this to crypto and leveraging free crypto signals
Crypto markets are volatile and often create sharp imbalances and fast structure breaks — exactly the conditions where supply and demand trading shines. Because chains and tokens trade 24/7, you will see many aggressive moves and fair value gaps across timeframes.
To make the most of those moves, consider using curated signal feeds that highlight high-probability S&D setups on major blockchains. Free crypto signals can help you spot opportunities faster by flagging aggressive moves, validated zones, and fair value gaps across multiple pairs so you do not have to monitor every chart manually. Use signals as an extra input — always check the three-element checklist before risking real capital.
Quick checklist before taking a supply or demand trade
- Was the original move aggressive?
- Did price break structure in the direction of the move?
- Is there a fair value gap connected to the zone’s first candle?
- Is price slowly returning to the zone rather than rushing back?
- Is stop loss placed just beyond the zone and take profit at the move extreme?
What exactly makes a supply or demand zone valid?
A valid zone requires an aggressive move that created it and a break of structure confirming the directional intent. Without both, the zone is weak and more likely to fail.
How do I draw a supply or demand zone quickly?
Find the candle opposite to the aggressive move that immediately preceded it. Draw a rectangle from that candle’s low to high. That compact area is your zone.
Where should I place stop loss and take profit?
Place stop loss just beyond the zone (below for demand, above for supply). Take profit should be set at the high (for longs) or low (for shorts) of the original aggressive move that formed the zone.
What is a fair value gap and why does it matter?
A fair value gap is an imbalance left when price moves quickly and does not fully trade through a price area. It signals strong, unfilled orders and increases the chance of a clean re-test of the zone.
Do supply and demand zones work on crypto?
Yes. Crypto’s frequent, aggressive moves create many S&D opportunities. Use additional tools like curated free crypto signals to filter pairs and timeframes so you focus on the highest probability setups.
Final thoughts
Supply and demand trading is simple at its core but powerful when combined with validation rules. Prioritize aggressive moves, require a break of structure, prefer zones with fair value gaps, and only trade slow, steady returns. Use this framework as your baseline and refine with backtesting and position management.
Keep a checklist, follow disciplined risk rules, and use signal feeds prudently to scale your edge across markets, including crypto.
