

Table of Contents
- Why most candlestick patterns fail—and the simple fix
- The three candle types that actually matter
- How these three candles combine into a tradeable story
- Marking zones: area of demand and area of supply
- Real chart example: step-by-step
- Practical entry and risk rules
- Common mistakes to avoid
- Quick reference: what each candle means
- FAQ
- Final note
Why most candlestick patterns fail—and the simple fix
Candlestick patterns are treated like cheat codes: spot a hammer, a doji, or an engulfing candle and you think the trade is set. The problem is not the candles themselves. The problem is how they are used. A single bullish engulfing does not guarantee a rally. That same candle can fail spectacularly if you ignore context.
The secret is to read candles like a story. Every candle is doing one of three things: showing strength, showing a control shift, or showing indecision. Combine those signals with price context—speed, previous moves, and well-defined supply and demand zones—and you get a practical, repeatable edge.
The three candle types that actually matter
1. Strength candles
What they look like: large body, small wicks. The bigger the body, the more aggressive the move. A bullish strength candle with no upper wick means buyers faced zero resistance during that period.
What they tell you: buyers or sellers are in control. Size matters: a huge strength candle signals much stronger conviction than a tiny one.
2. Control shift (reversal) candles
What they look like: long wick and a small body. The body color is almost irrelevant—the wick is the story.
What they tell you: rejected price action. A large upper wick means buyers pushed price up but sellers rejected it and took control. A large lower wick means sellers pushed price down but buyers stepped in and reclaimed control. These candles often mark local turns.
3. Indecision candles (doji-style)
What they look like: small body with wicks on both sides—many shapes qualify.
What they tell you: neither side is winning yet. Indecision candles often appear before breakouts or reversals because the market is pausing to decide. They are not trade signals on their own.
How these three candles combine into a tradeable story
The real power comes when you read sequences, not single candles. A reliable pattern to watch for:
- An indecision candle appears at a level where price previously reacted (possible demand or supply).
- Directly after, a control shift candle appears showing which side won the indecision battle.
- A strength candle follows, confirming momentum in that direction.
When that sequence lines up with a price zone that previously led to a strong move, you have a low-guessing entry with clear risk and reward.
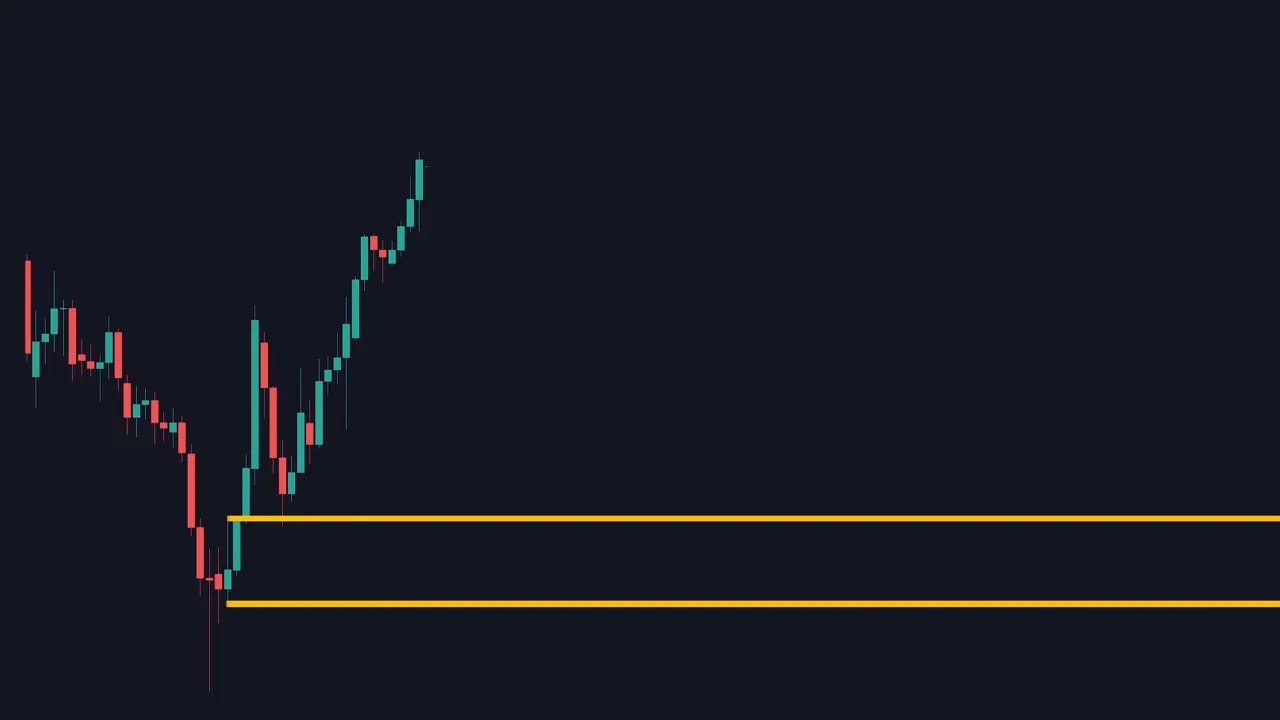
Marking zones: area of demand and area of supply
Don’t treat entries like guesses. Use zones built from the candles that started strong moves.
- Area of demand: mark from the low to the high of the candle that started a fast bullish move. That zone is where buyers previously stepped in en masse.
- Area of supply: mark from the low to the high of the candle that started a fast bearish move. That zone is where sellers previously took control.
These zones become targets for entries, take profits, and stop placements because they reflect actual previous control changes.
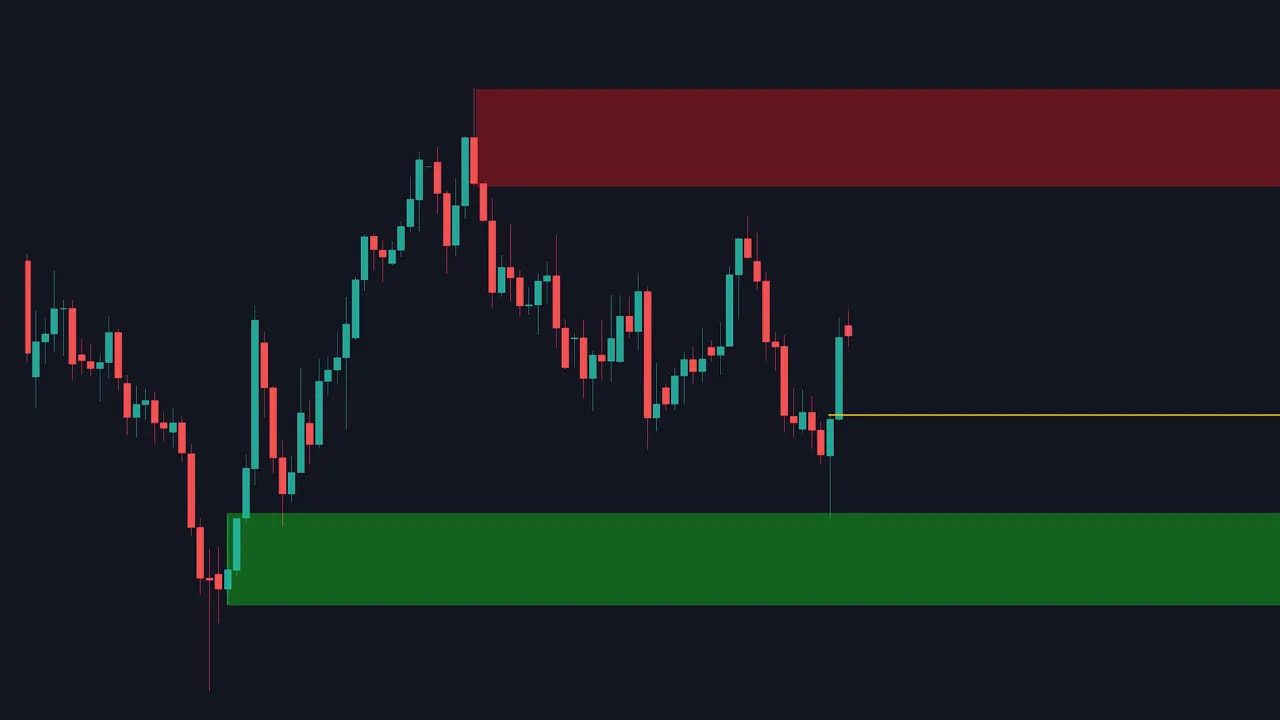
Real chart example: step-by-step
Here is how the sequence plays out in practice:
- During a downtrend, several indecision candles form at a price level. One of them has a large lower wick—buyers are showing interest there.
- A bullish strength candle appears and quickly erases the sellers’ previous work, signaling a fast buyers’ move. Mark this candle as the start of your area of demand.
- Price rallies into a higher area and then prints a red control shift candle (long upper wick). Sellers show up and a red strength candle follows—mark this as an area of supply.
- Price returns to the area of demand. While touching it, a green control shift candle appears and is followed by a green strength candle. Buyers have regained control.
- Wait for a pullback to the control shift candle and enter. Set take profit at the area of supply and stop loss below the original area of demand.
Practical entry and risk rules
- Never enter on a single candle alone.
- Look for sequence: indecision → control shift → strength.
- Confirm with zones: enter when price returns to the control shift candle inside a previously identified area of demand or supply.
- Place take profit at the opposing zone (area of supply for longs, area of demand for shorts).
- Place stop loss beyond the zone that legitimized the trade (below the area of demand for longs, above the area of supply for shorts).
- Pay attention to speed: if buyers erase 22 candles of selling in four candles, buyers are stronger right now—momentum matters.
Common mistakes to avoid
- Trading a bullish candle purely because it looks bullish without context.
- Ignoring wick information—wicks often reveal rejection and control shifts.
- Overfitting tiny strength candles as meaningful—size and speed matter.
- Skipping proper risk placement—always define stop loss relative to the zone that failed or held.
Quick reference: what each candle means
- Strength candle: control and momentum from buyers or sellers.
- Control shift candle: rejection—who won the fight when both tried to move price.
- Indecision candle: pause—market deciding direction. Use as context, not a trigger.
FAQ
How do I identify a strength candle reliably?
A strength candle has a large body relative to recent candles and small wicks. An ideal bullish example has no upper wick—buyers pushed price to the close without resistance. Size and context matter: compare the candle to the surrounding price action.
Where exactly should I put my stop loss and take profit?
Place take profit at the opposite zone (area of supply for long trades, area of demand for short trades). Place stop loss beyond the zone that legitimized the entry—below the area of demand for a long, or above the area of supply for a short. This keeps risk tight and logical.
Can I use these rules for day trading and swing trading?
Yes. The approach is scale-agnostic. Candles and zones work on intraday charts as well as daily charts. The main difference is the time frame you use to define zones and how wide stops need to be.
Are dojis useless?
Not useless. Indecision candles (dojis) signal a pause. They are valuable when paired with a control shift and strength confirmation. Dojis by themselves are not reliable trade triggers.
How many confirmations do I need before entering?
Look for at least two confirmations: a control shift followed by a strength candle, ideally inside a pre-identified zone. The more context (volume, prior reaction at the zone, speed of move), the higher the confidence.
Final note
Candlestick patterns are not magic. They are a language—read them correctly and combine their messages with price context and properly marked supply and demand zones. When you stop treating single candles as guarantees and start reading sequences, you turn guesswork into disciplined, repeatable trading. Implement this approach and your setups will become clearer, trades easier to size, and take profits will hit more often.
