

Table of Contents
- Why pure price action beats indicator noise
- How to approach these setups
- 1. Flag patterns: continuation and ideal add-on spots
- 2. Bear traps: profit from stopped-out shorts
- 3. Deceleration at supply: shrinking bullish candles
- 4. The triple tap: spotting trend exhaustion
- 5. Breakout buildup: the powerful breakout with less supply resistance
- Pair patterns with support and resistance
- Final checklist before you trade any price-action setup
- FAQ
Why pure price action beats indicator noise
Price action is the market speaking in its own language. If you learn to read it, you stop reacting to lagging indicators and start anticipating moves. That does not mean every signal works. It means you focus on patterns that show real shifts in control between buyers and sellers. Over time, that skill separates consistently profitable traders from the rest.
How to approach these setups
Look for context first: the dominant trend, clear support and resistance, and the momentum behind each move. Then use simple rules for entries and risk. Below are the high-probability price action secrets that I use repeatedly: flags, bear traps, deceleration at supply, the triple tap, and the breakout buildup. Each one is easy to spot once you know what to look for.
1. Flag patterns: continuation and ideal add-on spots
A flag is a continuation setup that appears after a strong directional move. You get a steep, decisive leg in one direction, then a shallow, corrective channel that looks like a flag.
The key detail: the corrective flag must be much shallower than the initial trend. That shallow angle tells you buyers are present but weak. Sellers still control the market, so the most logical trade is to enter in the direction of the prior trend when price breaks the flag.
Entries and variants:
- Enter on the breakout of the flag trend line for an aggressive entry.
- Wait for a retest of the broken trend line for a safer entry and tighter stop loss.
Watch how momentum behaves on the move after the breakout. A fast, impulsive drop following a flag often leads to a period of consolidation. If that consolidation breaks in the direction of the impulse, adding to shorts or re-entering on the break is often a high-odds decision.
Crypto traders: if you trade multiple coins across blockchains, consider using crypto signals that scan for flag breakouts and retests. A reliable signal service can surface these setups quickly, so you do not miss short-term add-on opportunities.
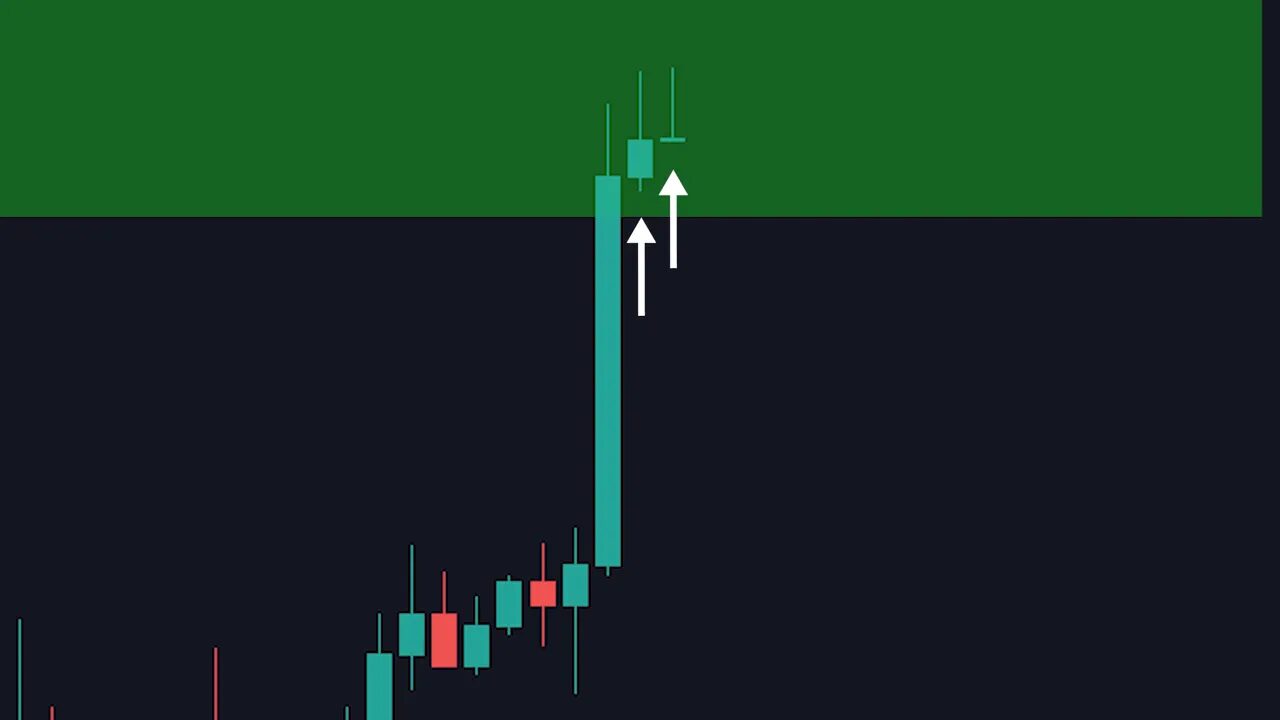
2. Bear traps: profit from stopped-out shorts
A bear trap happens when price breaks a support level and spooks breakout short sellers and profit takers, only to reverse back above that support. Thinking like the short seller helps you spot these traps: most will take profit near obvious support and place stops just above it.
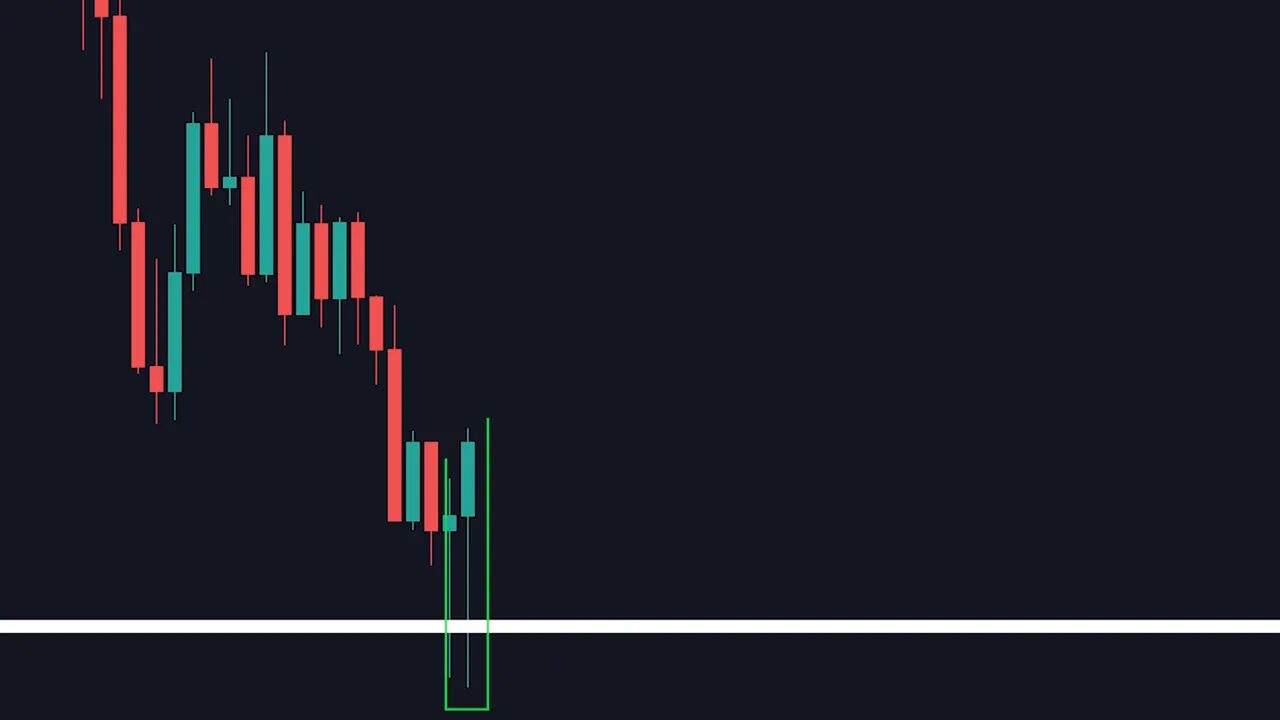
Why this setup flips into a bullish engine:
- Short covering from breakout traders helps fuel the reversal.
- A bullish momentum candle such as an engulfing candle adds conviction.
- If the false-break happens more than once at the same level, it becomes a very strong sign sellers lack follow-through.
Trade plan: wait for price to reclaim the broken support (now resistance-turned-support) or break the resistance that held during the trap. Enter on the confirmation candle or on a retest.
If you trade crypto, a signals service that flags repeated false-breaks and momentum candles across exchanges can save time and highlight the most promising bear trap reversals.
3. Deceleration at supply: shrinking bullish candles
Deceleration shows up when price reaches a supply zone and the candles lose size and conviction. A strong uptrend should display increasing bullish candle size. When candles shrink at supply, that shrinking indicates buyers are tiring.
How to act:
- Drop down to a lower timeframe to find a clear support or trend line inside the supply rejection.
- Look for a breakout lower inside that micro pattern. If the move retests and forms a bull trap, the downtrend often resumes.
Using lower timeframes refines risk and lets you place tighter stops while waiting for confirmation rather than guessing the reversal at the higher timeframe supply zone.
4. The triple tap: spotting trend exhaustion
The triple tap is a reversal setup that signals an uptrend is losing steam. It is simply three attempts to make a new high where each attempt becomes weaker than the last.
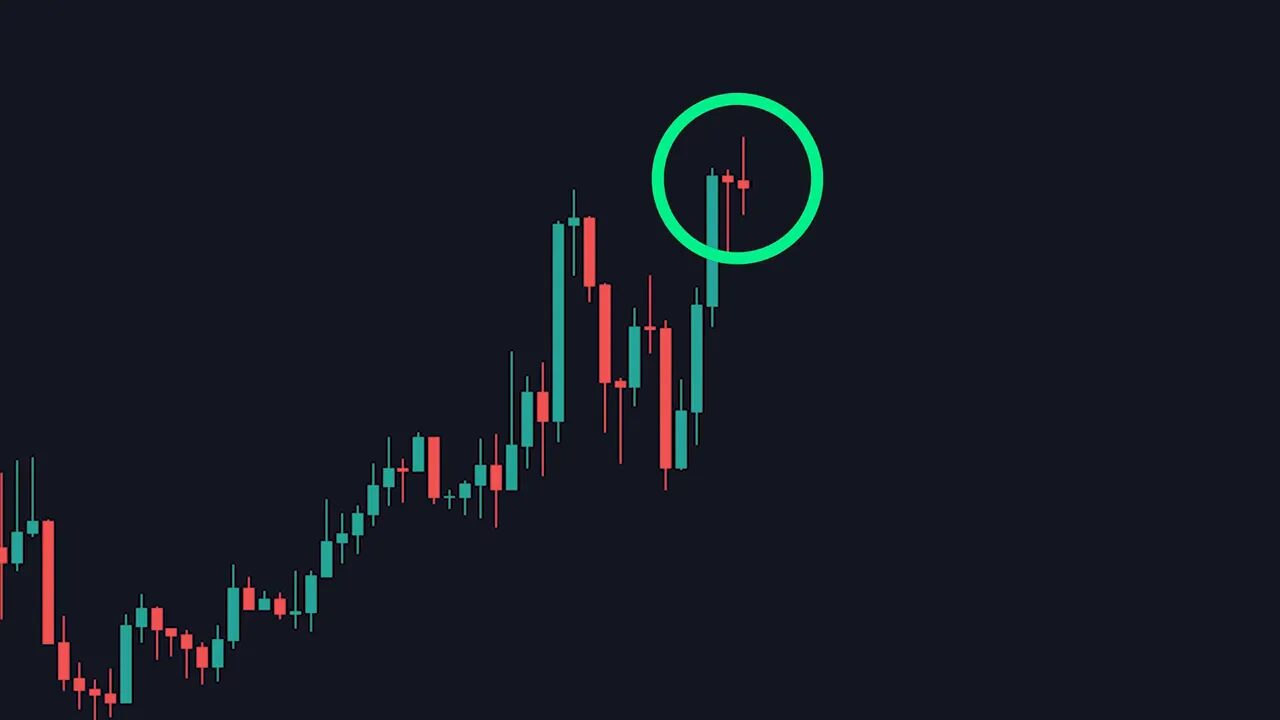
Warning signs to watch for:
- Each successive high is smaller or barely improves on the previous high.
- Price spends longer consolidating between attempts.
- A lower high after the triple confirms sellers are gaining control.
When you see that pattern, prepare to enter short once a clear lower high or break of structure appears. This setup often precedes sharp collapses because exhausted buyers leave the market and selling pressure accelerates.
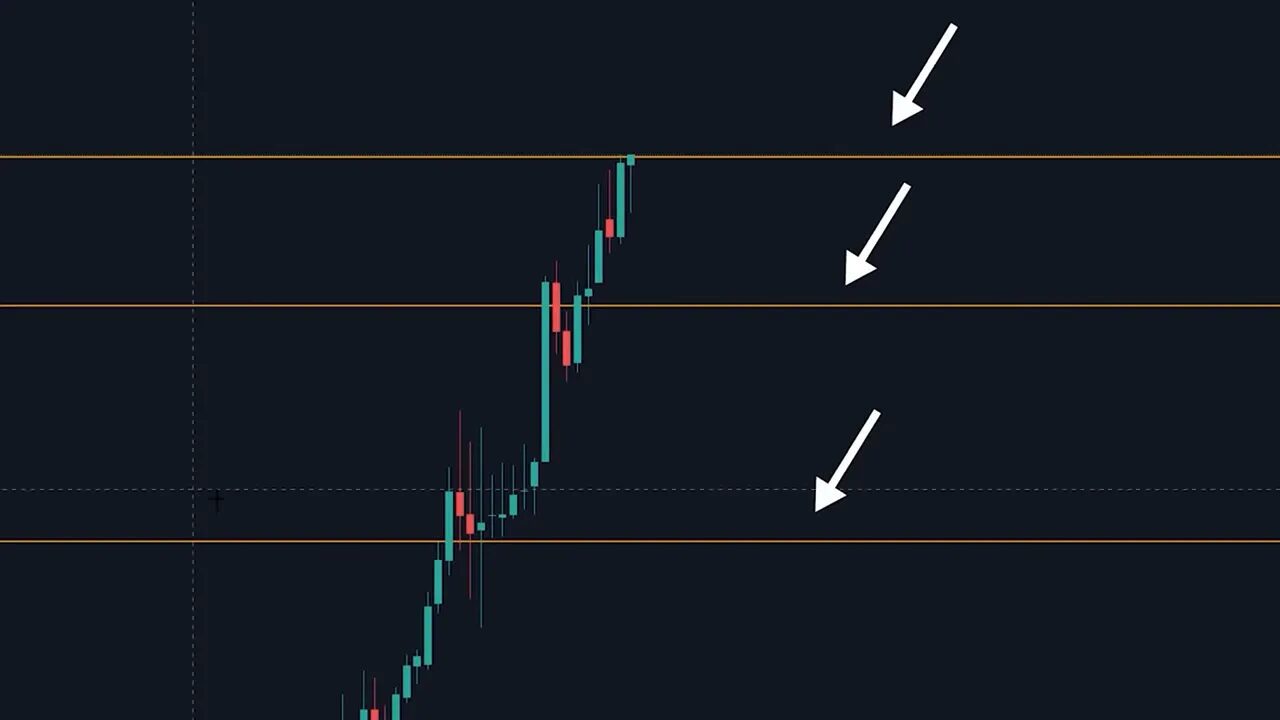
5. Breakout buildup: the powerful breakout with less supply resistance
The breakout buildup is one of the most reliable bullish patterns. Price makes higher highs and higher lows, then hits resistance and pulls back but does not break the previous low. The subsequent retest of resistance shows much less selling pressure and then consolidates right beneath resistance.
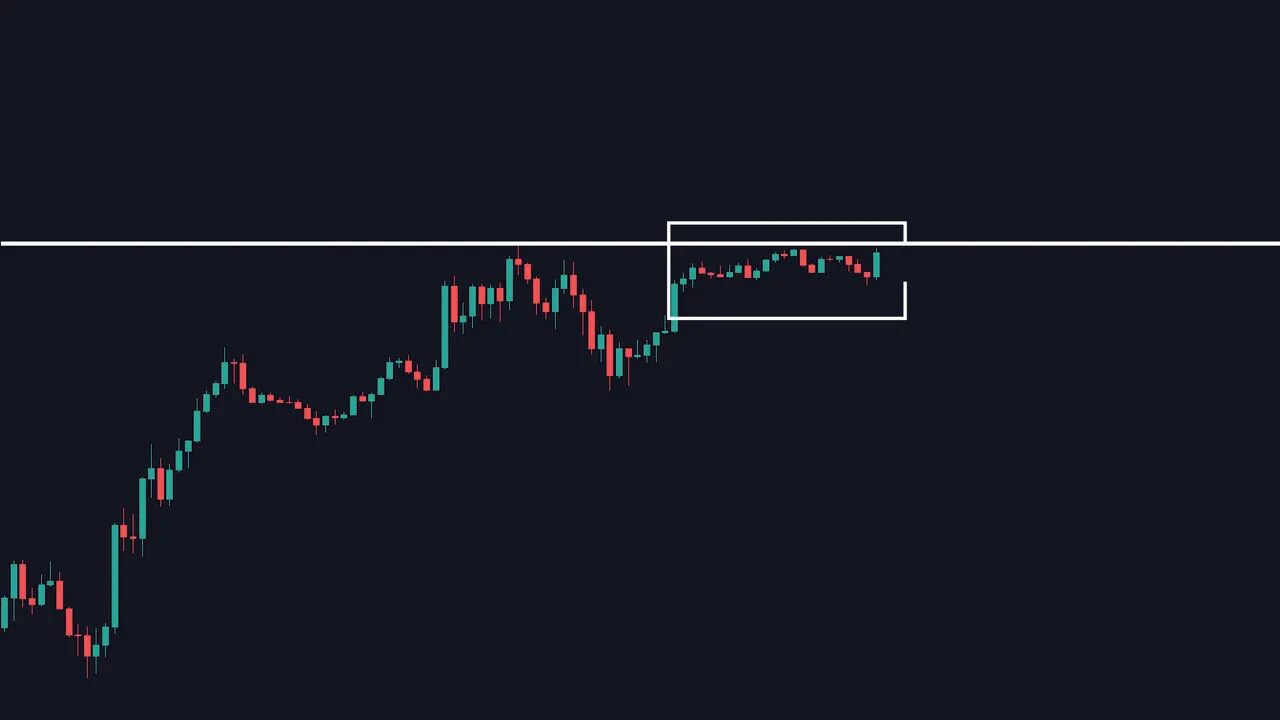
Why this matters:
- Less aggressive bounces off resistance indicate sellers are weakening.
- Consolidation under resistance often represents buyers accumulating.
Trade plan: enter on a close above resistance or wait for a retest of the breakout for a higher probability entry. Always wait for a candle close above and manage risk with a stop below the breakout retest level.
This pattern translates well across crypto markets. A crypto signals service that tracks volume and price behavior around resistance levels can highlight breakout buildups before they erupt, allowing you to position earlier with better risk management.
Pair patterns with support and resistance
Price action works best when combined with accurate support and resistance levels. Patterns like flags, bear traps, deceleration, triple taps, and breakout buildups become far more reliable when mapped to clear horizontal levels or trend lines.
Mastering how to draw those levels and then overlaying the patterns above will change the way you trade. If scanning charts across blockchains is part of your workflow, consider supplementing your process with crypto signals that pre-filter setups using your preferred S and R framework.
Final checklist before you trade any price-action setup
- Confirm the higher-timeframe trend and context.
- Check momentum: impulsive moves followed by weak corrections are ideal for continuation trades.
- Look for confirmation: breakout candle close, retest, or a momentum candle (engulfing, pin, or large-range candle).
- Use lower timeframes to refine entries and stops.
- Manage risk: position size for a stop that makes sense with your edge.
FAQ
What is price action trading and why is it important?
Price action trading focuses on interpreting raw price movement and chart patterns to make trading decisions. It is important because it removes reliance on lagging indicators and helps you understand who controls the market at any moment: buyers or sellers.
How do I trade a flag pattern safely?
Identify the steep initial move, confirm the corrective channel is shallower, then enter on the breakout of the flag trend line. For a safer approach, wait for a retest of the broken trend line and enter with a tight stop below the recent structure.
What confirms a bear trap reversal?
Look for a false break of support followed by a strong bullish momentum candle, short covering, and then a reclaim or breakout of the prior support-turned-resistance. Multiple false-breaks at the same level strengthen the reversal signal.
Which timeframes should I use with these setups?
Start on the higher timeframe to identify trend and context, then drop to lower timeframes to refine entries and stops. For example, use the four-hour to locate supply or demand zones and a 15-minute to get a clean breakout or retest entry.
Can I automate finding these patterns in crypto markets?
Yes. Many services and scanners exist that detect patterns, volume shifts, and false-breaks across exchanges. Complementing your manual analysis with crypto signals can surface high-probability setups across different blockchains so you can act faster.
